Power BI business analytics

Business analytics with Power BI

Analyse your Rivilė or Finvalda data in real time with Power BI. Make better decisions and stay a step ahead.
Data in real time Automatic refresh Rivilė and Finvalda
Analytics for executives
Updated
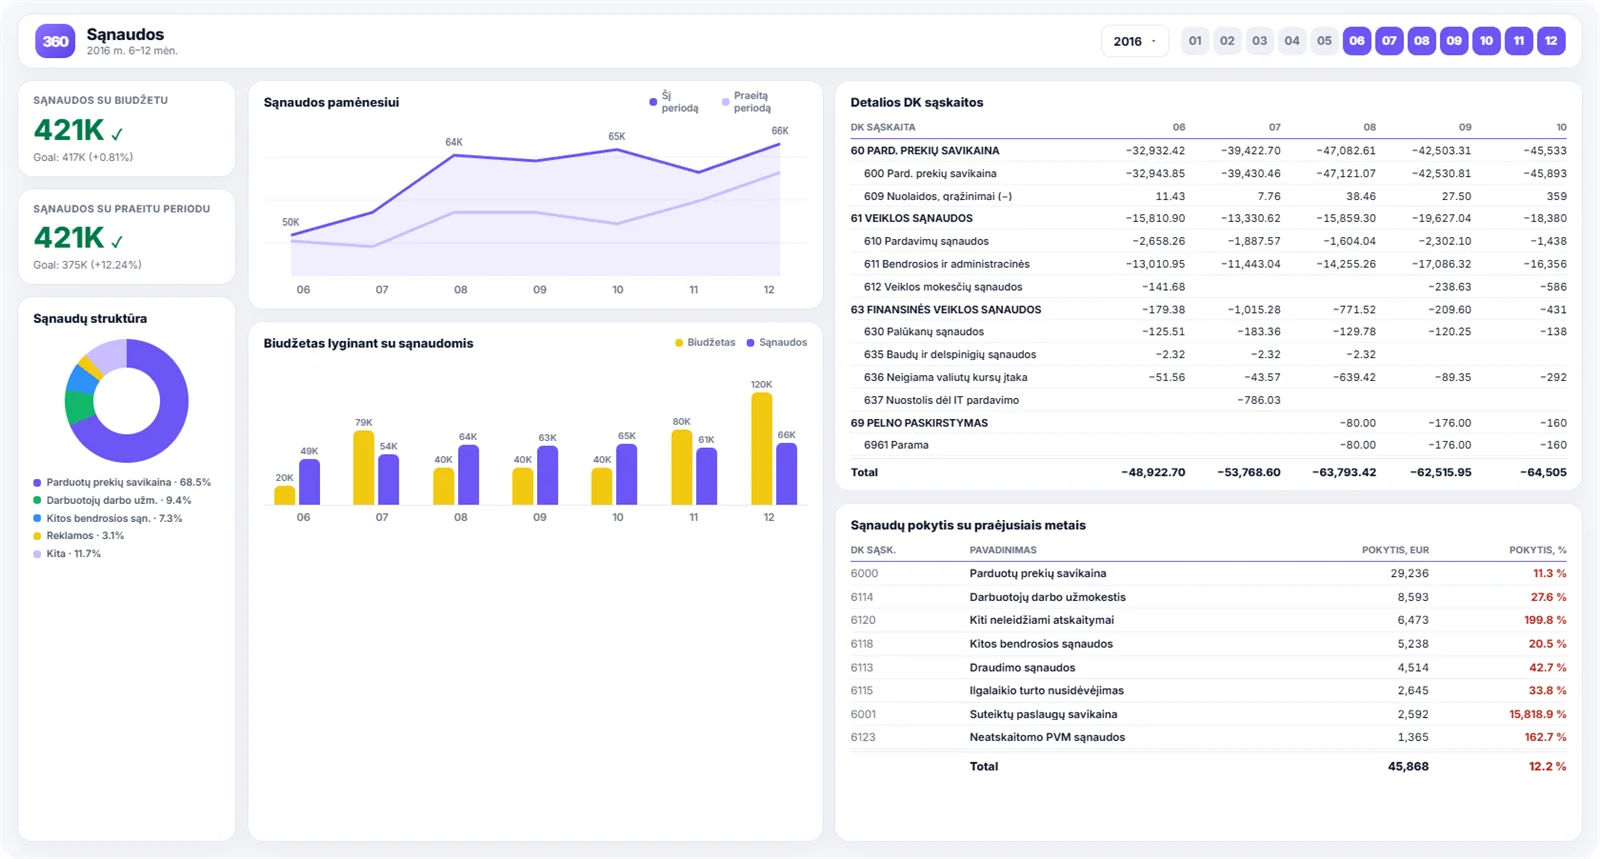
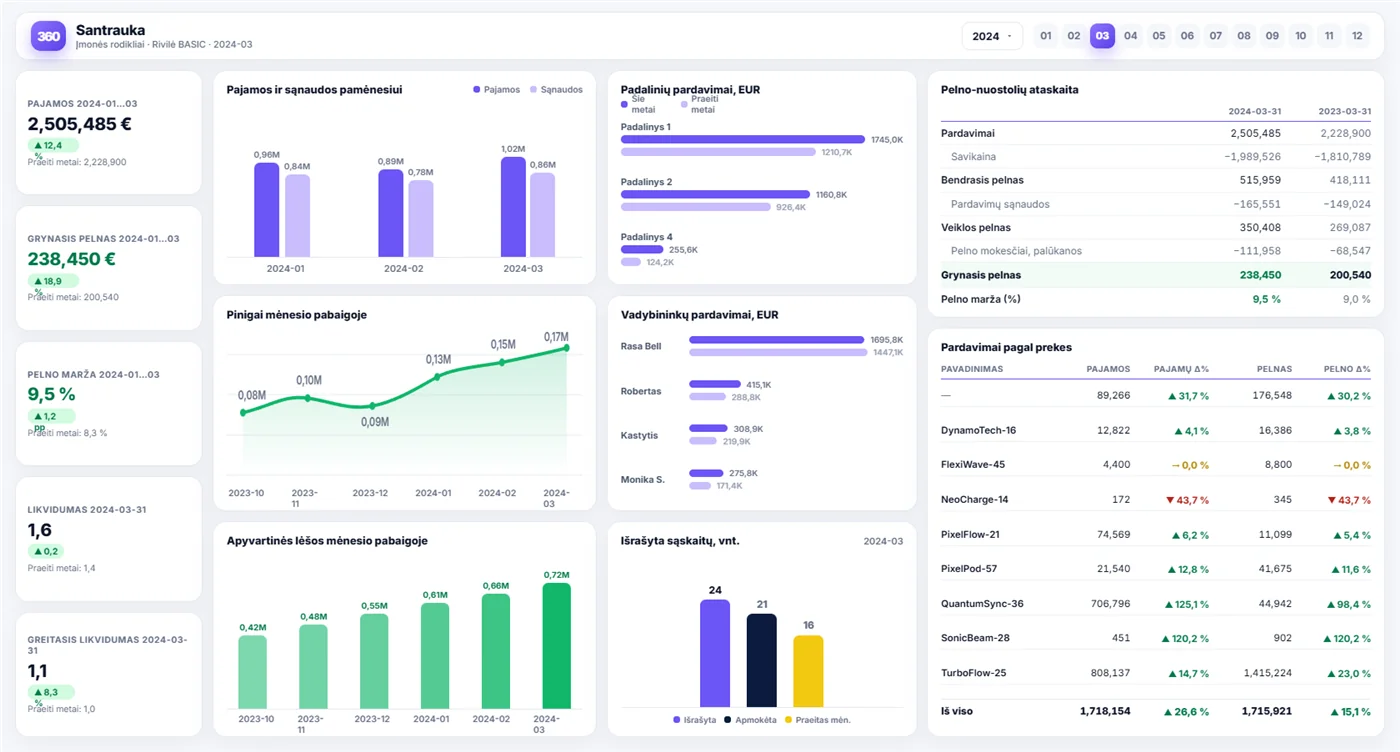
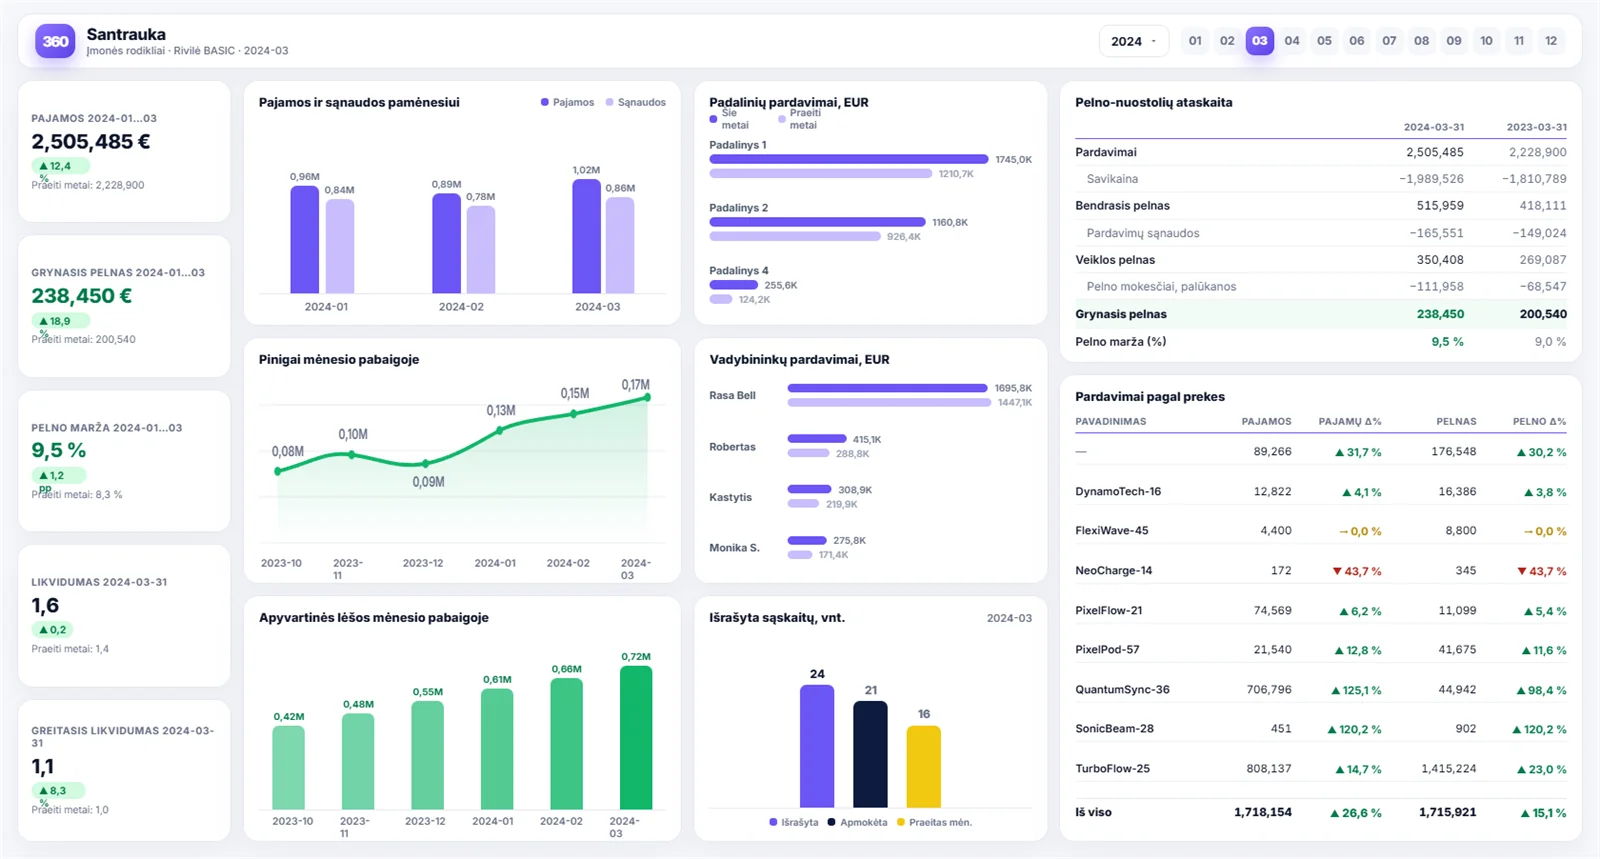
Business analytics with Power BI — an example of the executive summary report
A secure data connectionMFA, TLS 1.2 and VPN support

Already using Analitika360:

TOPO CentrasCandy PopAICSushi ExpressFortas restoranų grupėBIPACarglassUstukių malūnasStatetaVirginijus ir Ko
Business analytics for fast-moving businesses

Analyse data straight out of Rivilė or Finvalda in Power BI, without the busywork

01

Data analytics

Analitika360 Power BI reports let you compare periods, spot trends and see forecasts. Pick the periods and filters you want, and read the numbers in real time.

02

Reports that look after themselves

Analitika360 reports need no maintenance. They pick up new data from Rivilė or Finvalda automatically, including new groupings as they appear — new business units, managers, products and so on.

03

Data from any source

Bring in data from more than the accounting system — SharePoint, OneDrive, Excel, CRM, payroll, logistics and ERP systems, and others.

Ready-built Power BI solutions

Business analytics for Rivilė and Finvalda users

Choose your accounting system and your report set. The data refreshes itself, so the figures that matter are always in one place.

Report preview

Everything that matters about the business, in one system

Pick a report and see what it shows.

Power BI analytics for executives

The company's headline figures for an executive: revenue, costs, profit, receivables and payables, liquidity ratios, and a comparison against the same period a year earlier.
PRO plan
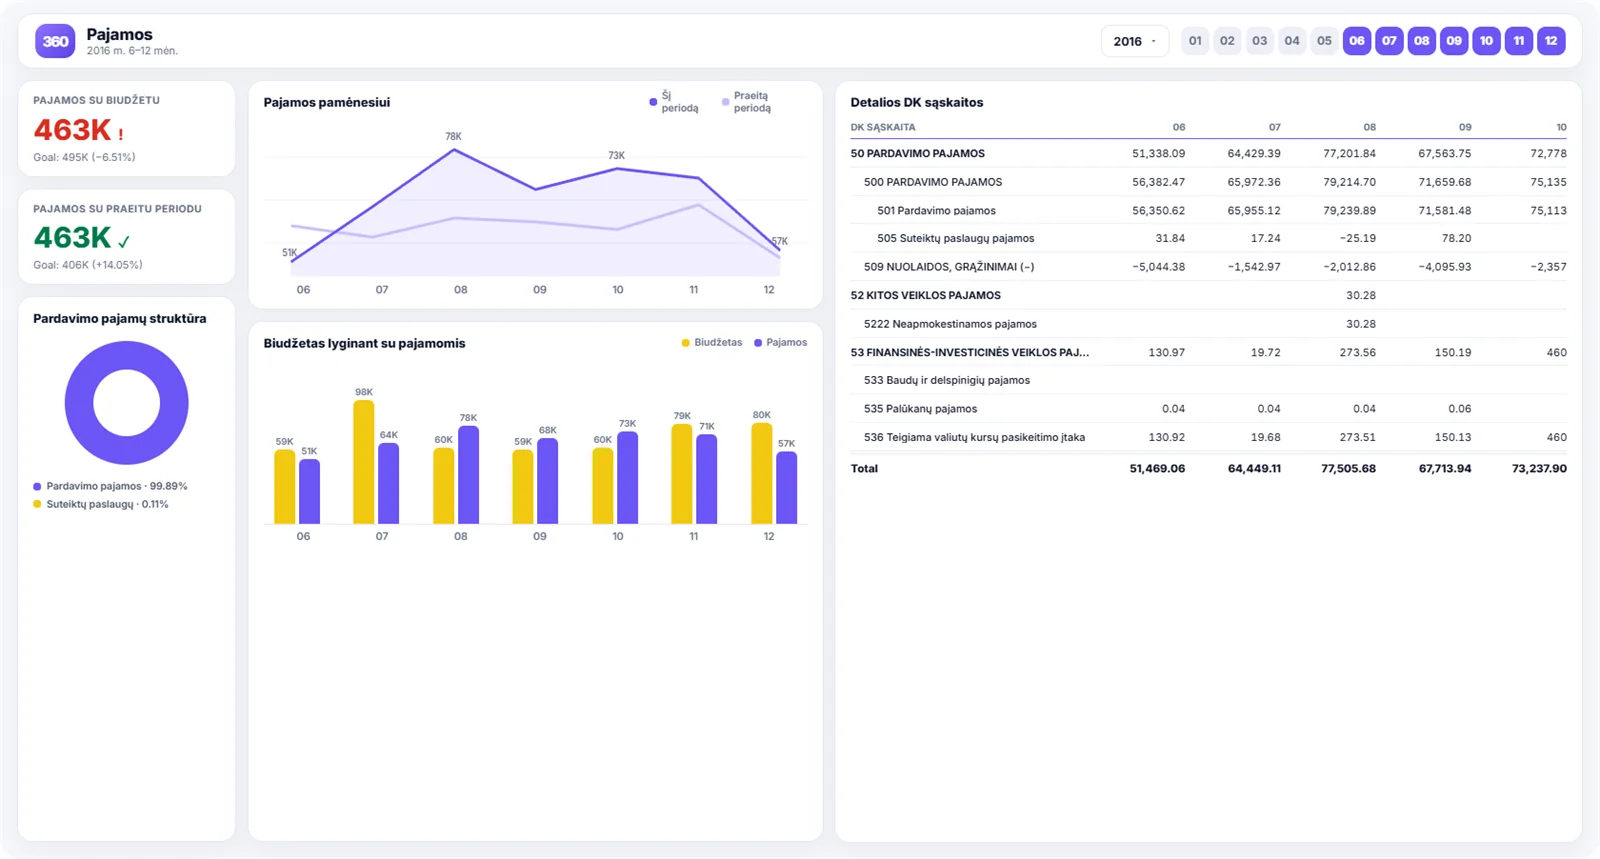
An example Power BI report

The main reports included in the system

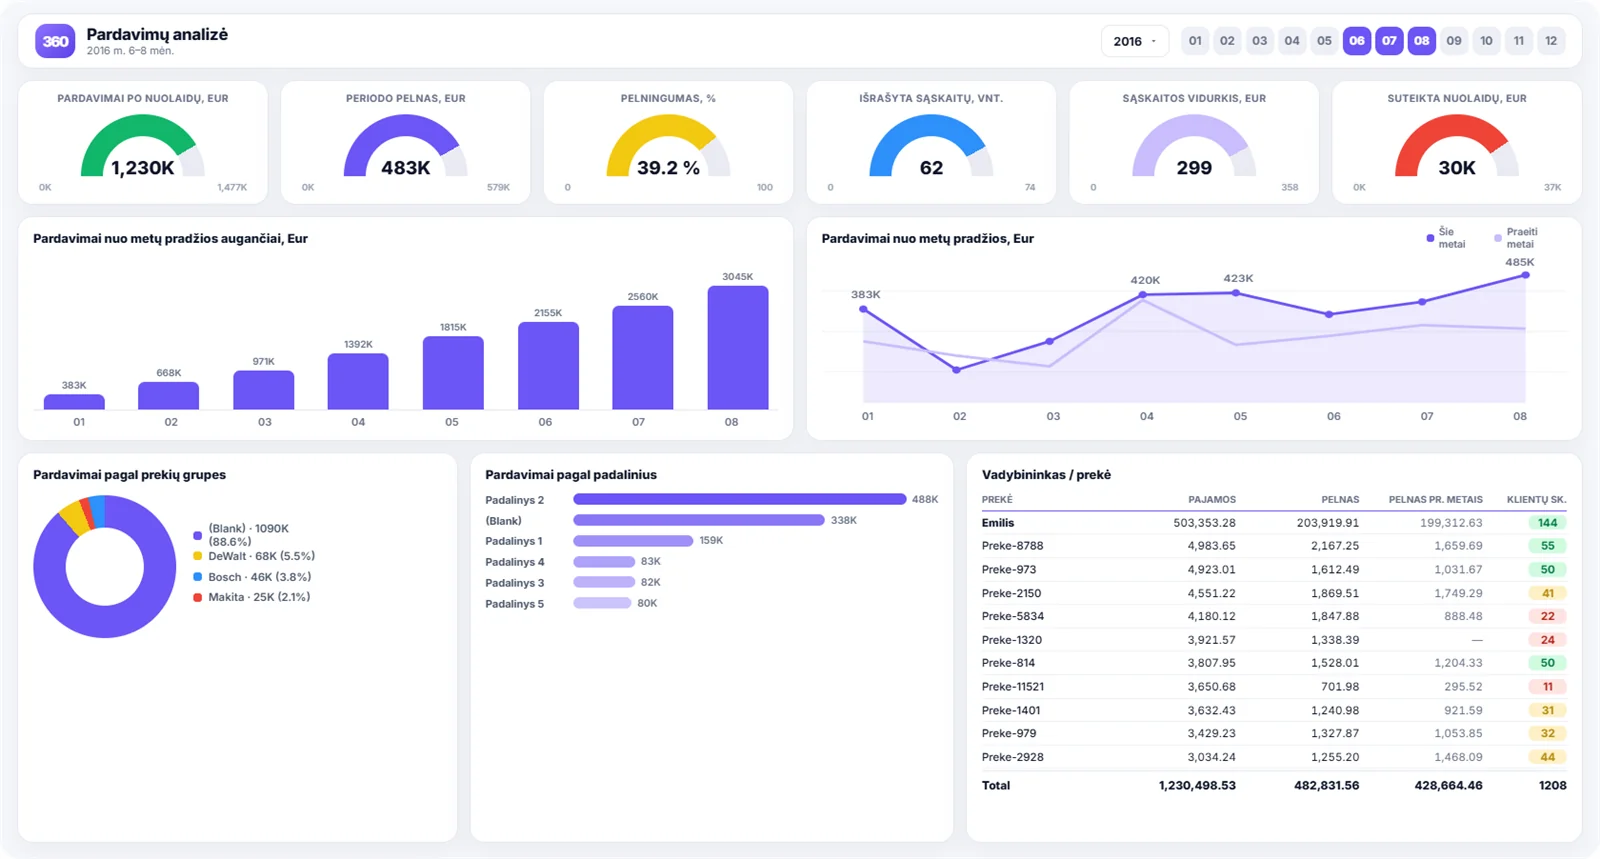
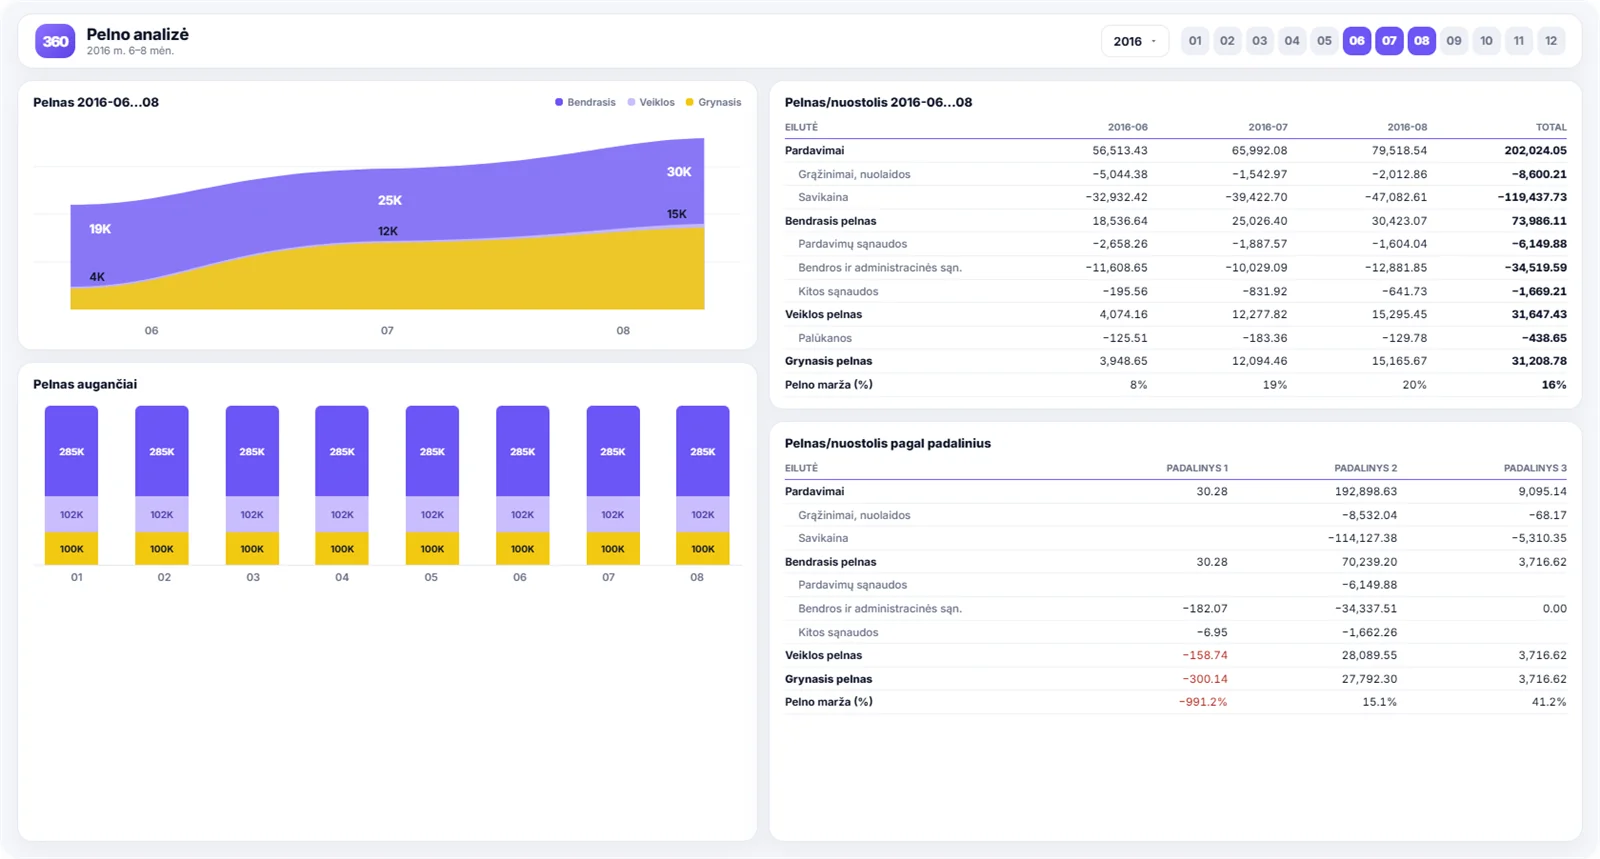
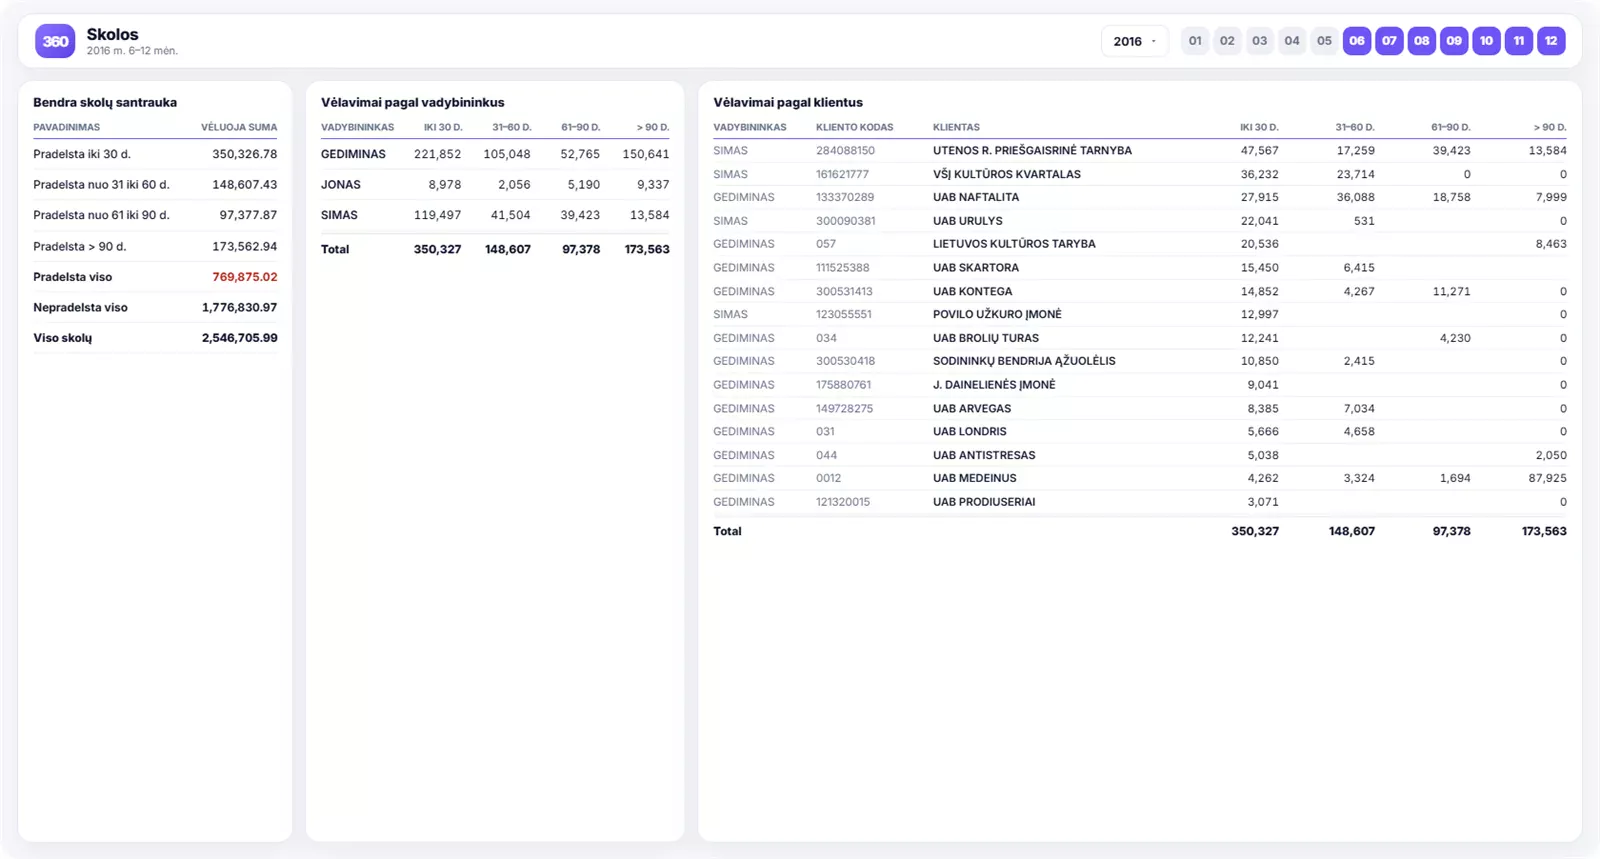
The reports cover finance, sales, customers, debt and stock, and the data can be filtered by period, business unit, account manager and more.

Revenue analysisCost analysisRevenue and cost movementsSales analysisProduct profitabilitySupplier profitabilityCustomer analyticsOverdue paymentsBalance sheetProfit and loss statementDebt analyticsSlow-moving stockWarehouse stock on handDetailed sales analysis
About Analitika360

Advanced IT solutions for business since 2008

Analitika360 builds advanced IT solutions for business. Since 2015 we have specialised in designing and implementing business intelligence (BI) systems. We are a Microsoft partner, which lets us build innovative and genuinely usable analytics systems on the latest platforms.

Using ETL processes and Power BI, our team brings data from many sources together into one system. The reports we build are automated, refresh on whatever schedule the client needs, and can be tailored to order.

More about us
2008
The company starts tradingModern, effective technology for business.
2015
Working with Power BIFrom this year on, business analytics systems become our speciality.
300+
Projects deliveredMore than 300 Power BI projects delivered.
2018
Microsoft Power BI partnerPartner-level competence and hands-on Microsoft experience.
Analitika360 client stories

Data that helps you decide

See how companies like yours put Analitika360 reports to work in Power BI.

We took the standard R-Keeper report package and they tailored it to us on top of that. It all just works.
TB
Tomas B.restaurant owner
Twenty ready-made reports — we didn't have to work out what to ask for. Our Finvalda data is finally something you can look at. Recommended.
IM
Ingrida M.accountant
What we liked was that Analitika360 already had a 20-report package for Rivilė users — we didn't have to work out our requirements from scratch. We were up and running quickly, and later they adapted several reports to the specifics of our production. It saved us both time and money.
MK
Marius K.finance director
We are a group of companies running Rivilė, and consolidated reporting was always a headache. Analitika360 started from the standard 20-report package and then fitted it to our group structure — we now see everything in one Power BI model, and it refreshes itself.
GJ
Giedrė Jankauskaitėfinancial accountant
We run six restaurants on R-Keeper and had long been looking for a way to compare results across sites. The standard 20-report package covered most of what we needed, and reports specific to our group were added later.
Andrius Š.director of a restaurant group
We came to them on a recommendation, and the ready-made 20-report standard for Finvalda users was a pleasant surprise straight away. Management now gets a clear financial picture every Monday, and I no longer spend days exporting data into Excel.
RP
Rasa Petrauskienėhead of accounting
We use Rivilė, but we never had time to build reports from scratch. The 20-report package was exactly what we needed — we had it running within a week.
VP
Vaidas P.retail chain manager
We have four cafés on R-Keeper and for a long time we ran them on gut feel. The Analitika360 reports showed us things we had simply never noticed. We now decide on the numbers rather than on guesswork.
LK
Laura Kazlauskienėfinance director of a café group
Get in touch

Start reading your business data in real time, and decide while it still counts

Tell us which accounting system you use and which figures you want to see. We will show you how Analitika360 reports would work in your company.

+370 681 23 191 [email protected] Kareivių g. 11B, Vilnius, Lithuania