






“
We took the standard R-Keeper report package and they tailored it to us on top of that. It all just works.
A clinic's revenue is driven by occupancy: how many appointments fit into a working day, and how many actually happen. These reports show that by clinician, by room and by service.
A clinic's revenue is driven by occupancy: how many appointments fit into a working day, and how many actually happen. The booking system has the diary and the accounts have the revenue; only joined together do they show what an empty slot costs.
Power BI analytics works that out automatically. The management reports show occupancy by clinician and by room, and the did-not-attend rate by day of the week and by clinician, so reminders are aimed where they are needed most.
How much of the working day is actually filled with appointments. It is the clinic's main revenue driver, and the one easiest to improve without spending anything.
Revenue from a procedure less materials and clinician time. Some popular services earn considerably less than they appear to once materials are counted.
Every no-show is an empty slot in the diary. Broken down by clinician and day of the week, it shows where a reminder system would pay.
Private payments, insurers and state-reimbursed services kept apart — they carry quite different margins and payment terms.
How many patients come back, and how soon. For a clinic that matters more than the flow of new patients.
Together with the number of appointments, it explains any change in revenue — more patients came, or they received more treatment.
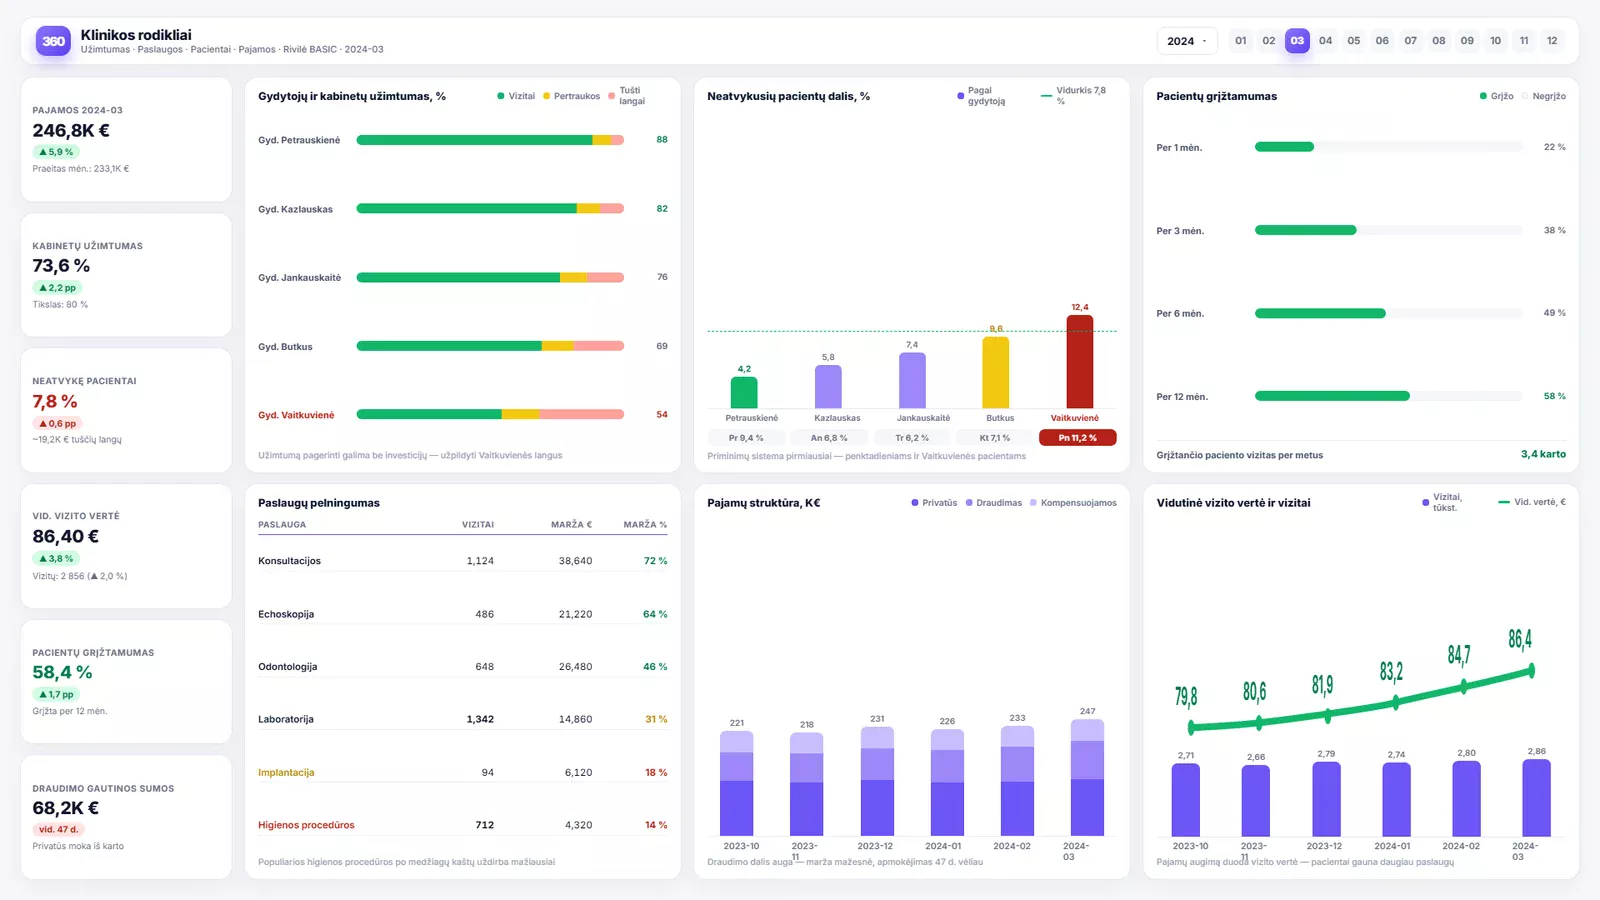
Clinician and room occupancy are shown with breaks and empty slots separated out. The difference between clinicians often runs to tens of percentage points — and it can be filled without spending anything.
The did-not-attend rate is given by clinician and day of the week, against the average. Next to it is the patient return rate at 1, 3, 6 and 12 months — a figure that matters more to a clinic than the flow of new patients.
Profitability by service separates popularity from earnings: a frequently performed procedure can earn the least once materials are counted. The revenue mix keeps private payments, insurers and reimbursed services apart — they carry different margins and different payment terms.
See how companies like yours put Analitika360 reports to work in Power BI.
Most people start with a ready-built report set, which connects to your accounting system within a few days, and add the industry-specific reports as a second stage. Describe your situation and we will tell you what would work best in your case.