






Solutions

Business analytics for rental companies

In rental it is not the asset that earns but its use. These reports show how much of the time each unit is actually working, what it brings in, and what it costs to keep.

Pricing and plans
Accounting vs analytics
Accounting

In rental it is not the asset that earns but its use. A unit sitting in the yard costs the same as one out on hire — it just brings in nothing.

Hire agreementsRepair invoicesPurchase pricesDowntime = a single number?
Business analytics

Automated reports join the hire agreements, the accounts and the repair records, so utilisation, revenue per unit and maintenance costs are read together. That is the only way to see when a unit should be replaced and when a new one should be bought.

Rivilė / FinvaldaHire management system
Joined up overnight Utilisation and payback, per unit

The figures worth watching

Fleet utilisation

How many days a month each unit is actually out on hire. It is the central figure in a rental business — everything else follows from it.

Revenue per unit

Not total turnover, but what each machine or unit brings in. Two identical units earning different amounts always have an explanation.

Reasons for downtime

Repair, servicing, sitting in the yard, or simply no demand — four quite different problems with four different answers.

Maintenance and repair costs

By unit and by age. When repair costs rise faster than revenue it is time to replace the unit — and the numbers show exactly where that point is.

Payback per unit

Cumulative revenue against purchase price and cumulative costs. It shows which asset categories are worth buying more of at all.

Average hire length and rate

A longer hire at a lower rate is often more profitable than a short expensive one, because there is less idle time between customers.
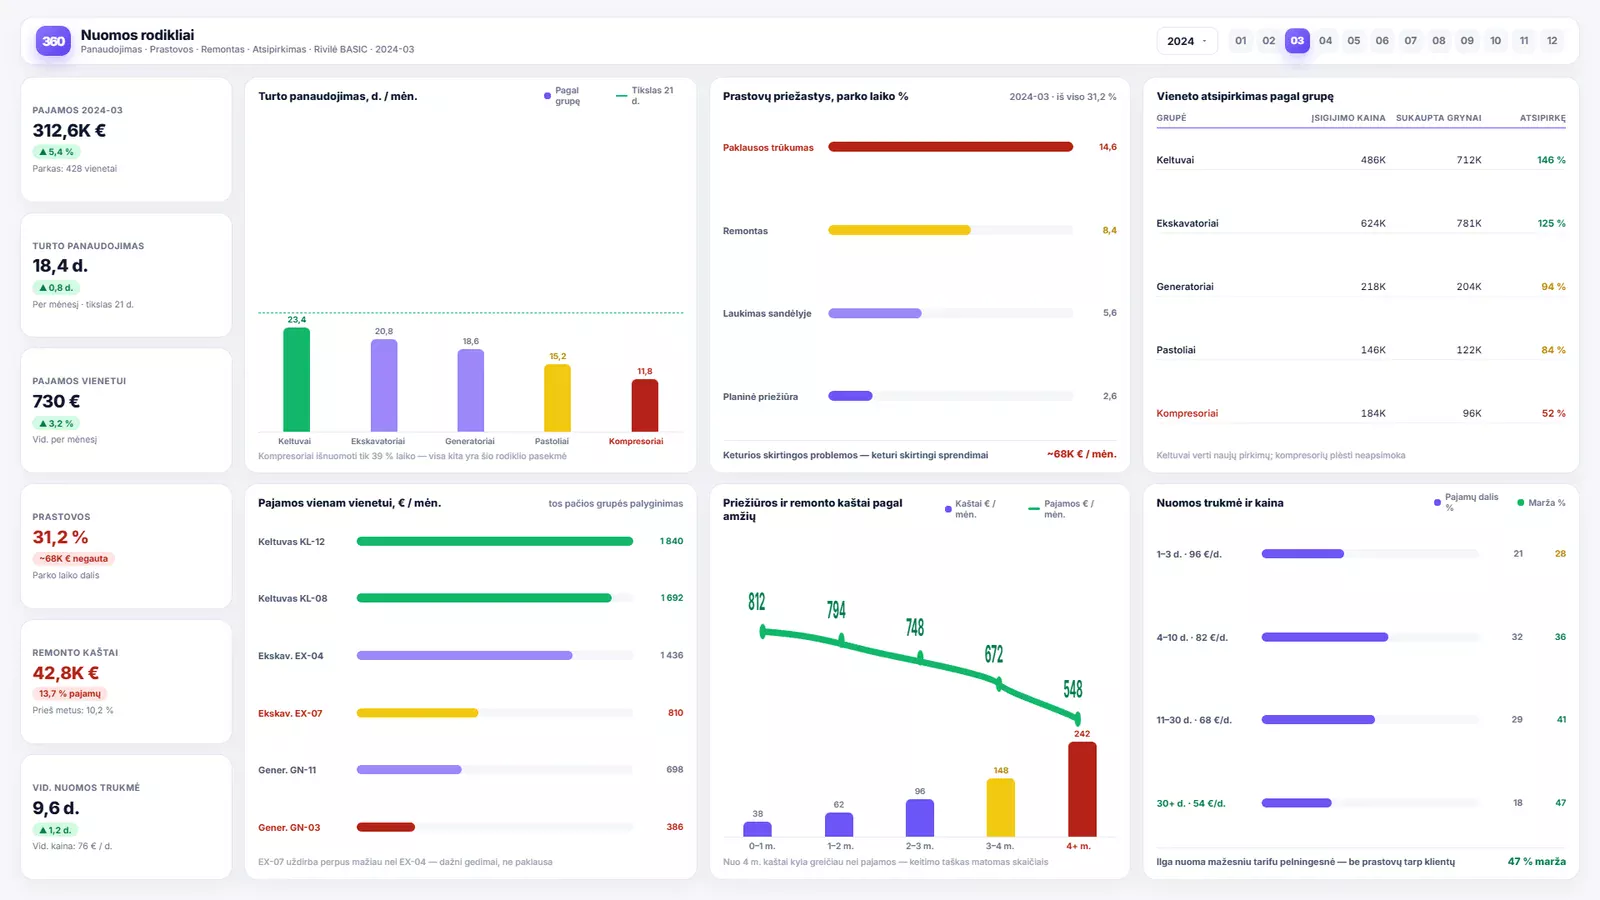
How it looks in the report

Business analytics for rental companies — Power BI ataskaitos pavyzdys
A sample report using demonstration data.
How to read the report
01

Fleet utilisation

Utilisation is shown by asset group against a target — a group that is out on hire a third of the time is visible at once, and everything else in the report follows from that figure.

02

Reasons for downtime

Downtime is broken into lack of demand, repair, waiting in the yard, and planned maintenance. Those are four different problems: one is solved by sales, another by engineering, a third by logistics.

03

Payback and costs

Payback per unit sets purchase price against cumulative revenue by group, and maintenance costs by age show the point at which repairs start rising faster than revenue. The hire-length view answers whether a longer hire at a lower rate beats a short expensive one.

Where the data comes from

  • the hire or booking system (agreements, periods, rates)
  • the accounting system
  • maintenance and repair records per unit
  • telematics or GPS data, where the equipment collects it
Read access The connection is read-only — the reports read your data, change nothing, and never write back to your systems.

What people usually notice first

  1. 1 The usual finding is a difference in utilisation between identical units. Some are out almost constantly and others sit still, though they are the same machine: the reason is usually where they are stored, or what the booking system offers first.
  2. 2 The second is asset categories where repair costs already exceed revenue, but which stay hidden because more successful categories cover for them in the combined result.
Analitika360 client stories

Data that helps you decide

See how companies like yours put Analitika360 reports to work in Power BI.

We took the standard R-Keeper report package and they tailored it to us on top of that. It all just works.
TB
Tomas B.restaurant owner
Twenty ready-made reports — we didn't have to work out what to ask for. Our Finvalda data is finally something you can look at. Recommended.
IM
Ingrida M.accountant
What we liked was that Analitika360 already had a 20-report package for Rivilė users — we didn't have to work out our requirements from scratch. We were up and running quickly, and later they adapted several reports to the specifics of our production. It saved us both time and money.
MK
Marius K.finance director
We are a group of companies running Rivilė, and consolidated reporting was always a headache. Analitika360 started from the standard 20-report package and then fitted it to our group structure — we now see everything in one Power BI model, and it refreshes itself.
GJ
Giedrė Jankauskaitėfinancial accountant
We run six restaurants on R-Keeper and had long been looking for a way to compare results across sites. The standard 20-report package covered most of what we needed, and reports specific to our group were added later.
Andrius Š.director of a restaurant group
We came to them on a recommendation, and the ready-made 20-report standard for Finvalda users was a pleasant surprise straight away. Management now gets a clear financial picture every Monday, and I no longer spend days exporting data into Excel.
RP
Rasa Petrauskienėhead of accounting
We use Rivilė, but we never had time to build reports from scratch. The 20-report package was exactly what we needed — we had it running within a week.
VP
Vaidas P.retail chain manager
We have four cafés on R-Keeper and for a long time we ran them on gut feel. The Analitika360 reports showed us things we had simply never noticed. We now decide on the numbers rather than on guesswork.
LK
Laura Kazlauskienėfinance director of a café group

Where to start

Most people start with a ready-built report set, which connects to your accounting system within a few days, and add the industry-specific reports as a second stage. Describe your situation and we will tell you what would work best in your case.

Report examples