






Solutions

Business analytics for retail stores

In retail the decisions turn on detail: which store, which hour, which product. These reports join till and accounting data so every site sits in one table.

Pricing and plans
Accounting vs analytics
Accounting

In retail the decisions turn on detail: which store, which hour, which product. The till has the receipts and the accounts have the cost of sales and the stock; only joined together do they show margin rather than just turnover.

Till receiptsCost of salesStock on handDiscounts = a single number?
Business analytics

Ready-built Power BI reports do that automatically: data from Rivilė and the till system refreshes every night, and every site appears in one table on the same measures.

Rivilė / FinvaldaTill system
Joined up overnight Margin by product and by site

The figures worth watching

Turnover by site and hour

The hourly view usually pays off fastest: shifts start being planned around real footfall rather than habit.

Average basket and number of transactions

Together they explain any change in turnover — whether you grew on footfall or on basket size.

Product profitability

The best-selling product and the most profitable one are rarely the same. Sorting by margin changes what you decide to stock.

Stock on hand and slow movers

How much money is sitting on the shelves and in the warehouse. The slow-moving list feeds straight into the buying plan.

The effect of discounting

How much margin was given away to make the sale, and whether the promotion brought in new customers or simply discounted the existing ones.

Site-by-site comparison

Stores trading under the same conditions but with different margins almost always point to a management difference, not a market one.
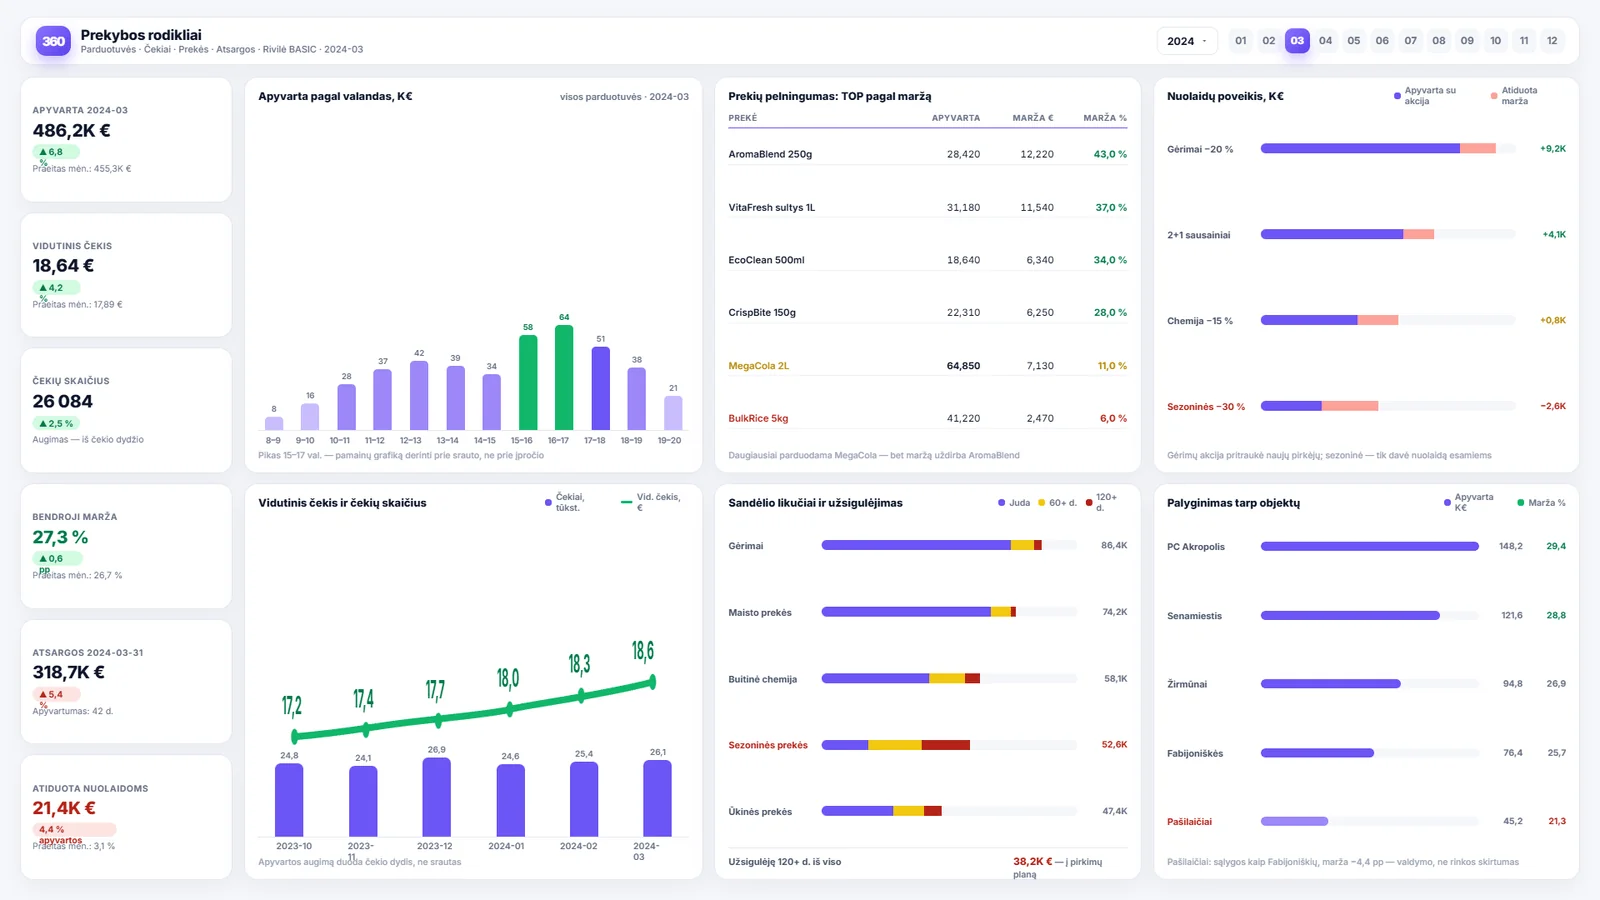
How it looks in the report

Business analytics for retail stores — Power BI ataskaitos pavyzdys
A sample report using demonstration data.
How to read the report
01

Turnover by hour

Turnover by hour usually pays off fastest — the peaks in footfall rarely line up with the shift rota, and adjusting the rota costs nothing.

02

Products and discounts

Product profitability is sorted by margin rather than turnover, so the products that sell most and earn least are immediately visible. The discounting block shows how much margin was given away and whether the promotion brought in new customers.

03

Stock and sites

At the bottom: stock on hand with the slow-moving view, and a site-by-site comparison. Stores trading under the same conditions but with different margins almost always point to a management difference, not a market one.

Where the data comes from

  • the till system (receipts, products, timestamps)
  • the accounting system (cost of sales, stock, suppliers)
  • the loyalty scheme, where one is used
Read access The connection is read-only — the reports read your data, change nothing, and never write back to your systems.

What people usually notice first

  1. 1 The first thing almost every chain sees is that footfall falls quite differently from the way the shift rota was built.
  2. 2 The second is that one or two product groups that look strong on turnover are dragging the overall margin down, through discounting or a rise in cost of sales.
Related: CockpitSHOPS
Analitika360 client stories

Data that helps you decide

See how companies like yours put Analitika360 reports to work in Power BI.

We took the standard R-Keeper report package and they tailored it to us on top of that. It all just works.
TB
Tomas B.restaurant owner
Twenty ready-made reports — we didn't have to work out what to ask for. Our Finvalda data is finally something you can look at. Recommended.
IM
Ingrida M.accountant
What we liked was that Analitika360 already had a 20-report package for Rivilė users — we didn't have to work out our requirements from scratch. We were up and running quickly, and later they adapted several reports to the specifics of our production. It saved us both time and money.
MK
Marius K.finance director
We are a group of companies running Rivilė, and consolidated reporting was always a headache. Analitika360 started from the standard 20-report package and then fitted it to our group structure — we now see everything in one Power BI model, and it refreshes itself.
GJ
Giedrė Jankauskaitėfinancial accountant
We run six restaurants on R-Keeper and had long been looking for a way to compare results across sites. The standard 20-report package covered most of what we needed, and reports specific to our group were added later.
Andrius Š.director of a restaurant group
We came to them on a recommendation, and the ready-made 20-report standard for Finvalda users was a pleasant surprise straight away. Management now gets a clear financial picture every Monday, and I no longer spend days exporting data into Excel.
RP
Rasa Petrauskienėhead of accounting
We use Rivilė, but we never had time to build reports from scratch. The 20-report package was exactly what we needed — we had it running within a week.
VP
Vaidas P.retail chain manager
We have four cafés on R-Keeper and for a long time we ran them on gut feel. The Analitika360 reports showed us things we had simply never noticed. We now decide on the numbers rather than on guesswork.
LK
Laura Kazlauskienėfinance director of a café group

Where to start

Most people start with a ready-built report set, which connects to your accounting system within a few days, and add the industry-specific reports as a second stage. Describe your situation and we will tell you what would work best in your case.

Report examples