






“
We took the standard R-Keeper report package and they tailored it to us on top of that. It all just works.
In wholesale the money sits in two places: the warehouse and the customers. These reports show both at once — how much is tied up in stock and how much is hanging in unpaid invoices.
Wholesale margins are thin, so a couple of percentage points change the year. And the cash sits in two places at once: in the warehouse, and with customers who have not paid yet.
The ready-built Rivilė reports show both sides together. Stock turnover, slow-moving goods and overdue debt in one summary explain why a profitable company is permanently short of cash.
How many days it takes the warehouse to turn over. A rising figure means cash is sitting in stock for longer.
Which products are not moving and how much is tied up in them. Listing the supplier alongside shows whether the problem is systematic in one group.
Margin by product and group, not just turnover. Wholesale margins are thin, so a couple of percentage points change the result.
The largest customer on the longest credit terms is often the most expensive one. Margin and overdue debt together give the real picture.
Profit rather than turnover, and whether those customers actually pay. That determines whether the incentive scheme is pulling in the right direction.
Payment terms to suppliers against the credit you give customers. The difference between the two is your working-capital requirement.
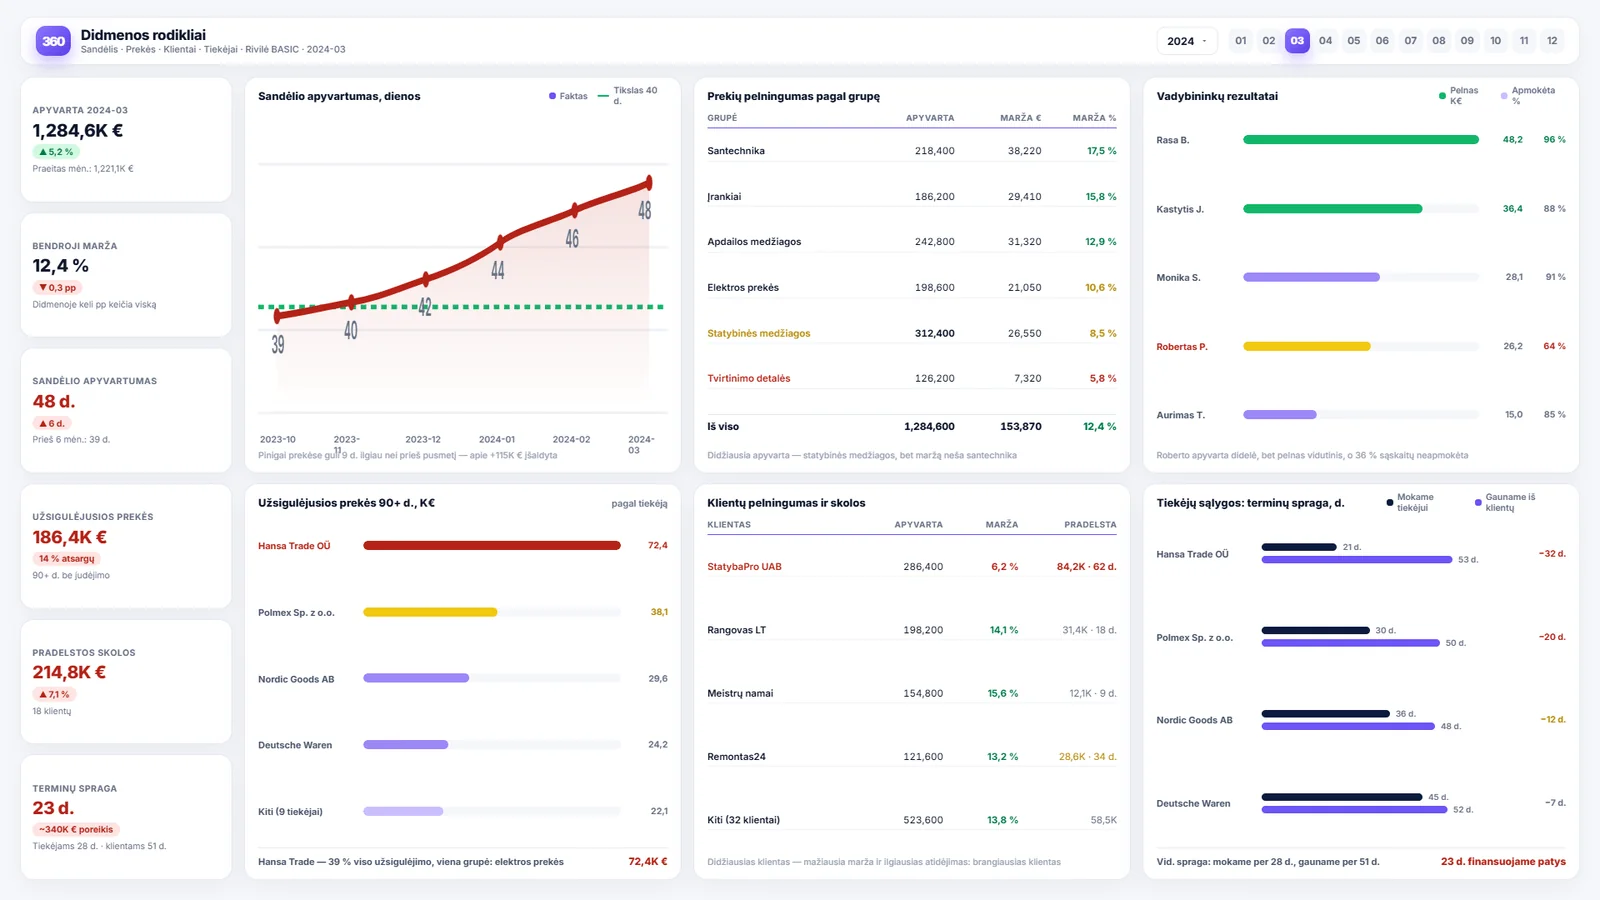
Stock turnover is shown against a target and as a trend — a rising number of days means more cash going into stock, even when turnover looks healthy.
Product profitability by group is sorted on margin, so the groups with the highest turnover and the lowest profit stand out immediately. Account manager results are shown alongside the share of invoices actually paid — turnover without payment is not yet a result.
At the bottom: slow-moving goods by supplier, customer profitability alongside overdue debt, and the gap in supplier terms. The last of these shows how many days the company is financing its own trade.
See how companies like yours put Analitika360 reports to work in Power BI.
Most people start with a ready-built report set, which connects to your accounting system within a few days, and add the industry-specific reports as a second stage. Describe your situation and we will tell you what would work best in your case.