






Solutions

Business analytics for leasing and finance companies

In leasing, profit depends not on how many new contracts you write but on the quality of the book. These reports put arrears, margin and residual value risk in one place.

Pricing and plans
Accounting vs analytics
Accounting

In leasing, portfolio growth without quality measures is half the picture. New contracts look good on day one; what they really cost becomes clear six to twelve months later, when some of them start falling behind.

ContractsPayment arrearsCost of riskResidual values = a single number?
Business analytics

Power BI analytics joins the contract system, the accounts and the credit scoring, so portfolio quality, margin after cost of risk, and residual value risk are read alongside growth.

Rivilė / FinvaldaLeasing contract system
Joined up overnight Portfolio quality read alongside growth

The figures worth watching

Portfolio size and movement

Balances by product, asset type and customer segment. Growth without quality measures alongside is only half the picture.

Arrears by ageing bucket

Up to 30, 31–60, 61–90 and over 90 days. What matters is not the amount but how contracts move between buckets month by month.

Portfolio quality

The non-performing share and which way it is heading, by segment. A rising share in one segment usually points to underwriting that was too loose six months earlier.

Contract margin

Interest income less funding costs and cost of risk. Some products stop earning anything once the cost of risk is taken off.

Residual value risk

The residual value written into contracts against what the asset is really worth. The difference lands in the result at end of term.

New business flow

By channel, salesperson and asset type — alongside how those contracts later perform. A channel that brings in plenty of business and plenty of arrears is an expensive one.
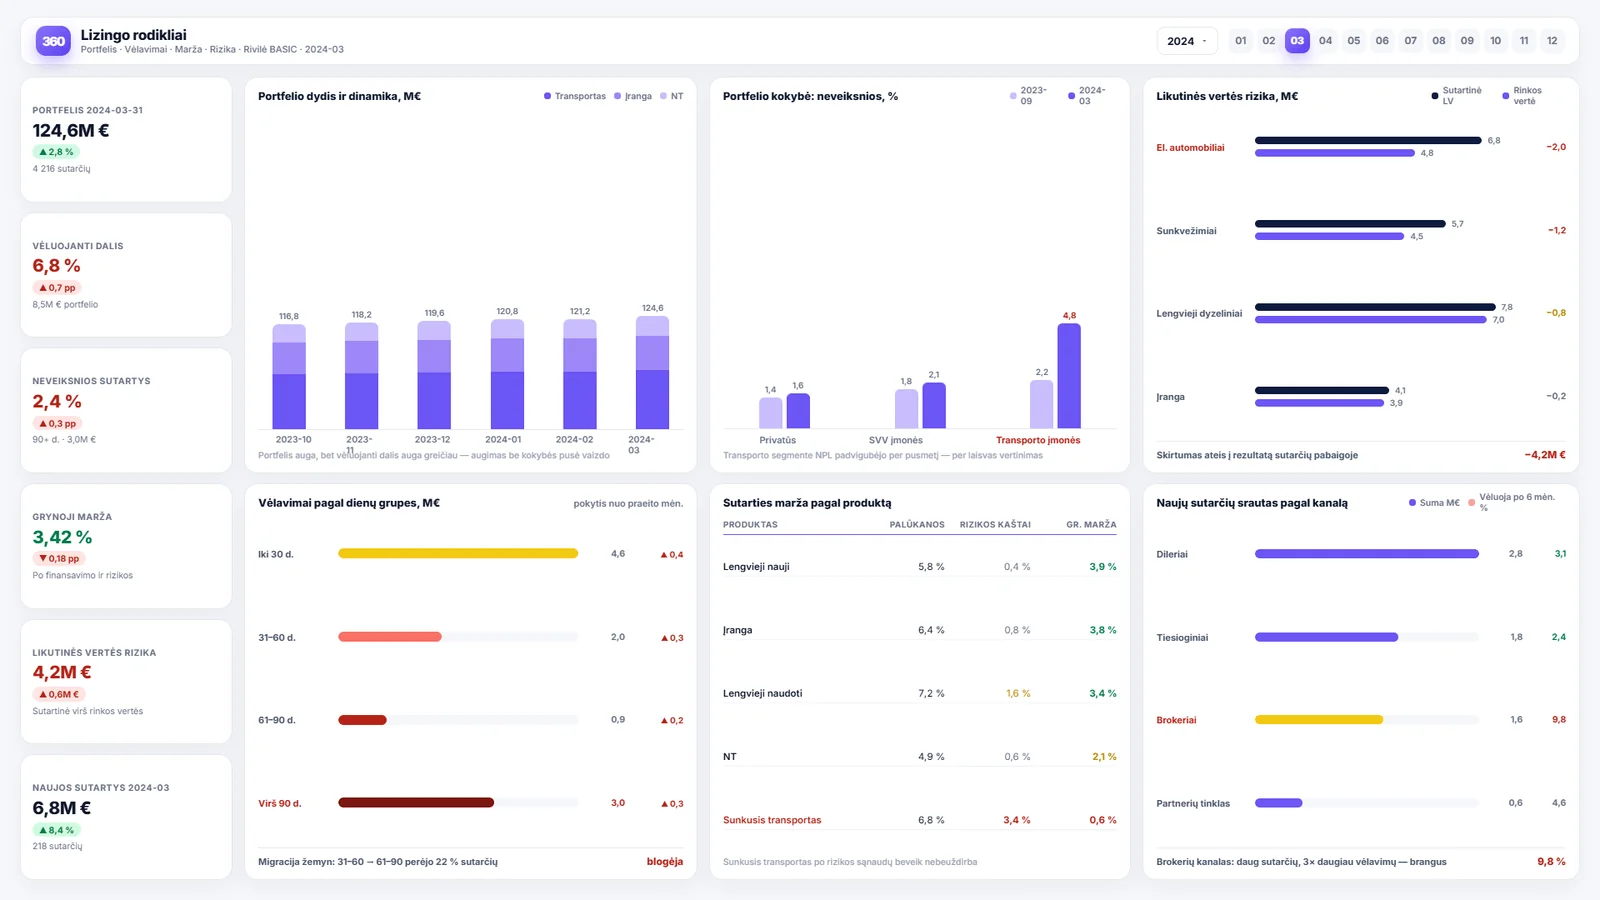
How it looks in the report

Business analytics for leasing and finance companies — Power BI ataskaitos pavyzdys
A sample report using demonstration data.
How to read the report
01

Portfolio and quality

Portfolio size is shown by asset type, with the non-performing share by segment beside it, against six months earlier. A segment where NPLs have doubled nearly always means underwriting that was too loose before.

02

Arrears migration

Arrears are given by ageing bucket with the movement since last month. What matters is not the amount but the migration: contracts travelling from 31–60 days into 61–90 show that the earlier stage of collection is not working.

03

Margin and channels

Contract margin is shown with interest and cost of risk separated — some products barely earn anything once risk is taken off. New business by channel is presented alongside how those contracts perform six months on, so an expensive channel shows up in the numbers.

Where the data comes from

  • the leasing accounting and contract system
  • the accounting system
  • credit scoring data
  • asset valuation and market price sources
Read access The connection is read-only — the reports read your data, change nothing, and never write back to your systems.

What people usually notice first

  1. 1 The usual finding is a channel or salesperson whose business looks strong on volume but produces a disproportionate share of arrears six to twelve months later. Without the two joined up, it is noticed too late.
  2. 2 The second is products whose margin after the cost of risk is close to zero, even though they look profitable in the portfolio as a whole.
Analitika360 client stories

Data that helps you decide

See how companies like yours put Analitika360 reports to work in Power BI.

We took the standard R-Keeper report package and they tailored it to us on top of that. It all just works.
TB
Tomas B.restaurant owner
Twenty ready-made reports — we didn't have to work out what to ask for. Our Finvalda data is finally something you can look at. Recommended.
IM
Ingrida M.accountant
What we liked was that Analitika360 already had a 20-report package for Rivilė users — we didn't have to work out our requirements from scratch. We were up and running quickly, and later they adapted several reports to the specifics of our production. It saved us both time and money.
MK
Marius K.finance director
We are a group of companies running Rivilė, and consolidated reporting was always a headache. Analitika360 started from the standard 20-report package and then fitted it to our group structure — we now see everything in one Power BI model, and it refreshes itself.
GJ
Giedrė Jankauskaitėfinancial accountant
We run six restaurants on R-Keeper and had long been looking for a way to compare results across sites. The standard 20-report package covered most of what we needed, and reports specific to our group were added later.
Andrius Š.director of a restaurant group
We came to them on a recommendation, and the ready-made 20-report standard for Finvalda users was a pleasant surprise straight away. Management now gets a clear financial picture every Monday, and I no longer spend days exporting data into Excel.
RP
Rasa Petrauskienėhead of accounting
We use Rivilė, but we never had time to build reports from scratch. The 20-report package was exactly what we needed — we had it running within a week.
VP
Vaidas P.retail chain manager
We have four cafés on R-Keeper and for a long time we ran them on gut feel. The Analitika360 reports showed us things we had simply never noticed. We now decide on the numbers rather than on guesswork.
LK
Laura Kazlauskienėfinance director of a café group

Where to start

Most people start with a ready-built report set, which connects to your accounting system within a few days, and add the industry-specific reports as a second stage. Describe your situation and we will tell you what would work best in your case.

Report examples