




Solutions

Business analytics for construction companies

In construction, profit is counted on the site, not in the company. These reports set each site's estimate against actual while there is still time to act — not after handover.

Pricing and plans
Accounting vs analytics
Accounting

In construction the combined result almost always lies: profitable sites cover for loss-making ones, and you only see it when each site is costed on its own. The estimate, material write-offs, subcontractor certificates and labour hours all sit in different places, so site margin is usually worked out only after handover.

The estimateMaterial write-offsSubcontractor certificatesLabour hours by site = a single number?
Business analytics

Power BI analytics joins the accounts to the estimating system and the time records. The drift from the estimate becomes visible while the work is still running — while there is still time to renegotiate, change supplier or stop.

Rivilė / FinvaldaEstimating system
Joined up overnight Site margin while the work is still running

The figures worth watching

Profitability by site

Every site treated as a business of its own: revenue, materials, labour, subcontractors, margin. Without that, a construction firm sees only the combined result, in which the profitable sites cover for the loss-making ones.

Estimate against actual

The single most important figure in the industry. A variance caught mid-build can still be managed; one caught at handover is already a loss.

Material costs by site

Where more material was used than planned, and whether that is systematic at one site or with one crew.

Subcontractor costs

Subcontracting as a share of site cost, and how it moves. This is often exactly where the planned margin disappears.

Cash flow by stage

In construction the money goes out before it comes in. A stage schedule with payment dates shows when the gap will open.

Receivables by client

Retentions and late payment are normal in construction. How much money is tied up, and for how long, is visible per client.
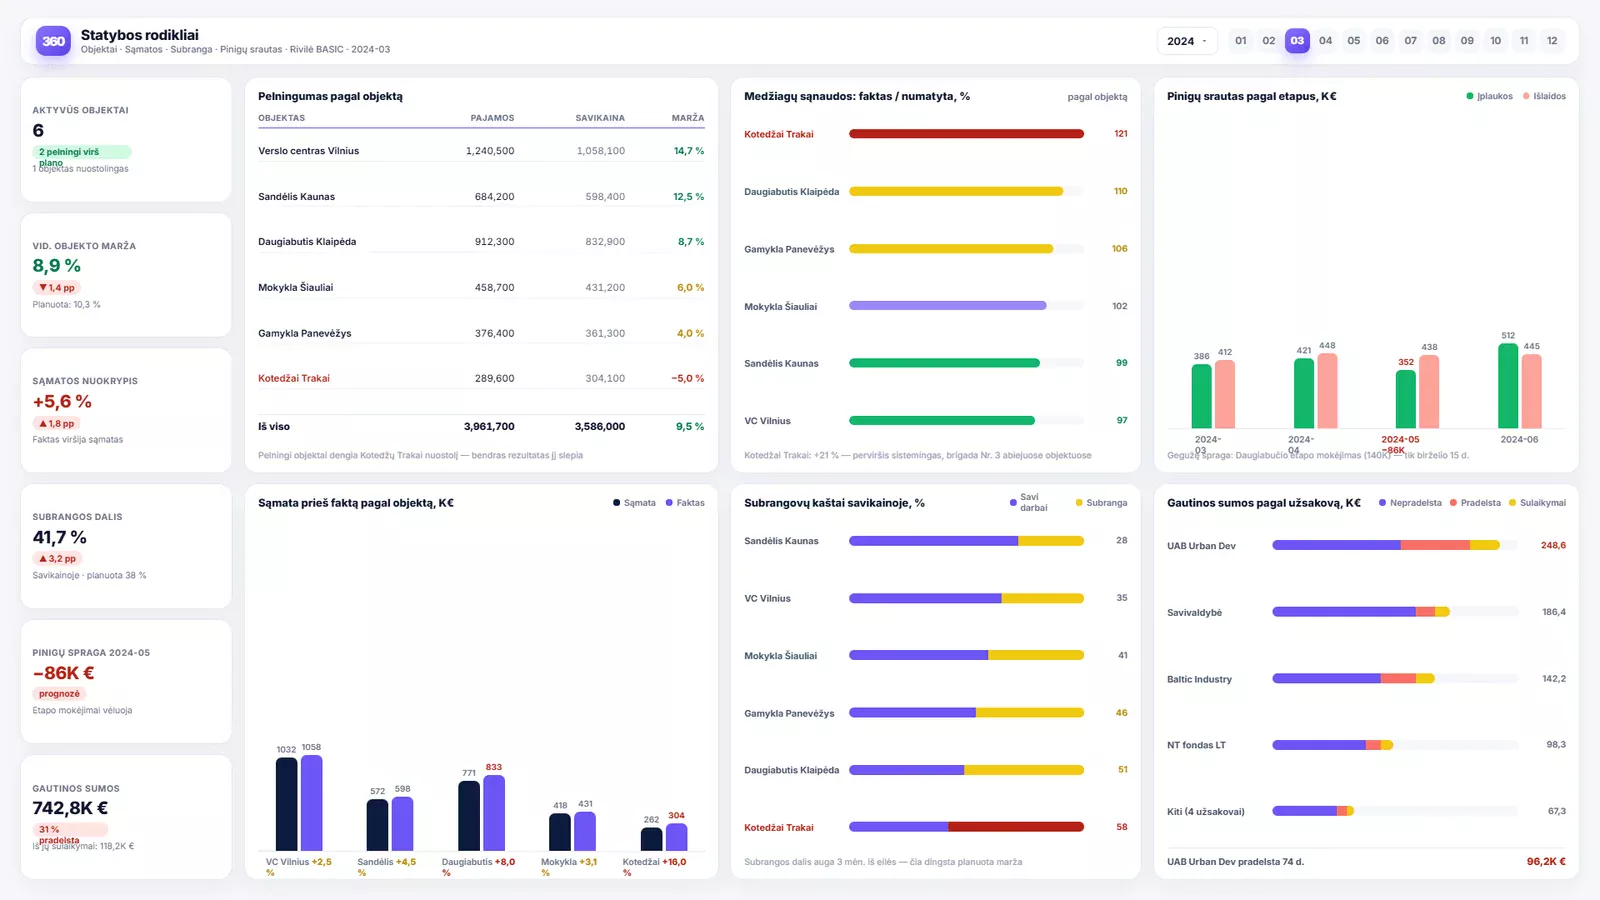
How it looks in the report

Business analytics for construction companies — Power BI ataskaitos pavyzdys
A sample report using demonstration data.
How to read the report
01

The sites row

The top row answers how the sites are doing: profitability by site with the margin on each, materials used against materials planned, and cash flow by stage. A loss-making site stands out at once, even while the combined result stays positive.

02

The causes row

The bottom row shows the causes. Estimate against actual gives the size of the variance as a percentage; the subcontractor share of site cost shows where the planned margin goes; and receivables by client separate retentions from ordinary late payment.

03

Cash flow

The cash flow chart with stage payments is often the most valuable of all: it names the month in which the gap will open, several weeks before it does.

Where the data comes from

  • the accounting system
  • the estimating system (planned quantities and prices)
  • time recording by site
  • subcontracts and completion certificates
Read access The connection is read-only — the reports read your data, change nothing, and never write back to your systems.

What people usually notice first

  1. 1 What emerges first, almost every time, is that profitability varies between sites far more than anyone expected — not by 2 or 3 points but by 15 to 20.
  2. 2 The second is that the drift from the estimate starts early, usually within the first third of the work, and only widens from there. Caught in time, some of it can still be recovered by renegotiating or changing supplier.
Analitika360 client stories

Data that helps you decide

See how companies like yours put Analitika360 reports to work in Power BI.

We took the standard R-Keeper report package and they tailored it to us on top of that. It all just works.
TB
Tomas B.restaurant owner
Twenty ready-made reports — we didn't have to work out what to ask for. Our Finvalda data is finally something you can look at. Recommended.
IM
Ingrida M.accountant
What we liked was that Analitika360 already had a 20-report package for Rivilė users — we didn't have to work out our requirements from scratch. We were up and running quickly, and later they adapted several reports to the specifics of our production. It saved us both time and money.
MK
Marius K.finance director
We are a group of companies running Rivilė, and consolidated reporting was always a headache. Analitika360 started from the standard 20-report package and then fitted it to our group structure — we now see everything in one Power BI model, and it refreshes itself.
GJ
Giedrė Jankauskaitėfinancial accountant
We run six restaurants on R-Keeper and had long been looking for a way to compare results across sites. The standard 20-report package covered most of what we needed, and reports specific to our group were added later.
Andrius Š.director of a restaurant group
We came to them on a recommendation, and the ready-made 20-report standard for Finvalda users was a pleasant surprise straight away. Management now gets a clear financial picture every Monday, and I no longer spend days exporting data into Excel.
RP
Rasa Petrauskienėhead of accounting
We use Rivilė, but we never had time to build reports from scratch. The 20-report package was exactly what we needed — we had it running within a week.
VP
Vaidas P.retail chain manager
We have four cafés on R-Keeper and for a long time we ran them on gut feel. The Analitika360 reports showed us things we had simply never noticed. We now decide on the numbers rather than on guesswork.
LK
Laura Kazlauskienėfinance director of a café group

Where to start

Most people start with a ready-built report set, which connects to your accounting system within a few days, and add the industry-specific reports as a second stage. Describe your situation and we will tell you what would work best in your case.

Report examples