Power BI ataskaitos · Finvalda

Finvalda Basic is a set of 8 Power BI reports for users of Finvalda

Basic 8-report set — €59/month
Compare plans and pricing
Finvalda
Finvalda Basic ataskaitos

The Finvalda Basic set contains these reports:

01

Summary

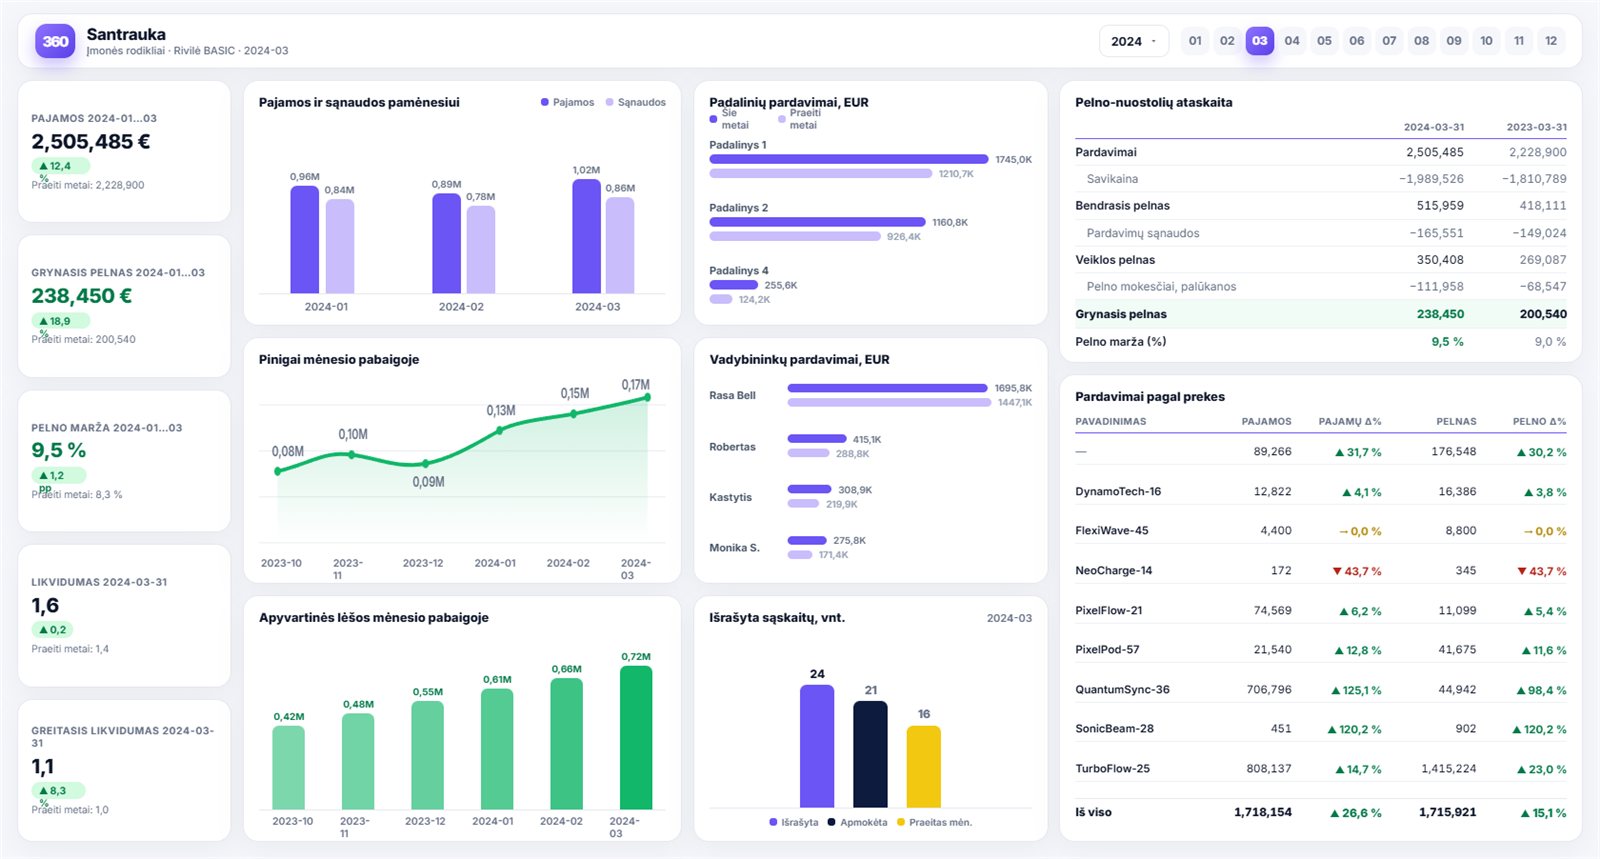
An overview of the company's main financial and operational figures for the period you choose. The cards on the left carry the headline numbers:

The bar charts show revenue and costs month by month, and can be rolled up to quarters or years, alongside cash held at the bank. The chart at the bottom shows the working-capital balance over the last 6 months.

The charts in the middle break sales down by business unit and account manager, and show how many invoices were issued in the period against last month and last year. The tables on the right summarise the profit and loss and the sales for the period, next to the same period a year earlier.

This page is for:
Summary - Power BI ataskaita
  • Revenue
  • Net profit (amount and %)
  • Liquidity ratios
  • Management and financial analysts
  • Reading the company's financial position at a glance
  • Following trends and comparing against earlier periods
02

Revenue and costs

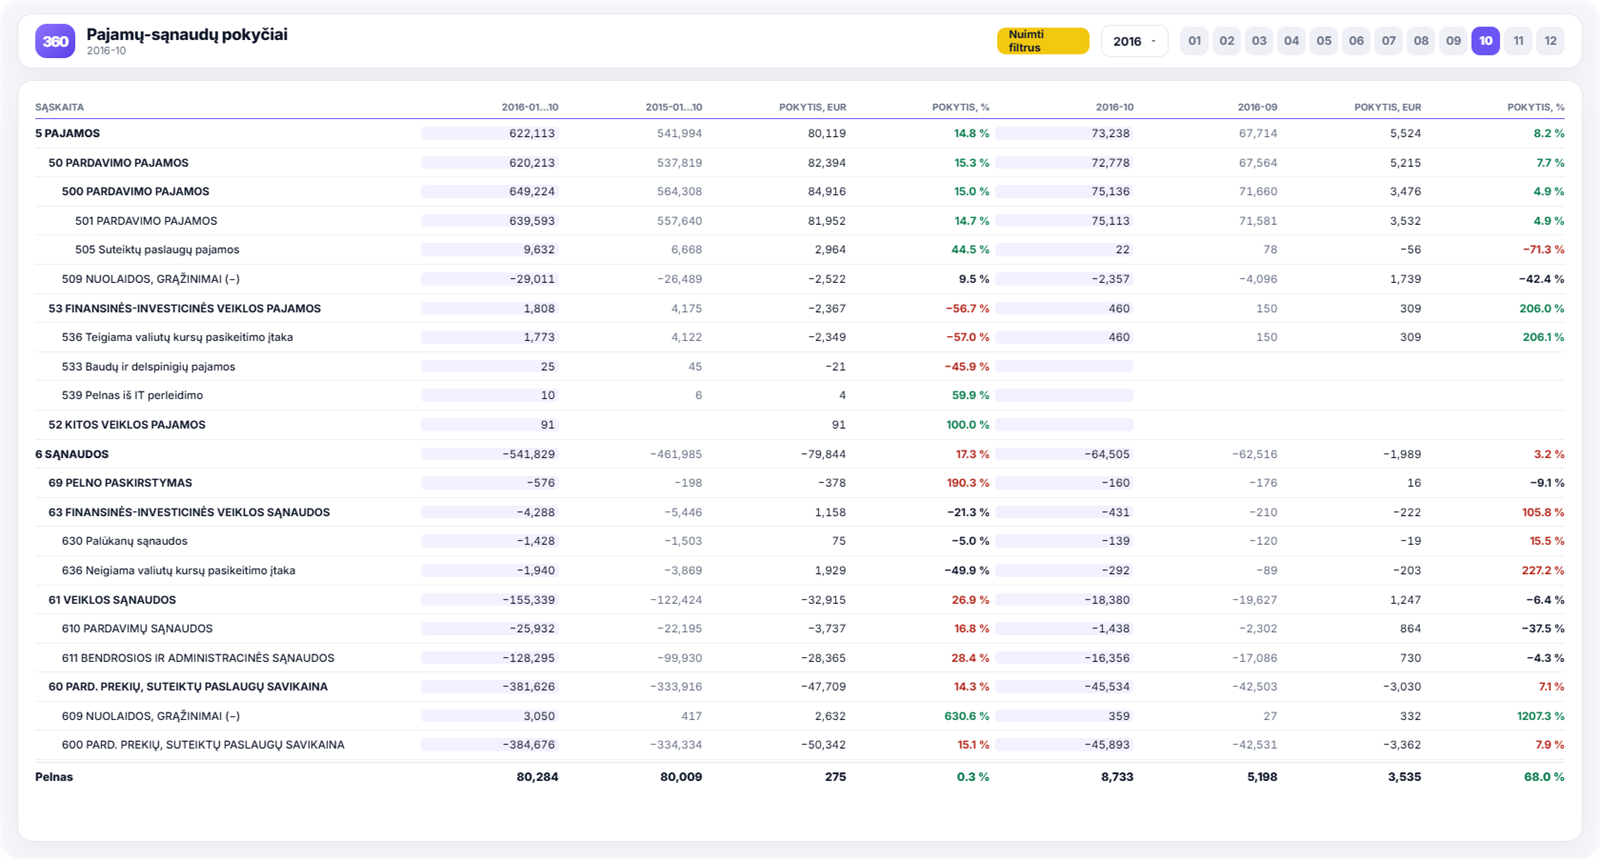
Detailed financial analysis by general-ledger account. The cards on the left show revenue and costs against the previous period, along with the make-up of the ledger group you have selected. The report can be filtered by business unit. The bar chart shows the month-by-month movement of the figure you pick — revenue or costs — against the same period a year earlier.

Below it, the main table lists the values of the relevant ledger accounts and expands from summary accounts down to individual entries.

This page is for financial analysts, managers and accountants. It lets you:

Revenue and costs - Power BI ataskaita
  • Track financial results month by month
  • Examine movements by chart of accounts
  • Spot the largest variances and trends quickly
03

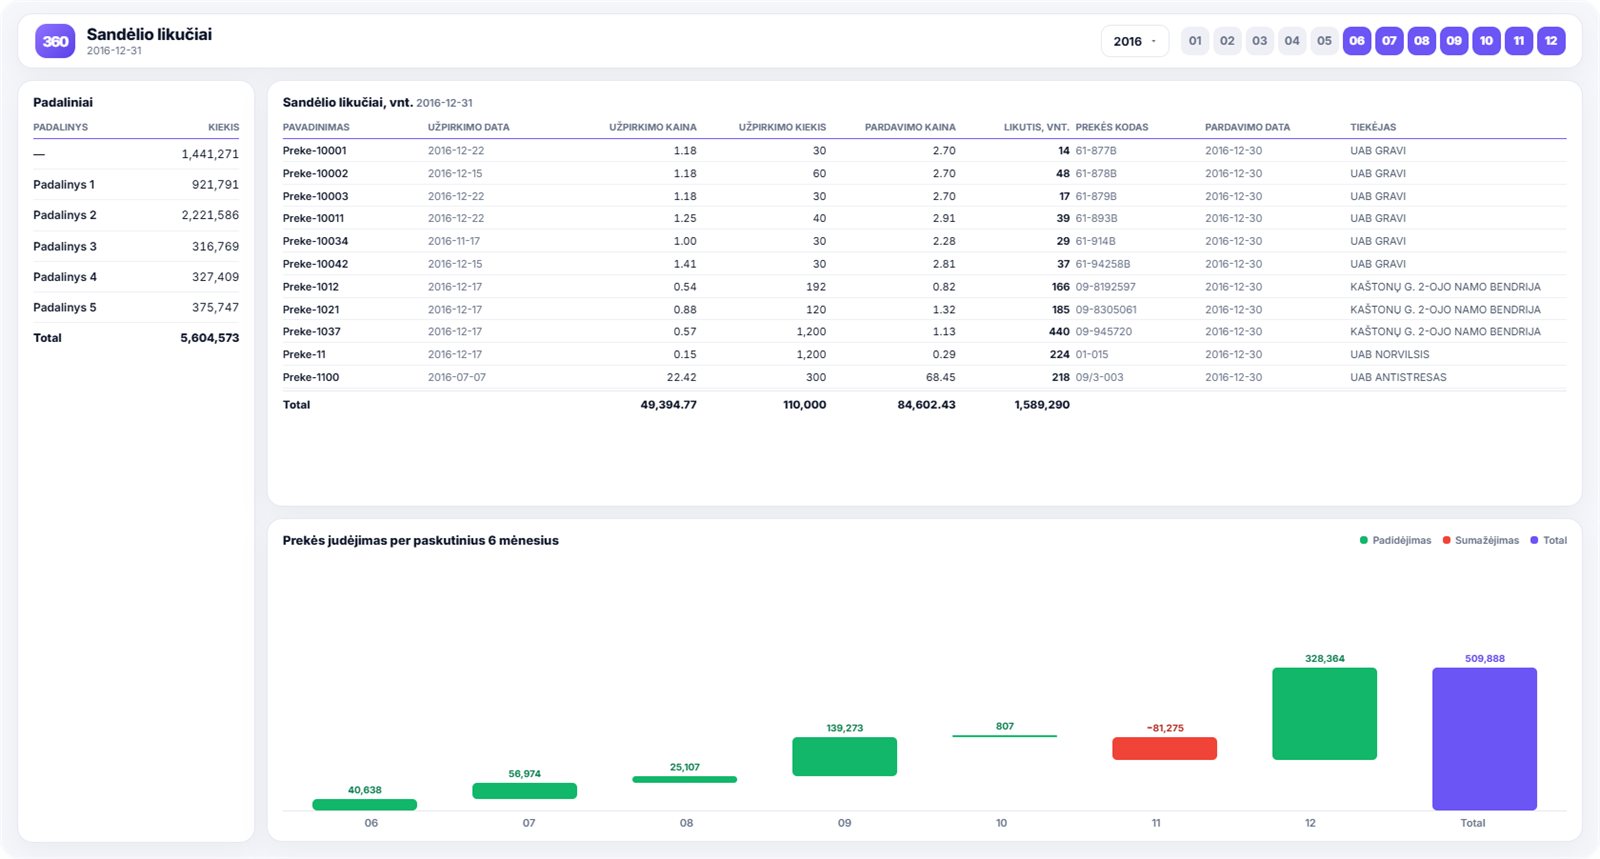
Stock on hand

this page covers stock levels, stock movement and supply. The cards on the left carry the key warehouse-efficiency figures:

The main table gives stock on hand in units and euros, with the quantity and date of the last purchase and the supplier's name.

This page is for logistics, purchasing, warehouse and finance staff. It helps you:

Stock on hand - Power BI ataskaita
  • Stock held in each warehouse
  • Stock turnover, delivery frequency, and stock levels against sales
  • Stock levels against outstanding purchase orders
  • Monitor warehouse efficiency
  • Plan stock around supply and sales patterns
  • Identify products that sit unsold or run out regularly
  • Assess supplier activity and the most recent order
04

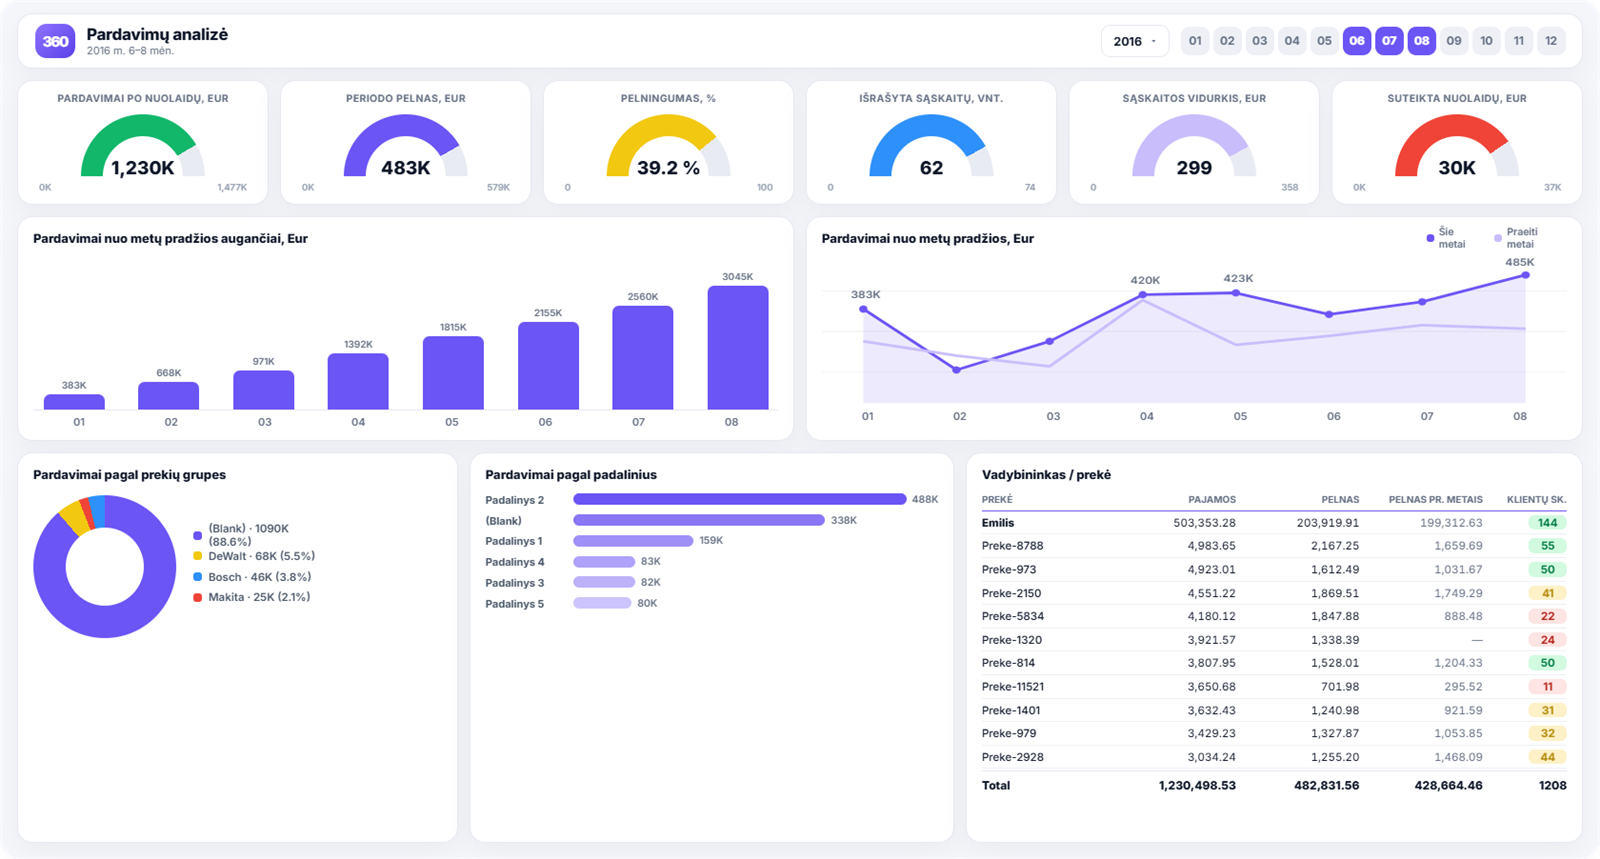
Sales analysis

For tracking and assessing commercial performance. The cards along the top summarise the selected period against the same period a year earlier:

The line and bar charts in the middle show revenue cumulatively and month by month, always against the same period a year earlier. The charts and table at the bottom break sales down by product group and business unit, and show how each account manager is performing.

A high-level sales overview that lets managers and decision-makers see quickly:

Sales analysis - Power BI ataskaita
  • Sales after discounts, EUR
  • Profit for the period, EUR
  • Profitability, %
  • Invoices issued, count
  • Average invoice, EUR
  • Stock turnover, days
  • whether the sales plan is on track
  • where profitability or efficiency is slipping
  • which people or units stand out
05

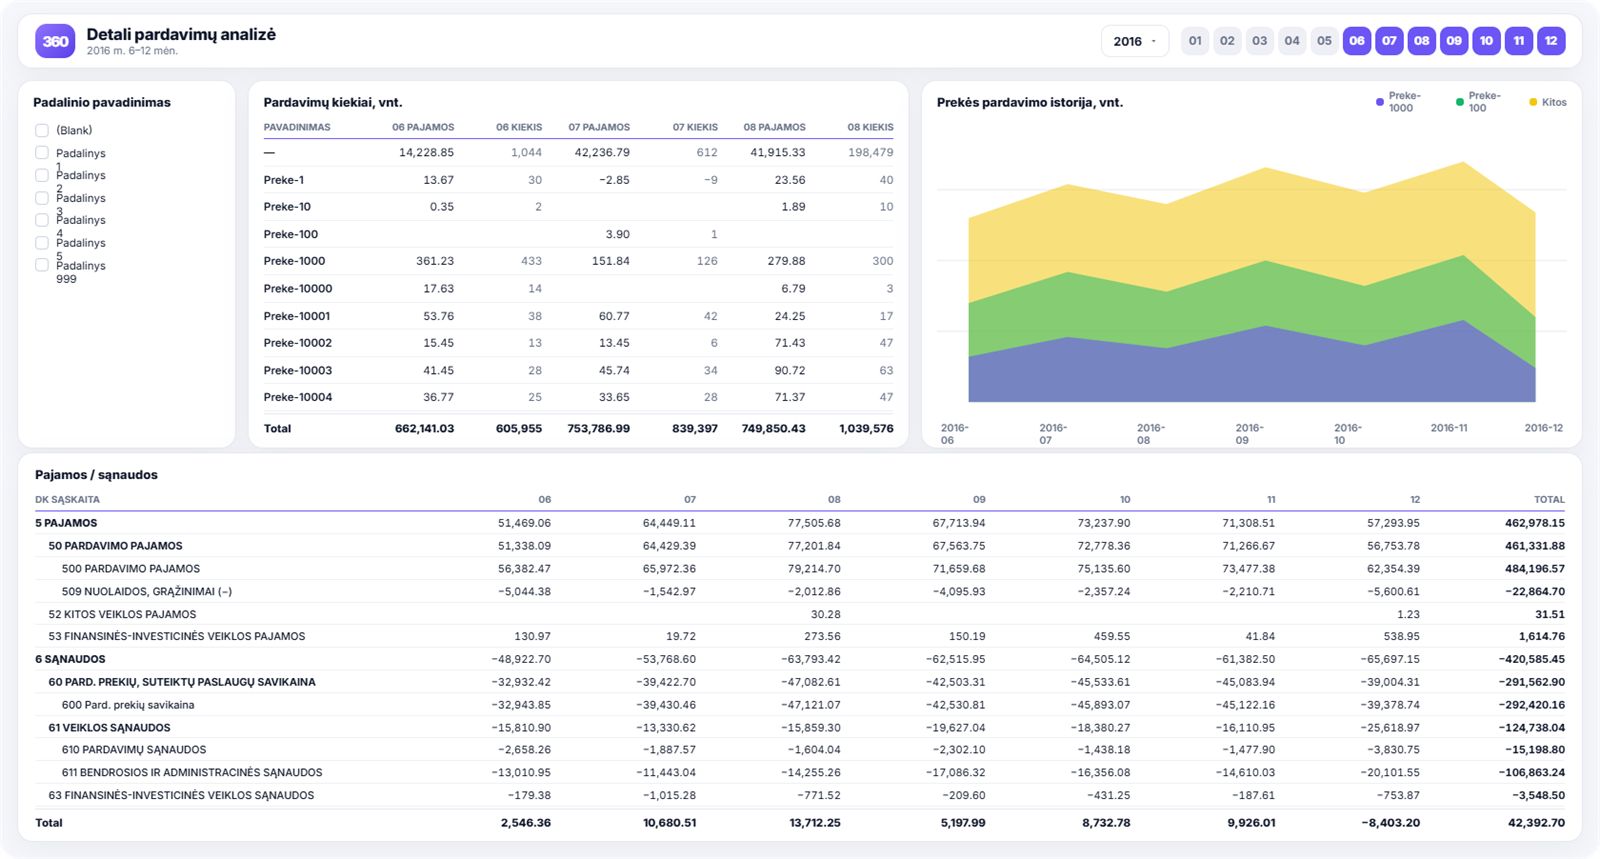
Sales in detail

This Power BI report analyses sales in detail by customer, supplier, product and period. On the left are summary tables of sales by customer and of sales of each supplier's products.

You build the main table yourself, choosing which measures to show from the controls at the top. You can also pick the business unit and the two periods you want to compare.

The bar chart at the bottom shows sales and profit month by month, from the earliest day of the first period to the latest day of the second.

This page is for detailed sales analysis. It lays the data out so you can dig into sales by:

Sales in detail - Power BI ataskaita
  • customer
  • supplier
  • product
  • period
06

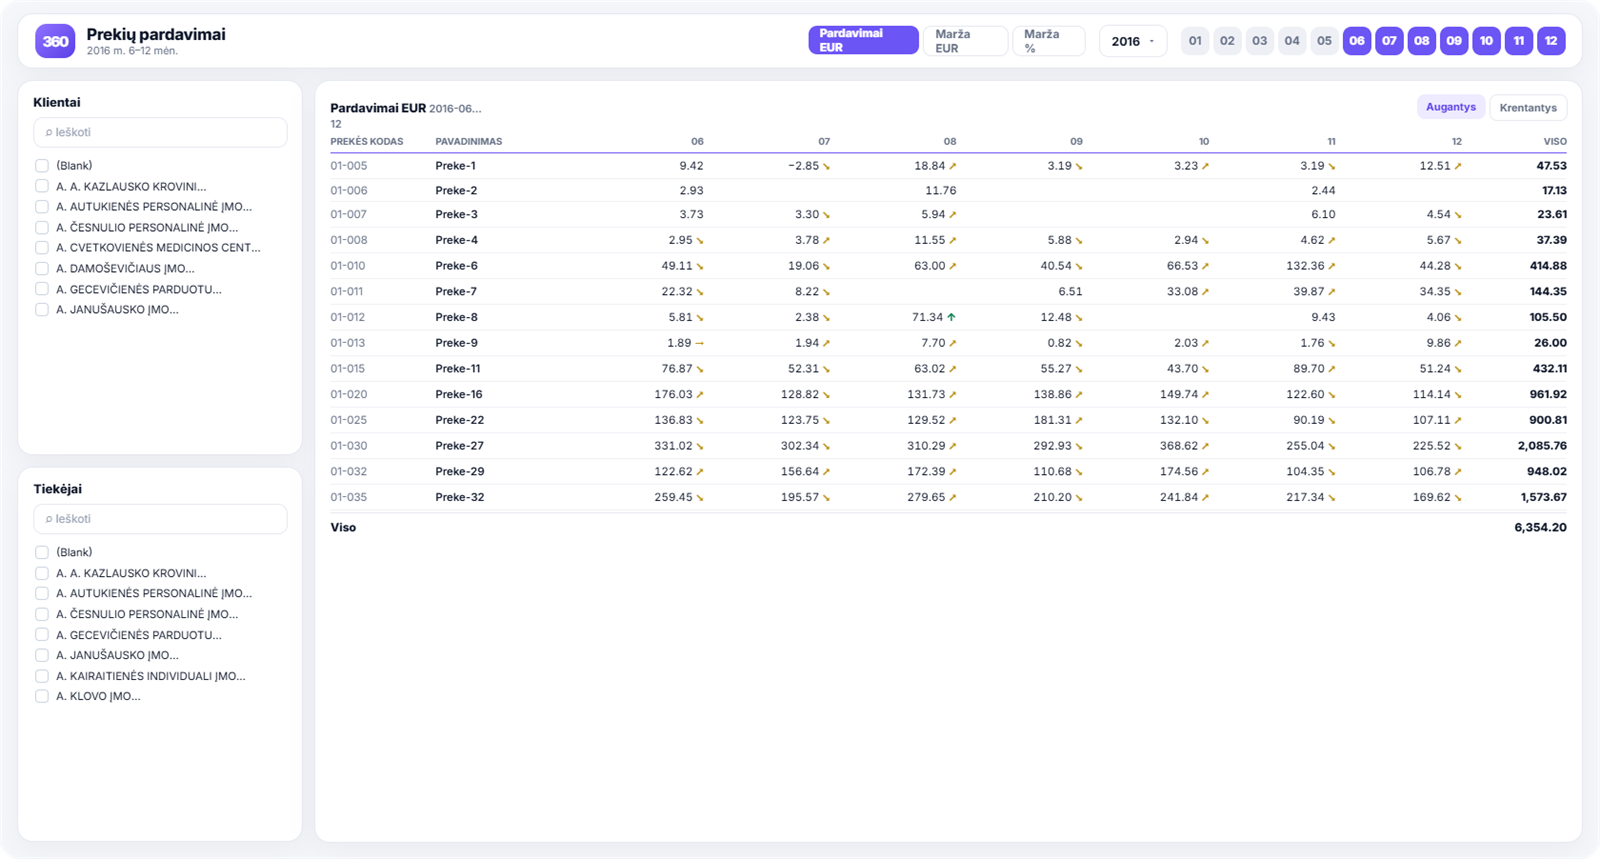
Product trends

This report looks closely at how individual products are selling. On the left is a list of the products whose sales rose or fell over the period, together with a short AI-generated summary of everything on the page.

The table at the top centre gives total product sales in euros, with a sparkline against each product showing how it sold over the period.

The table at the top right shows sales of the selected products by day of the week. Use the search box at the top of the page to find a particular product. The bar chart at the bottom shows product sales month by month.

Product trends - Power BI ataskaita
  • How product sales move over time
  • Rising and falling trends
  • Filters by product and product group
07

Price, volume and mix variance analysis

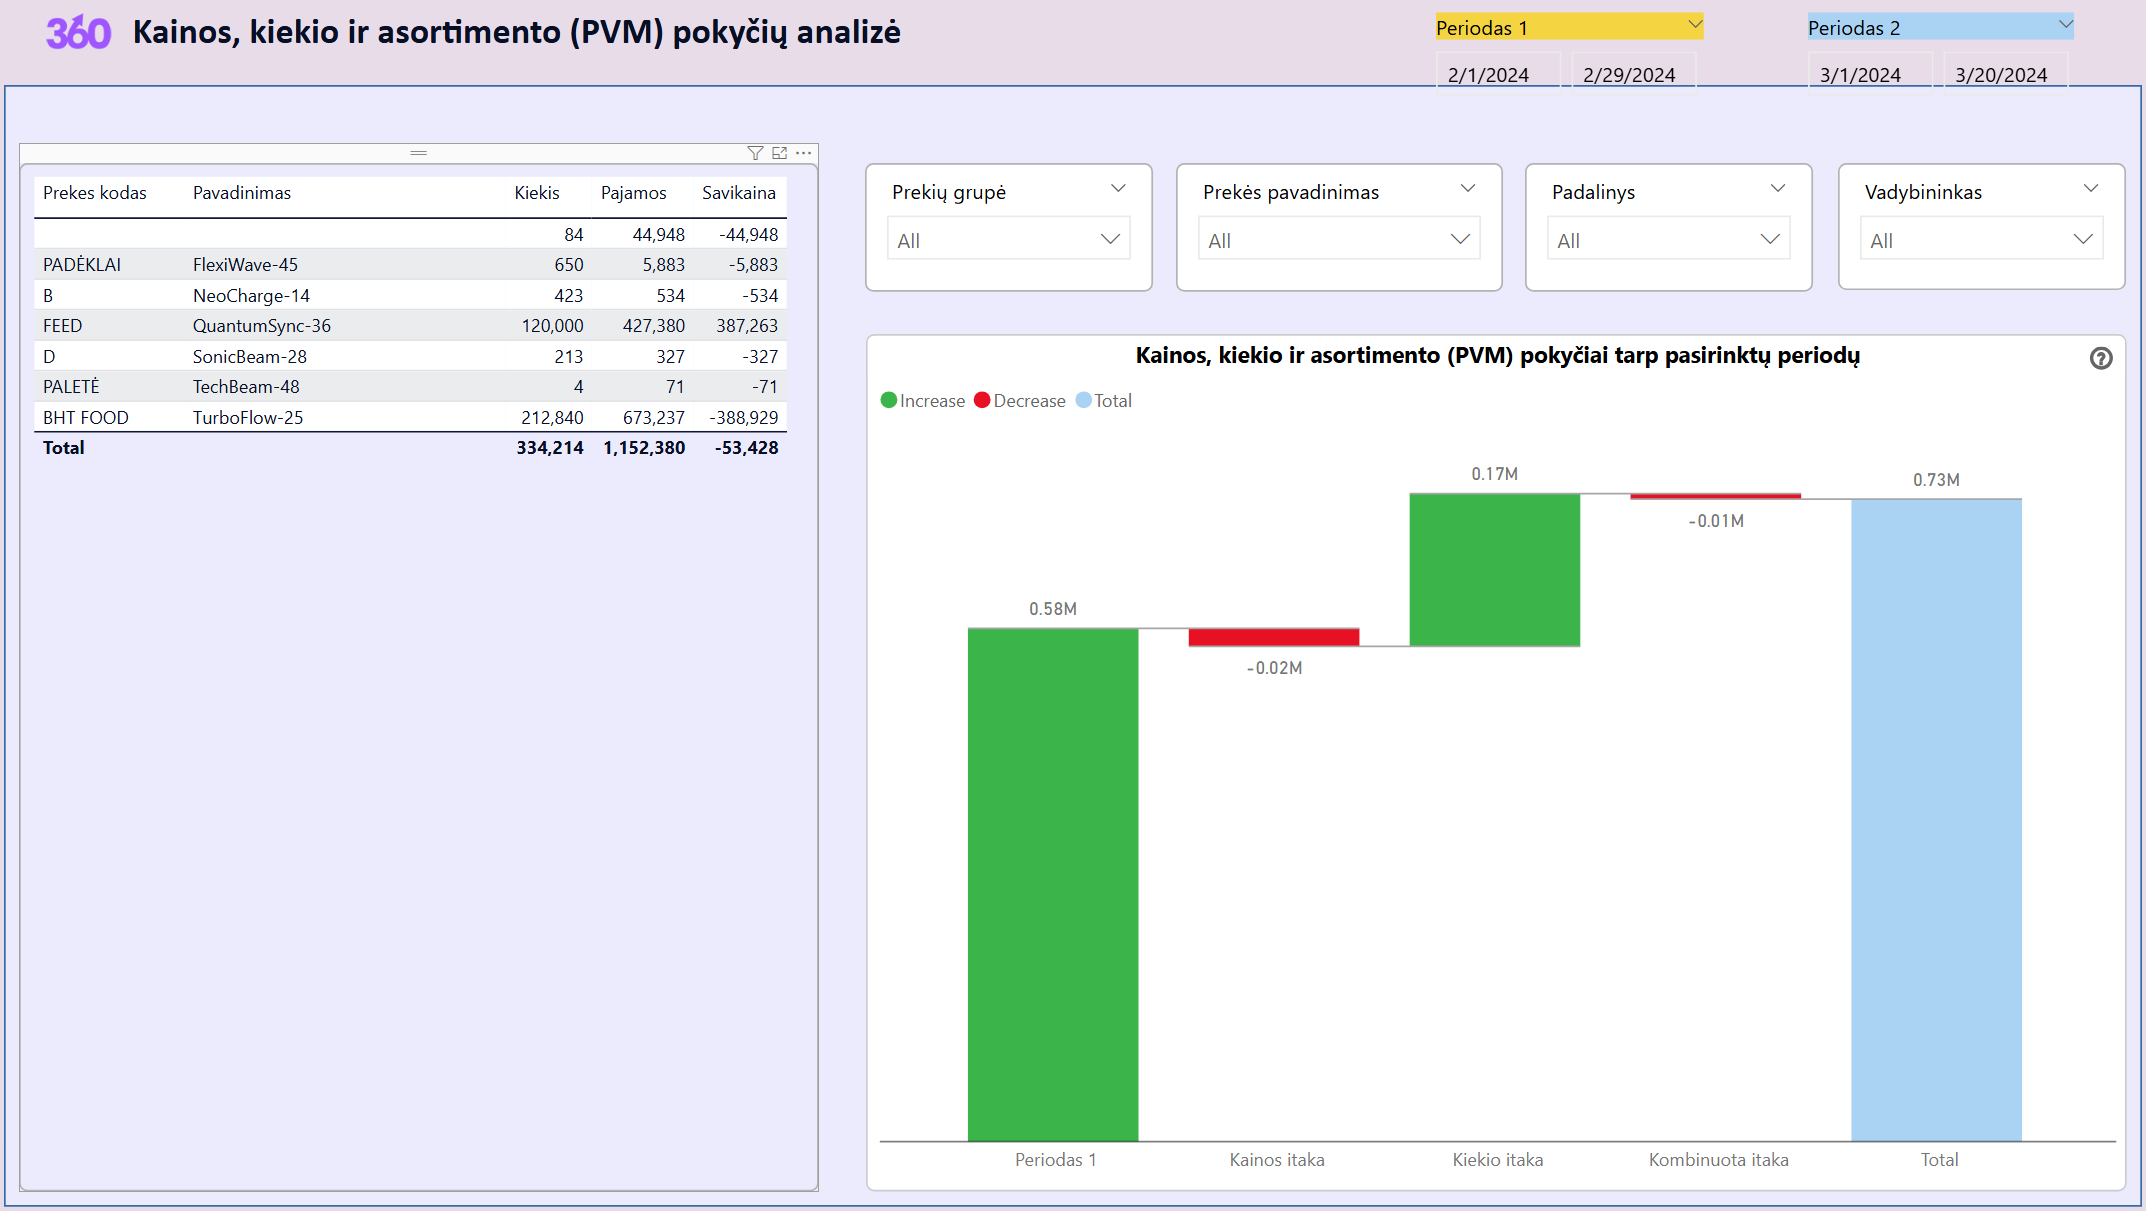
A revenue-bridge model that explains what drove the difference in revenue between two periods — price, volume or product mix.

The filter bar at the top lets you choose product groups, business units and account managers.

A waterfall chart shows how the difference between the periods was made up:

A classic revenue-variance page: it separates the change in sales into clear, individual causes. Useful to commercial directors and financial analysts alike when judging how the business is moving.

A classic revenue-variance analysis: it separates the change in sales into clear, individual causes. Useful to commercial directors and financial analysts alike when judging how the business is moving.

Price, volume and mix variance analysis - Power BI ataskaita
  • Revenue in the first period (the baseline)
  • Price effect (how much of the change came from unit prices)
  • Volume effect (the change from the number of units sold)
  • Combined effect (where price and volume moved together)
  • Revenue in the second period (the closing figure)
08

Balance sheet analysis

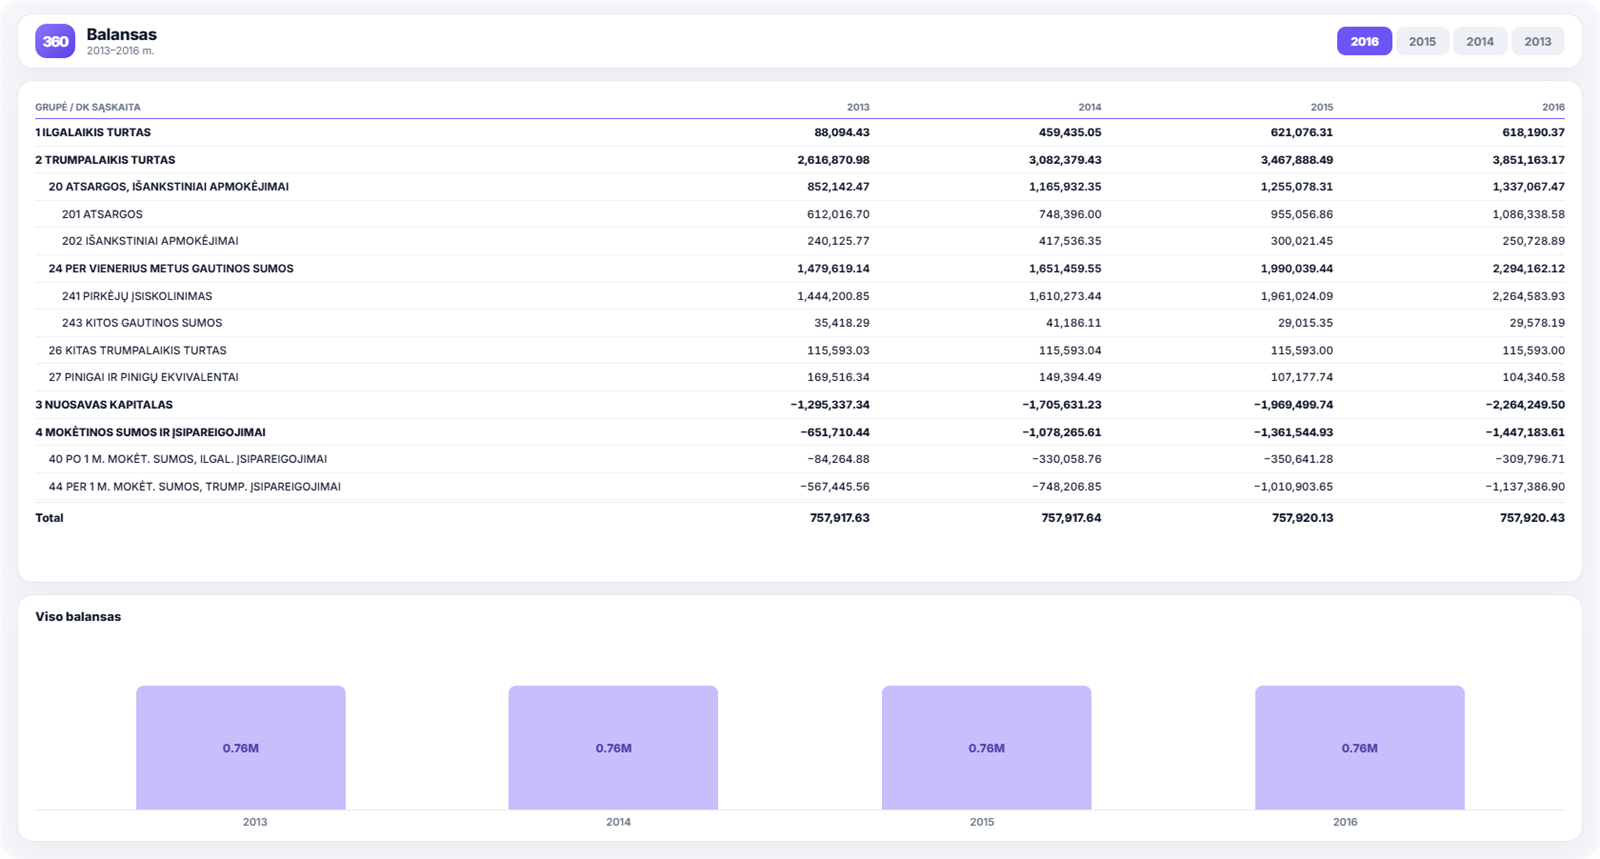
A structured view of the financial data showing how the organisation's assets are made up across periods. The report can compare several years at once. Balance-sheet lines expand down to individual general-ledger accounts, and from there you can drill through to a detail page listing every ledger entry that makes up the figure.

The bar chart at the bottom shows how the row selected in the table above moved across the years you chose.

Balance sheet analysis - Power BI ataskaita
  • The company's balance sheet in one place
  • Several years compared
  • Summary accounts broken down
FAQ

Frequently asked questions

What is Power BI?

Power BI is a modern data analytics platform for presenting data quickly and clearly, filtering and sorting it, and comparing it against other periods. It also has AI features that can draw conclusions from large bodies of data with no obvious direct connection between them.

Which data sources can Power BI import from?

Power BI can import from practically every common database (SQL, DB2, Oracle, Informix, Netezza, Essbase, Impala and others), from accounting and ERP systems (Rivilė, Navision, Axapta, Salesforce, Dynamics 365), from online services (Azure DevOps, Google Analytics, Adobe Analytics, Facebook, web pages and more), and from Excel, PDF, XML and JSON files.

Why use Power BI if I can build the reports in Excel?

Building the same reports in Excel is considerably harder. To stop having to fix them every time the volume of data changes, you end up writing Visual Basic macros. Excel has no drill-through when you need to go deeper into the data, and it does not cope with large volumes. In Power BI the only limit on how much data you process at once is your server's memory.

Is my data safe in Analitika360 reports?

All data stored in Power BI is encrypted by default using Microsoft-managed keys. Customer data held in Azure SQL databases is fully encrypted with Azure SQL Transparent Data Encryption (TDE). Customer data in Azure Blob storage is encrypted with Azure Storage Encryption.

Is the connection between Analitika360 reports and the Rivilė database secure?

Yes. Analitika360 requires all inbound HTTP traffic to be encrypted with TLS 1.2 or later. Any request that tries to use TLS 1.1 or older is rejected.

Can Analitika360 reports be connected over a VPN?

Yes.

Is signing in to Analitika360 reports secure?

Yes — every user must use multi-factor authentication. An Analitika360 user signs in with a username, a password and a code sent to their phone.

Start reading your business data in real time and decide while it still counts — write to us and we will show you how the Finvalda Basic reports would work with your own data.

Analitika360 client stories

Data that helps you decide

See how companies like yours put Analitika360 reports to work in Power BI.

We took the standard R-Keeper report package and they tailored it to us on top of that. It all just works.
TB
Tomas B.restaurant owner
Twenty ready-made reports — we didn't have to work out what to ask for. Our Finvalda data is finally something you can look at. Recommended.
IM
Ingrida M.accountant
What we liked was that Analitika360 already had a 20-report package for Rivilė users — we didn't have to work out our requirements from scratch. We were up and running quickly, and later they adapted several reports to the specifics of our production. It saved us both time and money.
MK
Marius K.finance director
We are a group of companies running Rivilė, and consolidated reporting was always a headache. Analitika360 started from the standard 20-report package and then fitted it to our group structure — we now see everything in one Power BI model, and it refreshes itself.
GJ
Giedrė Jankauskaitėfinancial accountant
We run six restaurants on R-Keeper and had long been looking for a way to compare results across sites. The standard 20-report package covered most of what we needed, and reports specific to our group were added later.
Andrius Š.director of a restaurant group
We came to them on a recommendation, and the ready-made 20-report standard for Finvalda users was a pleasant surprise straight away. Management now gets a clear financial picture every Monday, and I no longer spend days exporting data into Excel.
RP
Rasa Petrauskienėhead of accounting
We use Rivilė, but we never had time to build reports from scratch. The 20-report package was exactly what we needed — we had it running within a week.
VP
Vaidas P.retail chain manager
We have four cafés on R-Keeper and for a long time we ran them on gut feel. The Analitika360 reports showed us things we had simply never noticed. We now decide on the numbers rather than on guesswork.
LK
Laura Kazlauskienėfinance director of a café group