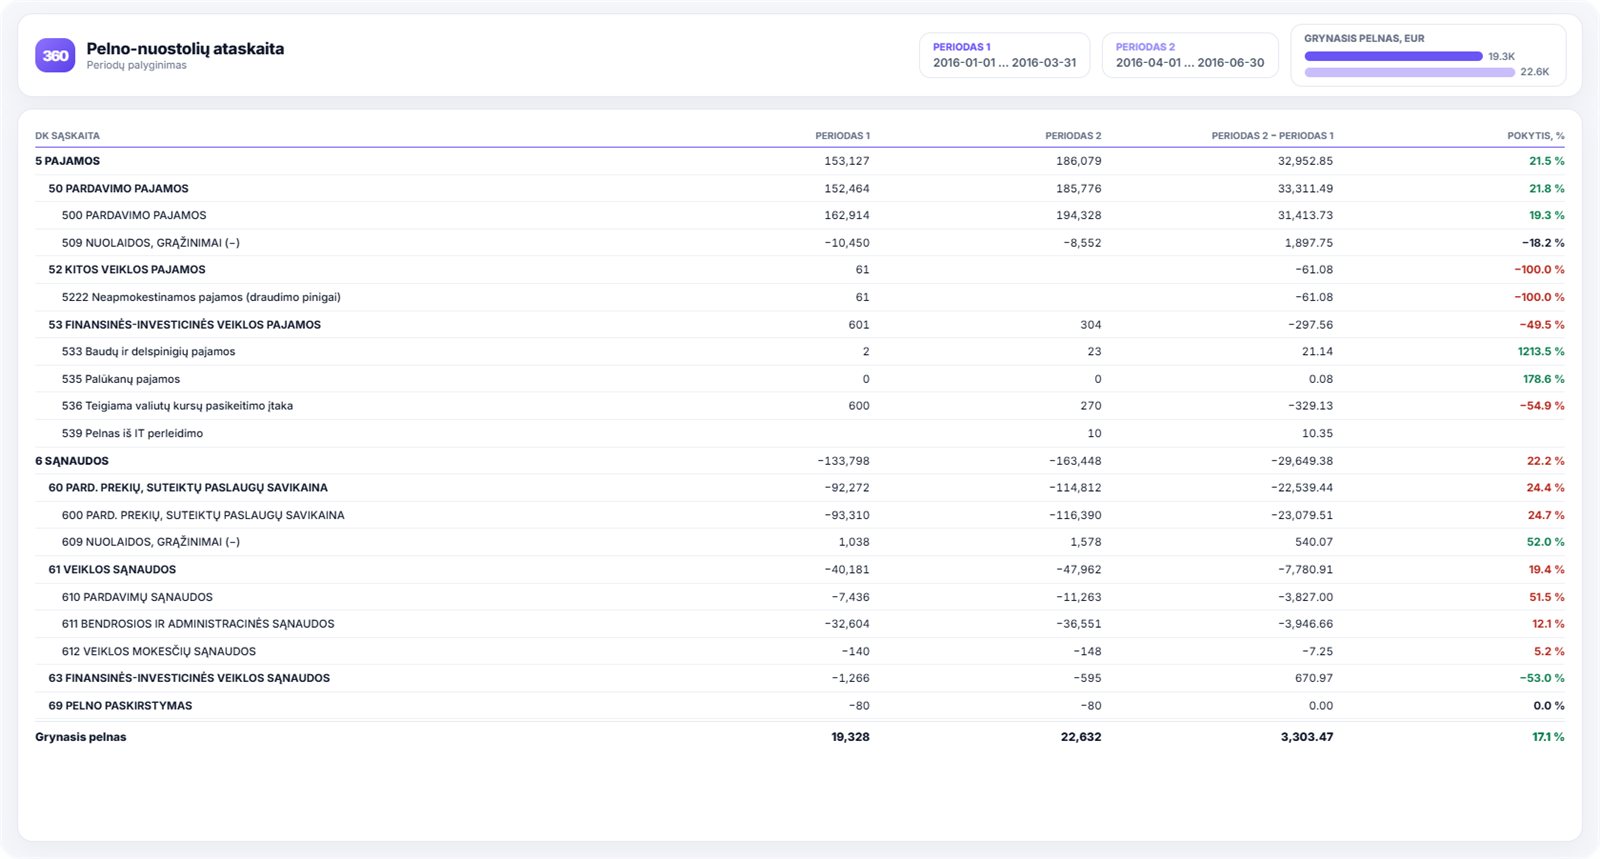
01
Power BI business analytics for executives
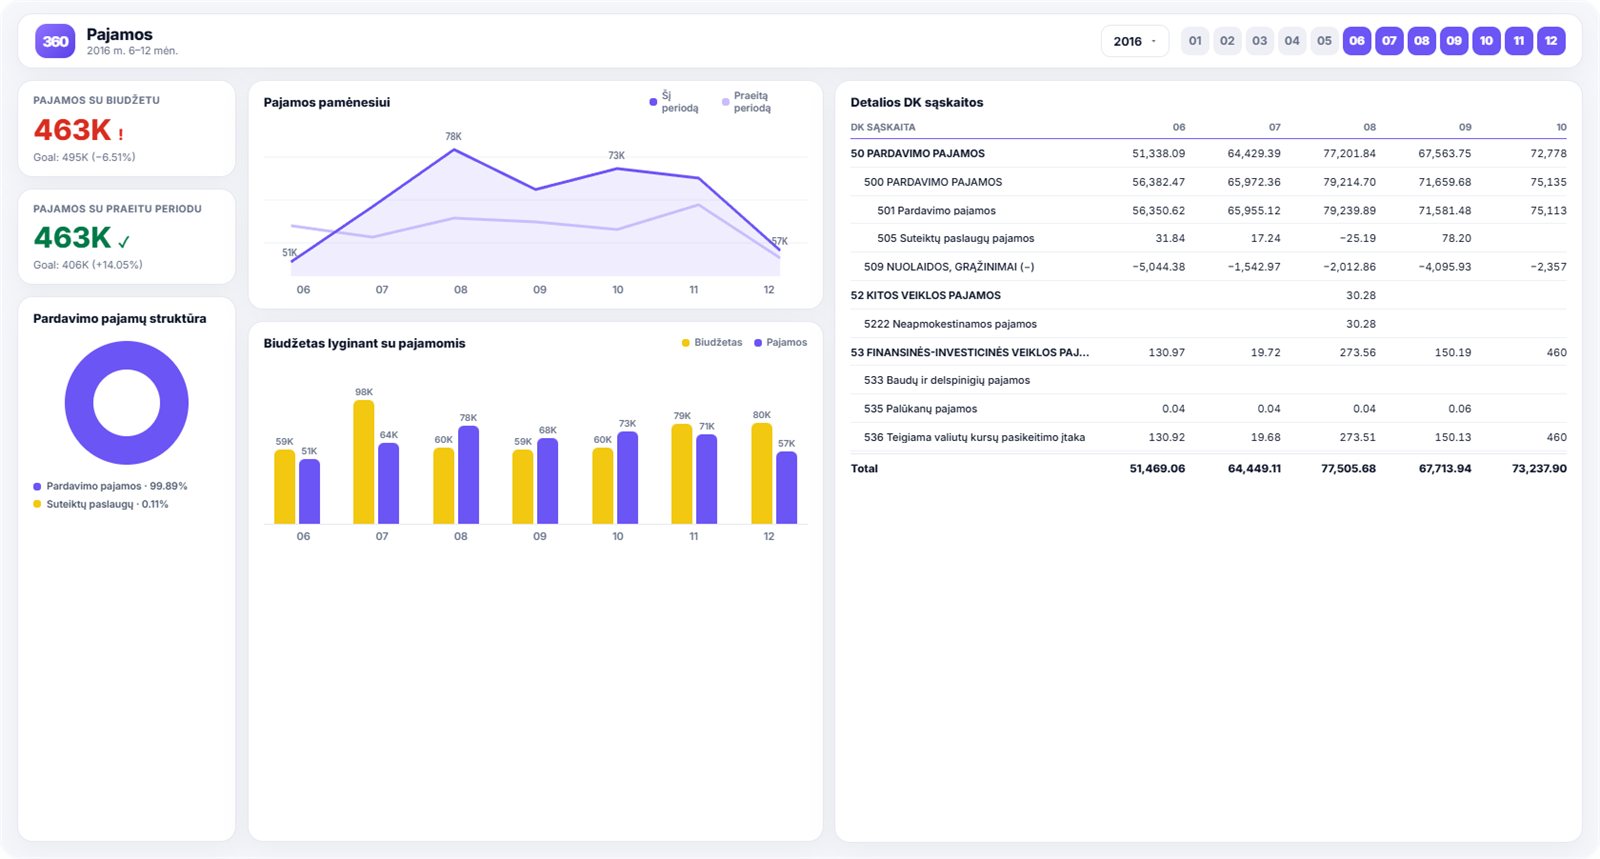
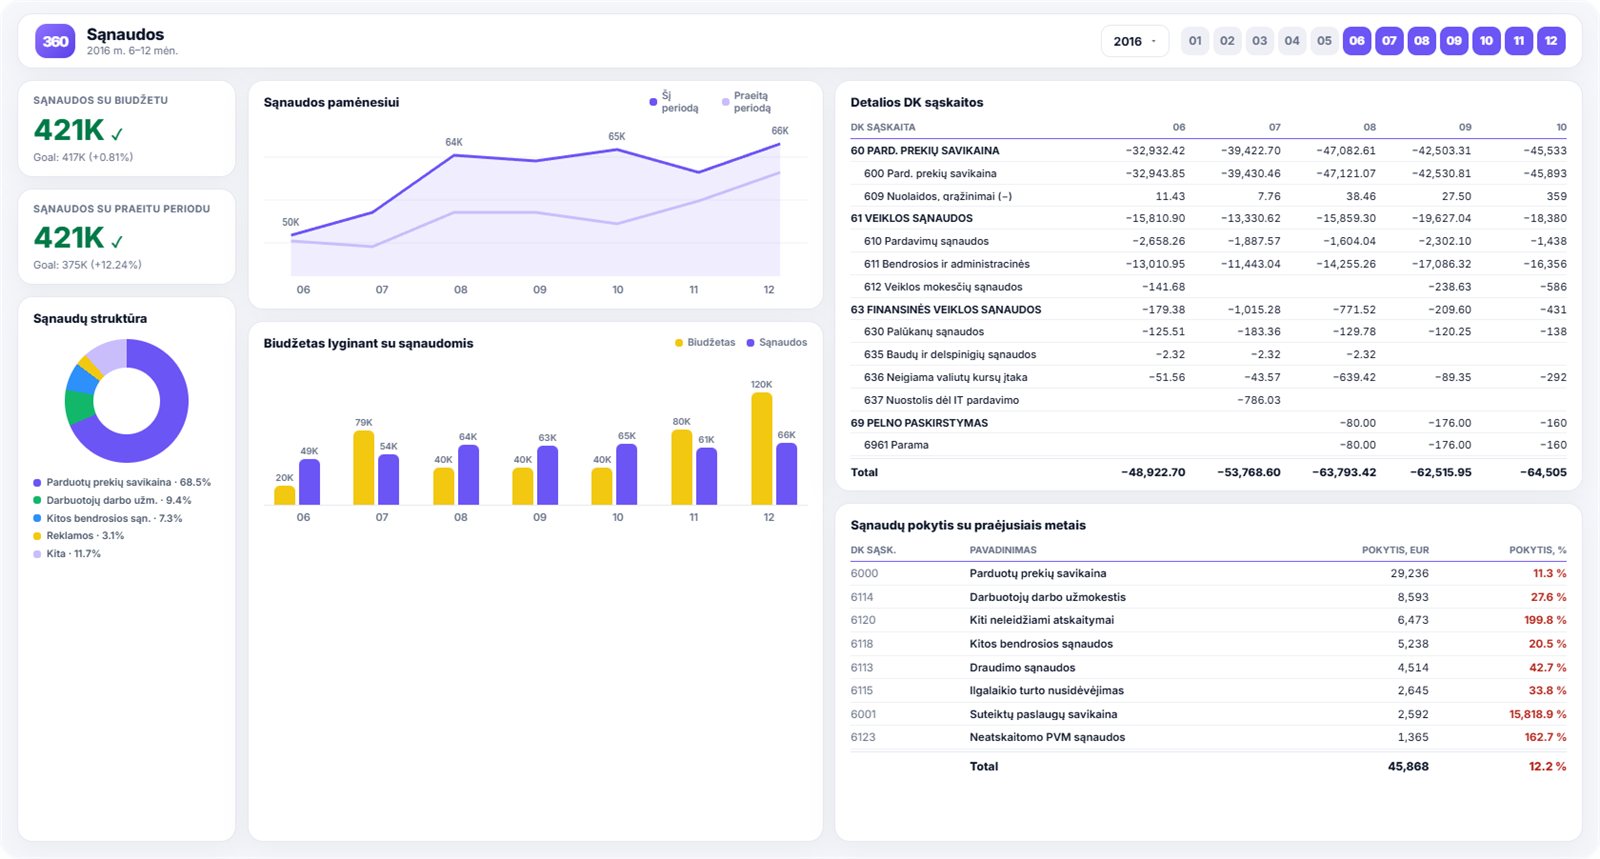
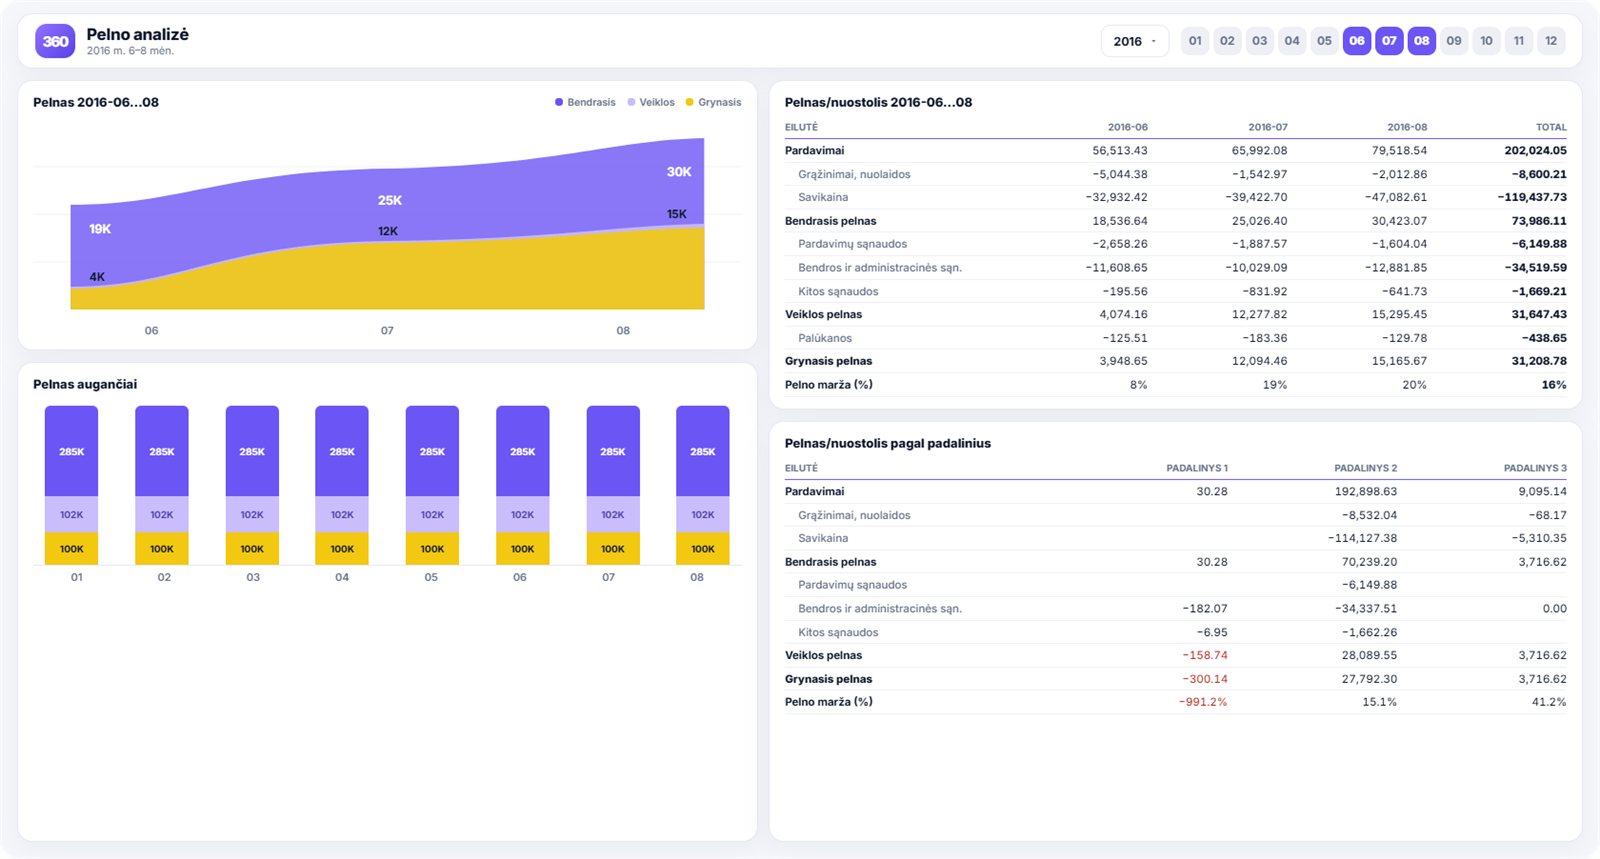
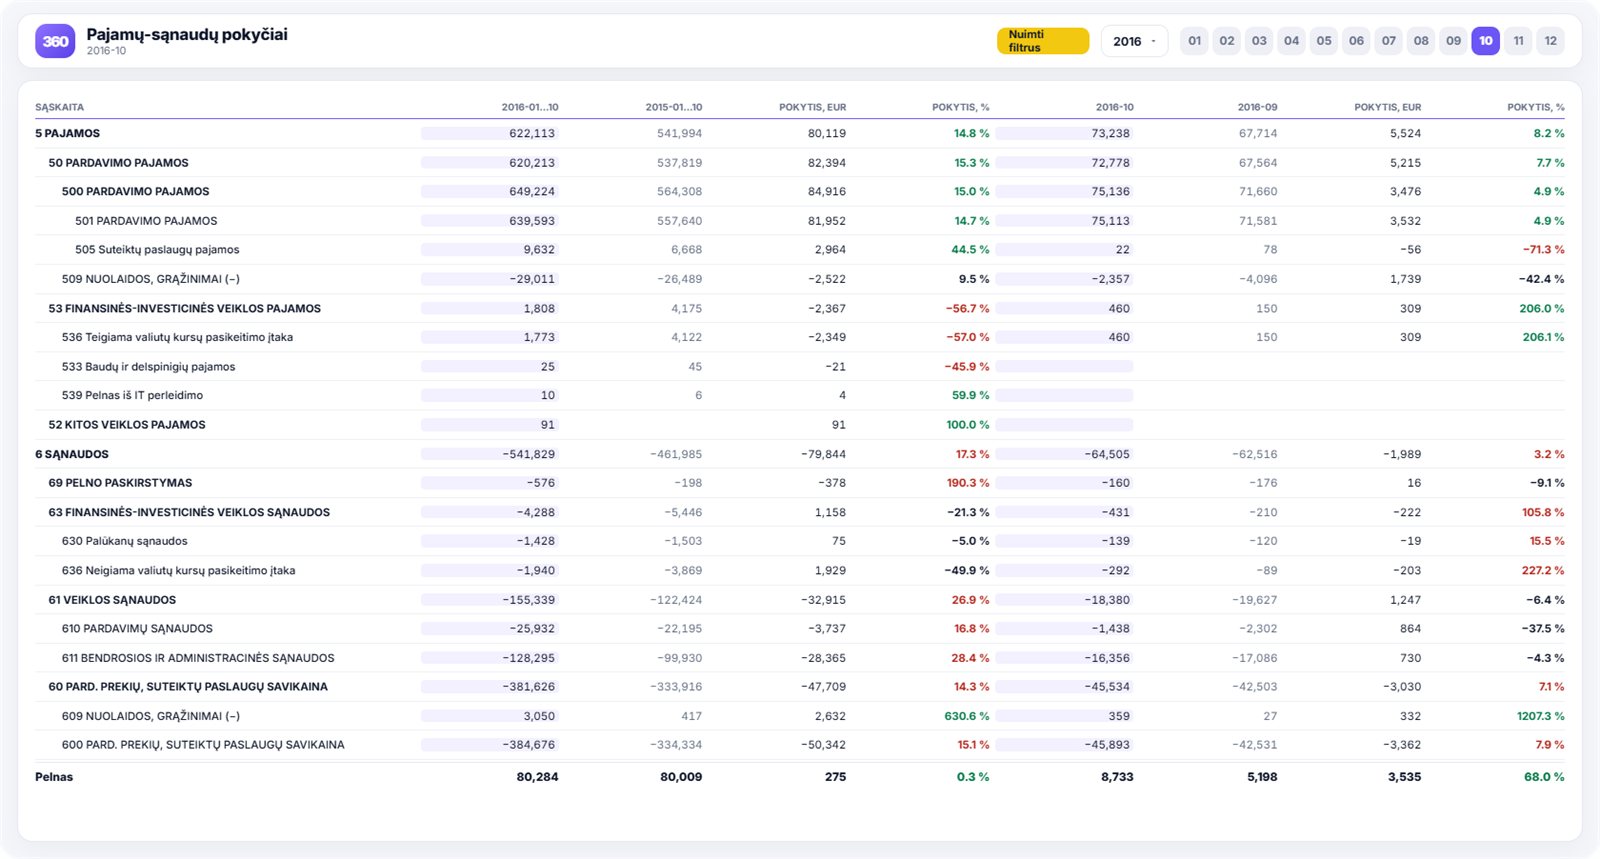
This report gives an executive the company's headline figures. For the period you choose it shows revenue, costs, profit, receivables and payables, and liquidity ratios, each compared automatically against the same period a year earlier. Revenue and cost movements are shown month by month and as totals for the period. It also carries the cash held at the bank at each month end, the movement in working capital, a condensed profit and loss statement, the number of invoices issued, and stock on hand.
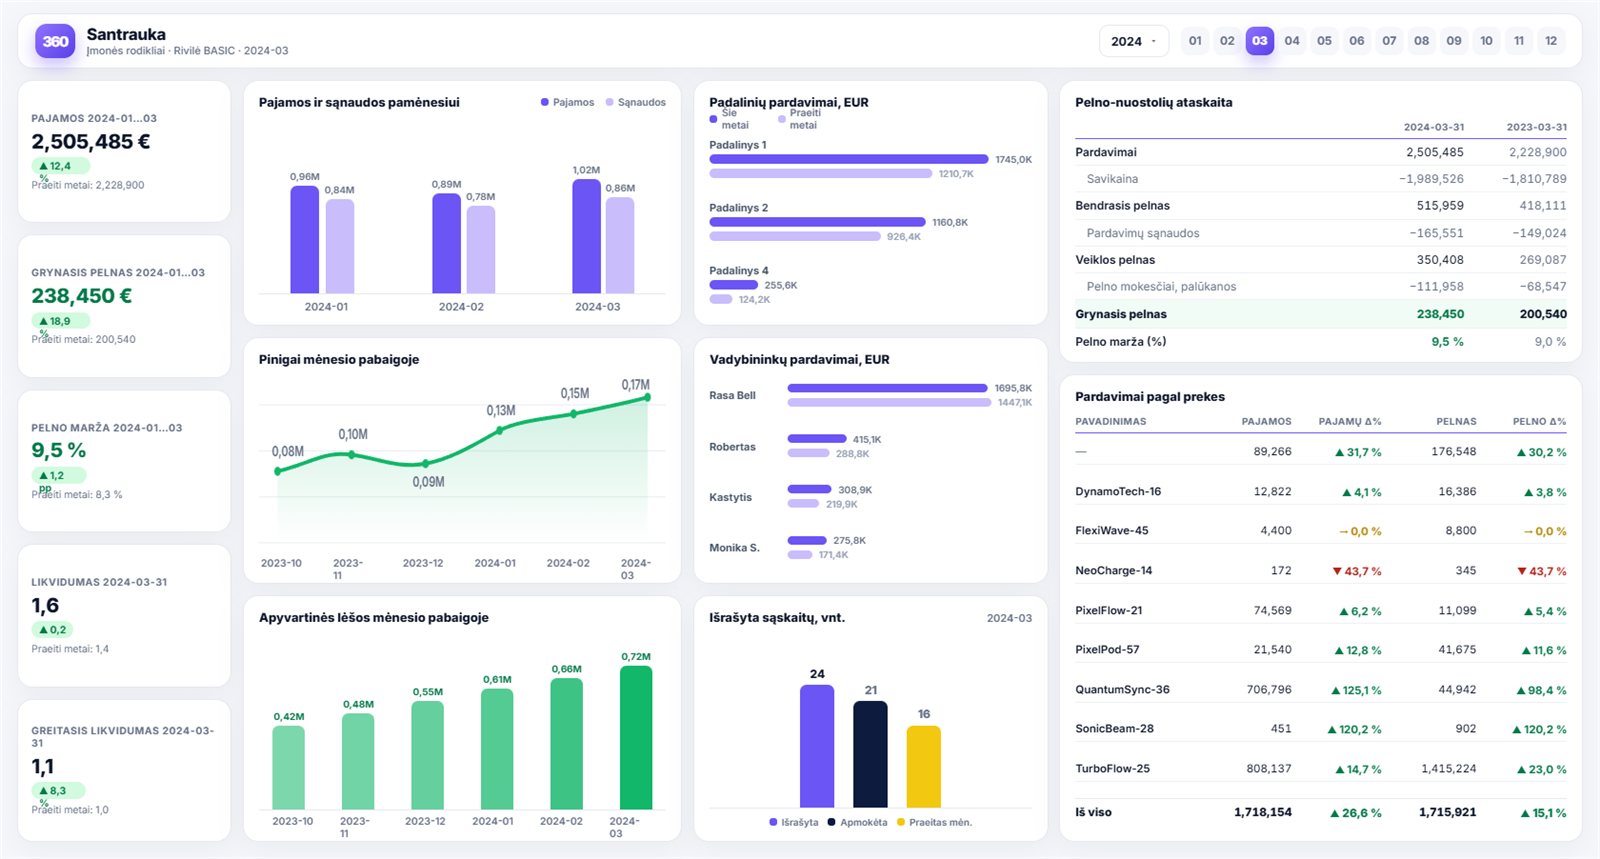
- Revenue, costs, profit and margin in one place
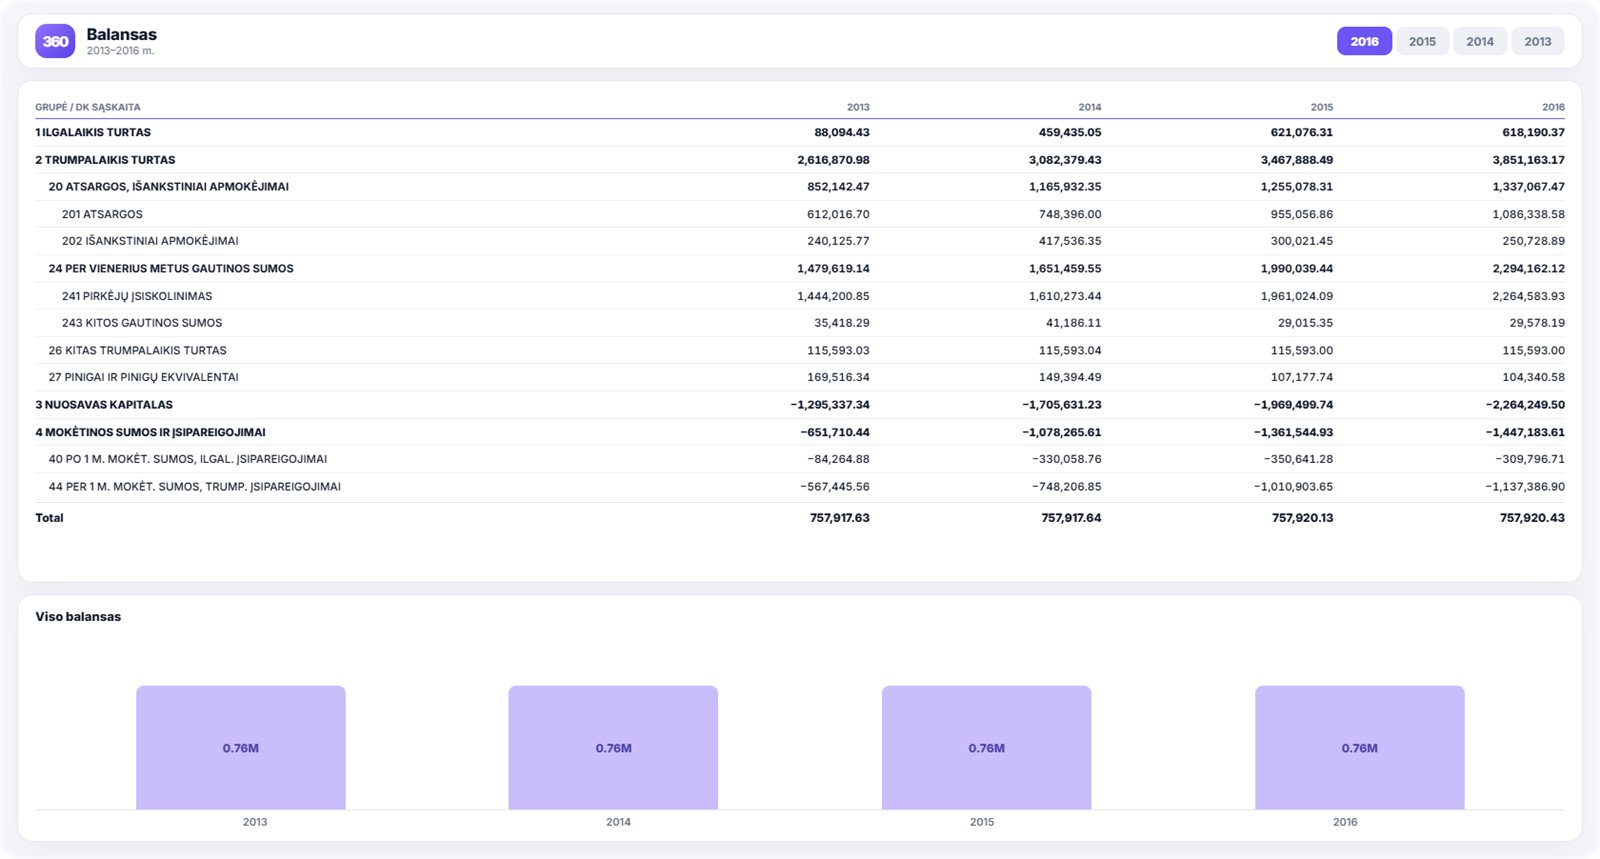
- Receivables and payables, liquidity ratios
- Automatic comparison with the same period last year
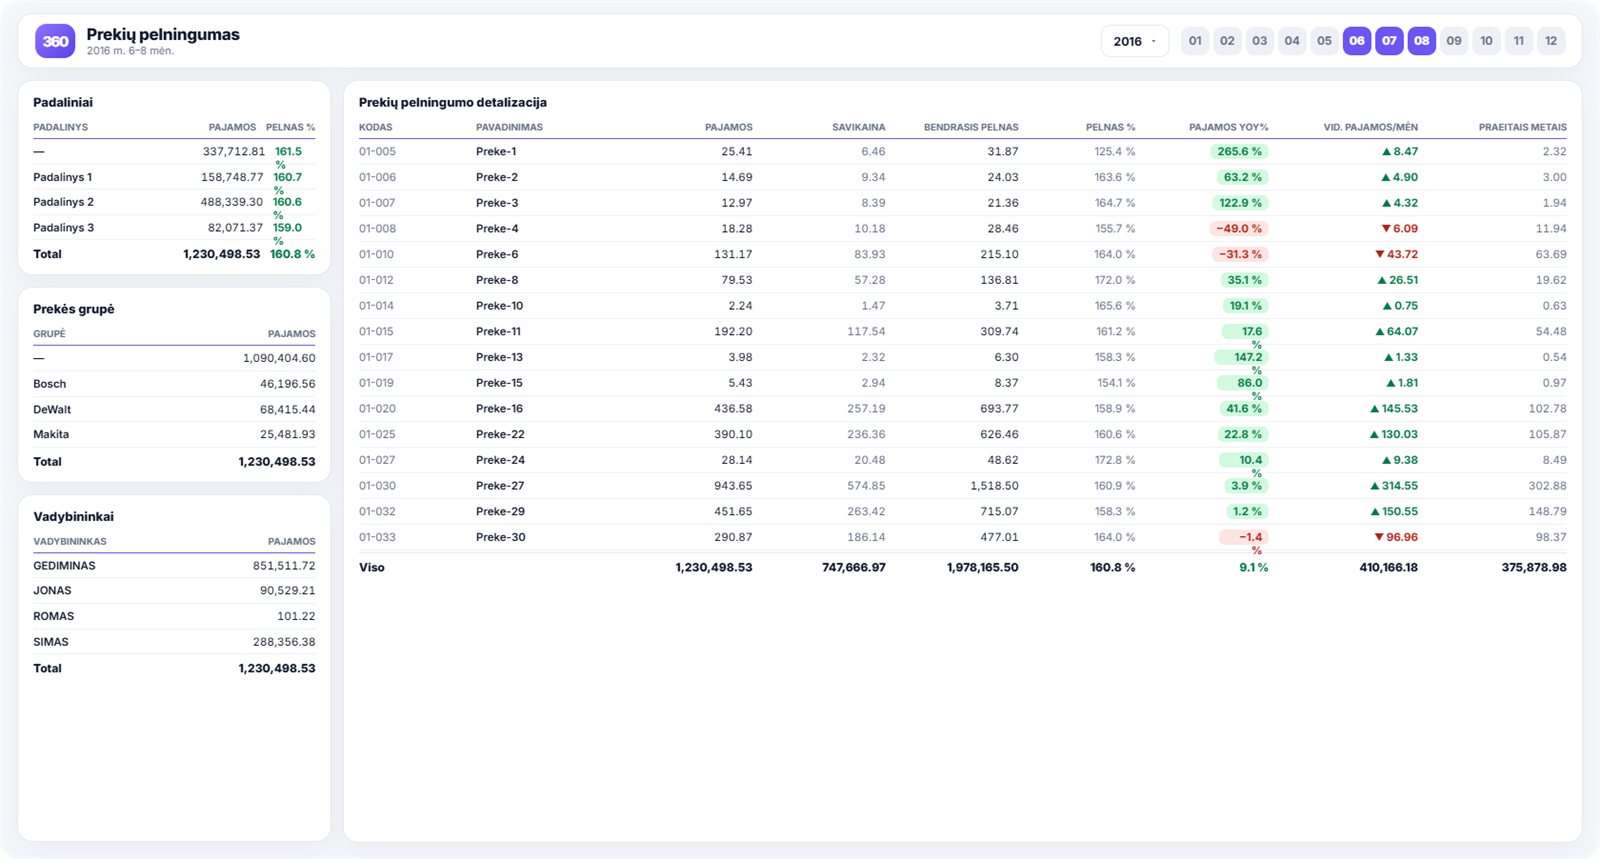
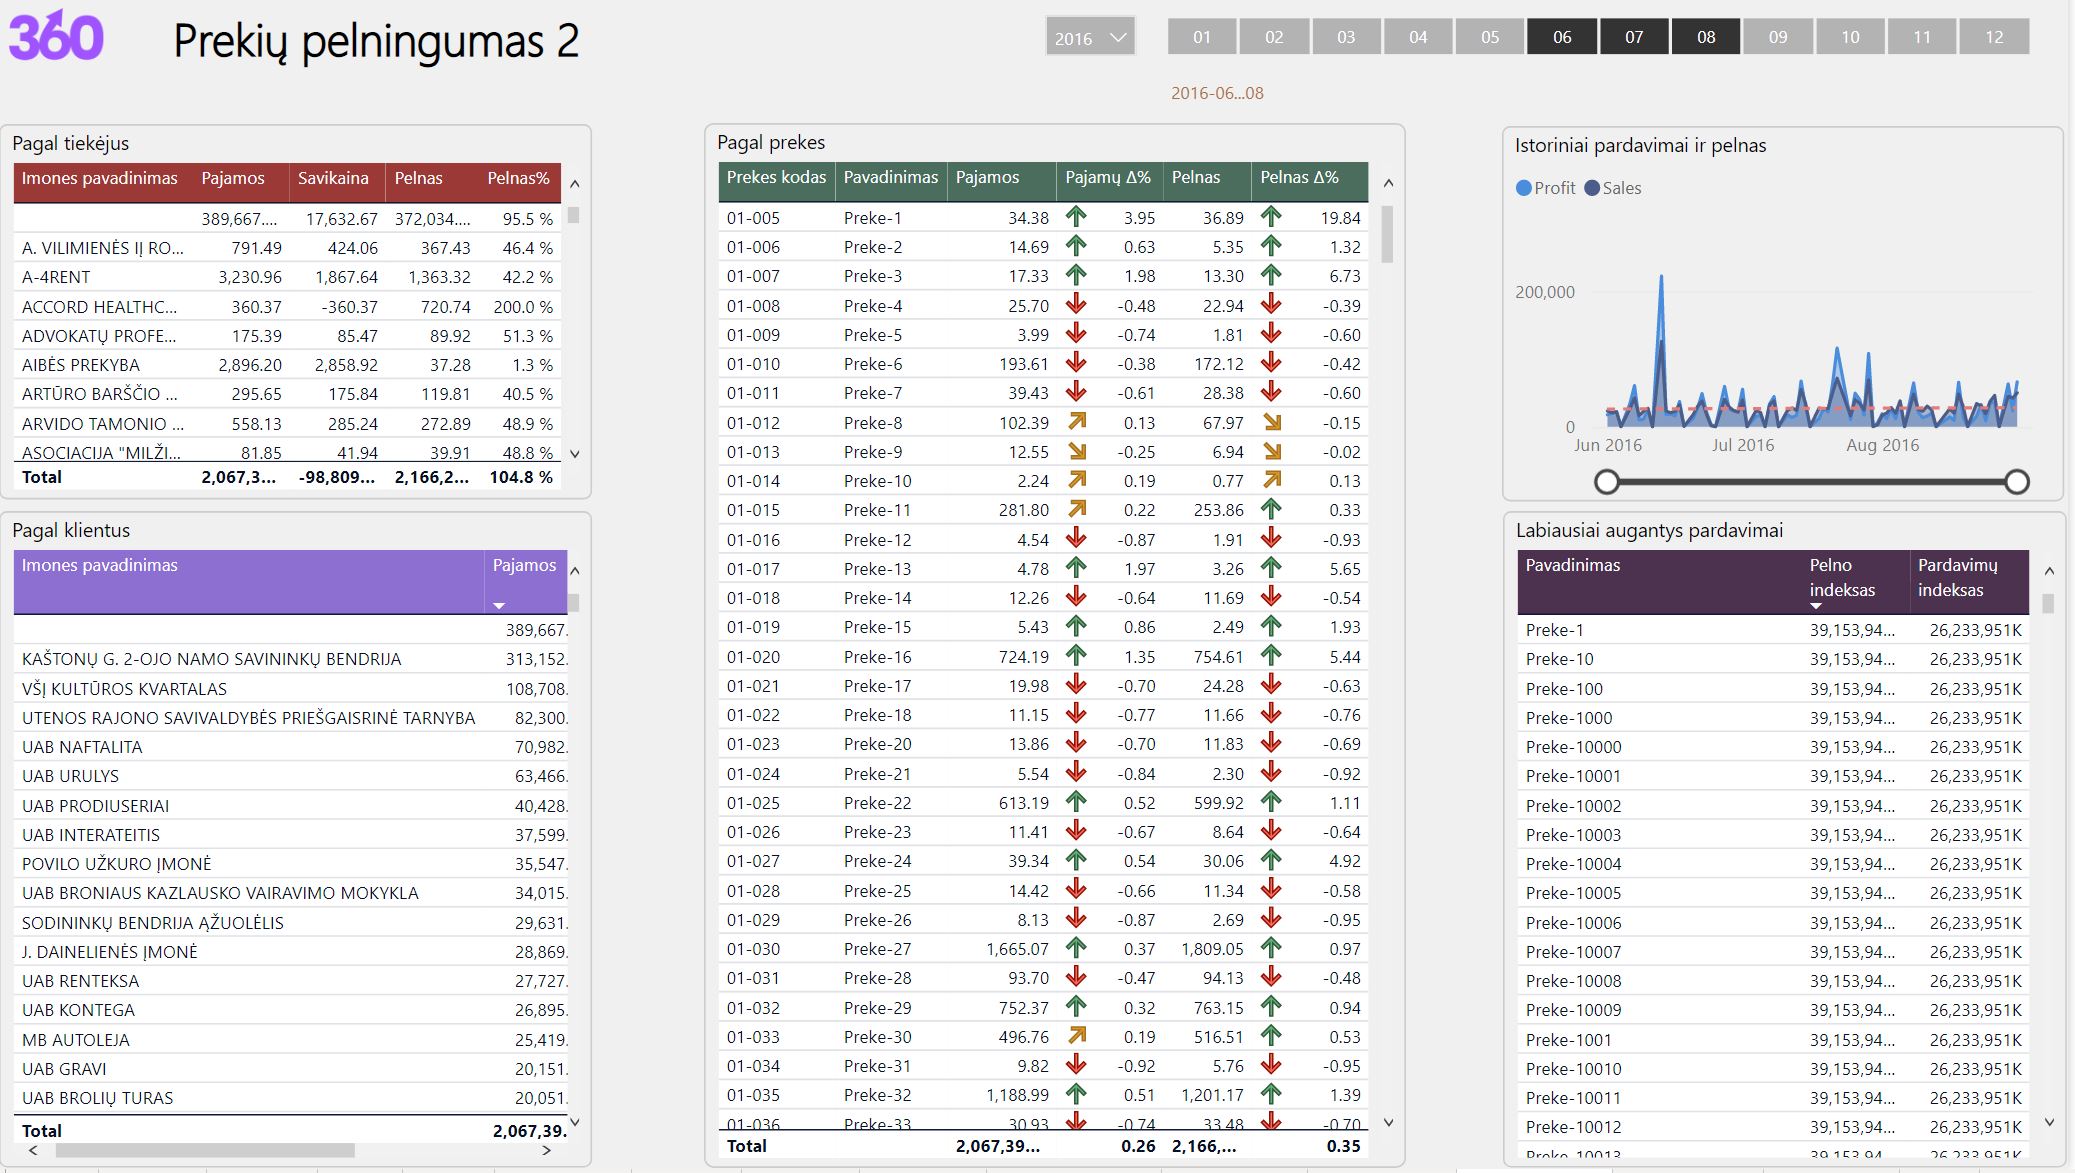
- Profit and loss statement, and sales by product