



“
We took the standard R-Keeper report package and they tailored it to us on top of that. It all just works.
Assets under management is only the beginning. These reports show where the growth comes from — return or new inflows — and what it costs to manage those assets.
Assets under management is only the beginning. What matters more is where the growth came from — market movement or capital raised — because they are two entirely different outcomes that look identical in a single total.
The analytics separate the two and add the cost side: what it costs to manage those assets, and whether scale is actually working. The reports refresh automatically from the portfolio management system and the accounts.
The total split into market movement and net inflows. Rising AUM against falling inflows is an entirely different situation from the reverse.
Performance against benchmark over several periods. A single year's figure says very little.
Net flow by period and by investor group — the earliest signal of how much confidence there is.
Management and performance fees kept apart. They behave differently: one is steady, the other swings with the market.
What share of assets the largest investors hold. One big redemption can change the economics of the whole firm.
Costs as a percentage of assets under management. As assets grow this should fall — if it does not, scale is not working.
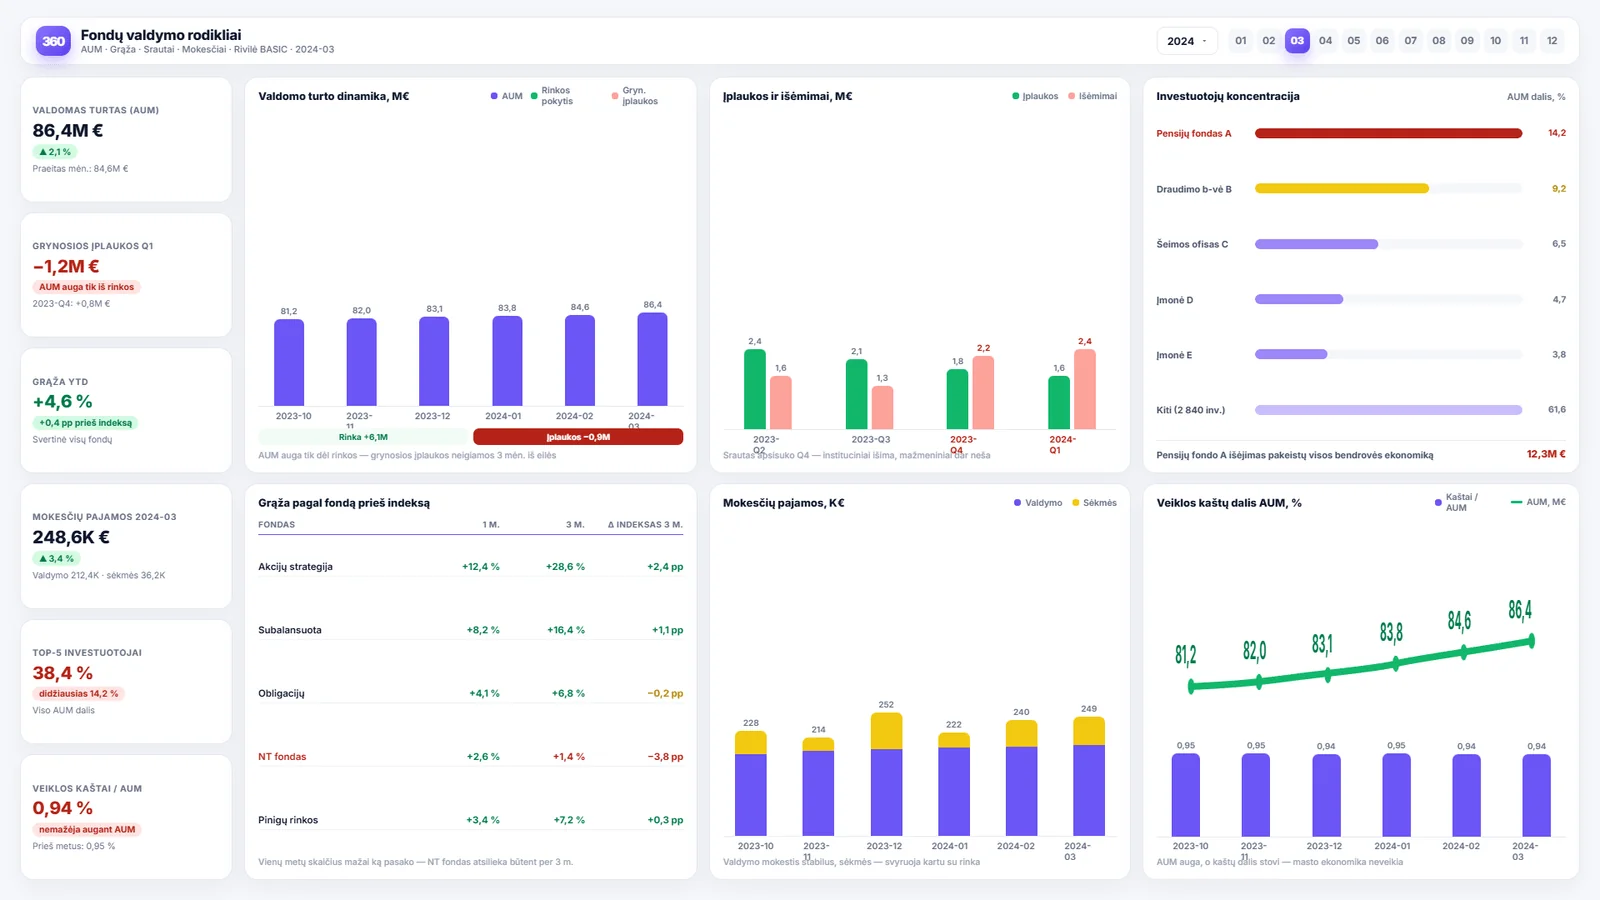
Assets under management are split into market movement and net inflows. In the sample report AUM is rising while net inflows are negative — the growth is coming from the market, not from sales.
Inflows and redemptions are shown by quarter, so a turn in the flow is visible immediately. Investor concentration next to it answers the principal risk: what share of assets the largest client holds.
Return is given by fund against benchmark over several periods, and operating costs as a share of AUM track whether the cost percentage falls as assets grow. If it does not, the economies of scale are not there.
See how companies like yours put Analitika360 reports to work in Power BI.
Most people start with a ready-built report set, which connects to your accounting system within a few days, and add the industry-specific reports as a second stage. Describe your situation and we will tell you what would work best in your case.