Power BI business analytics for executives
- Revenue, costs, profit and margin in one place
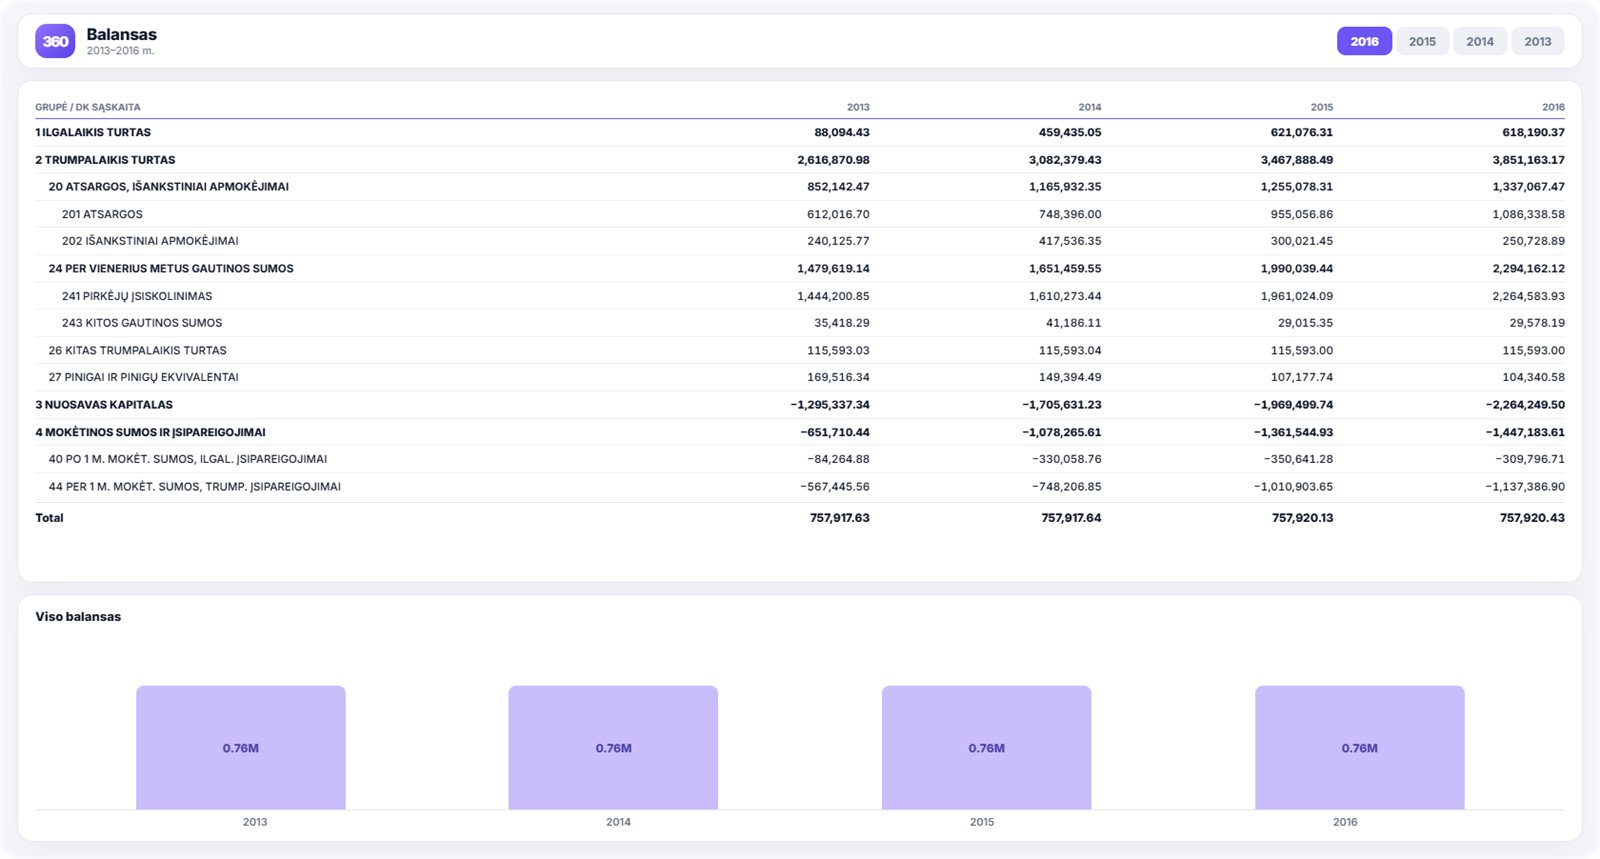
- Receivables and payables, liquidity ratios
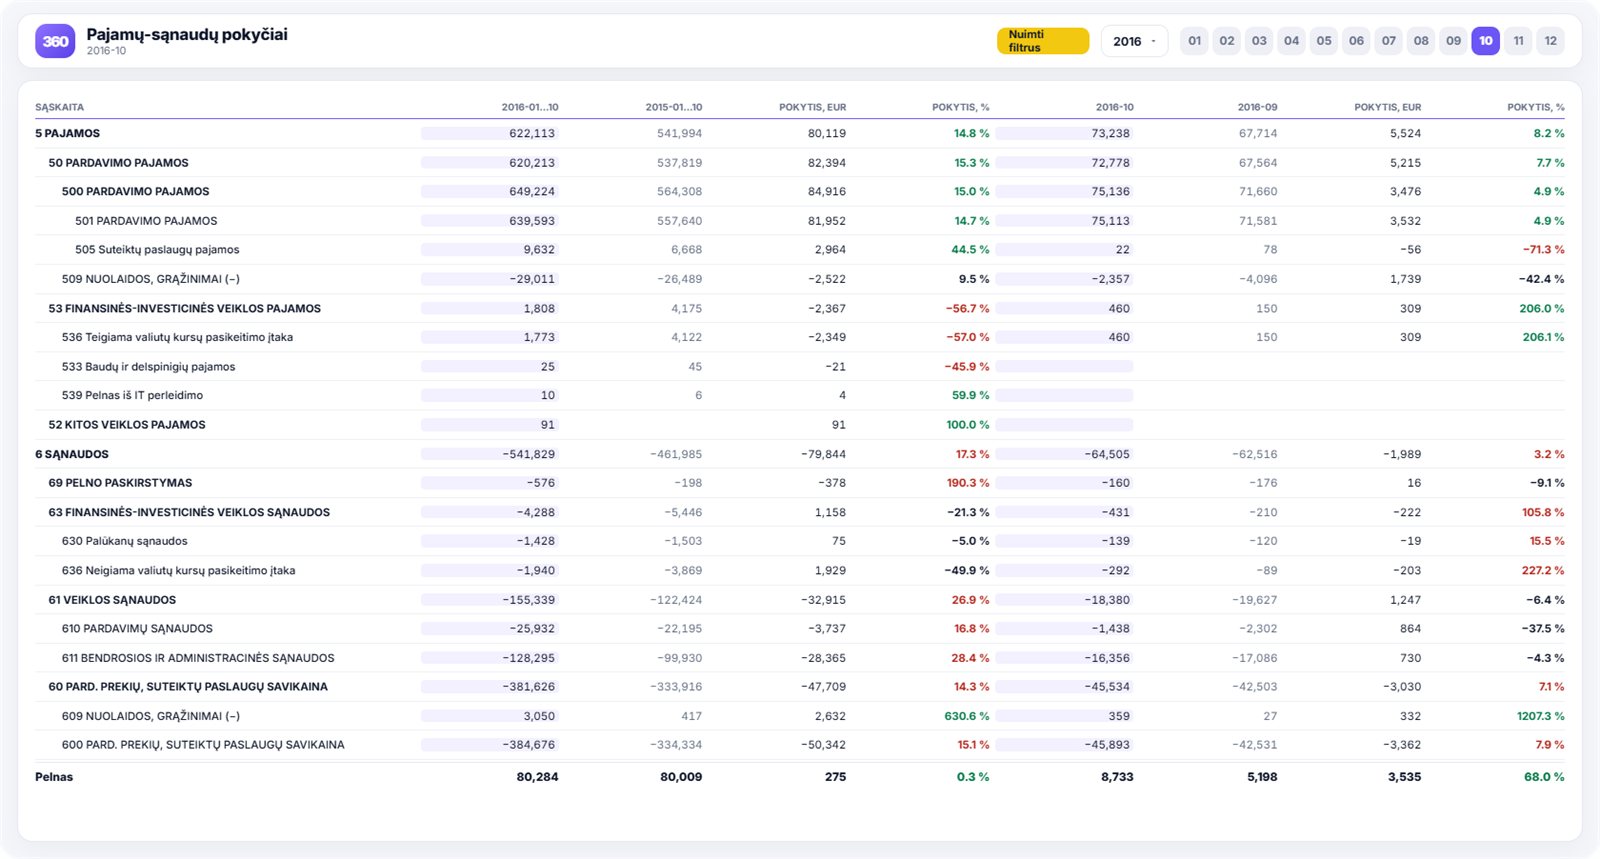
- Automatic comparison with the same period last year
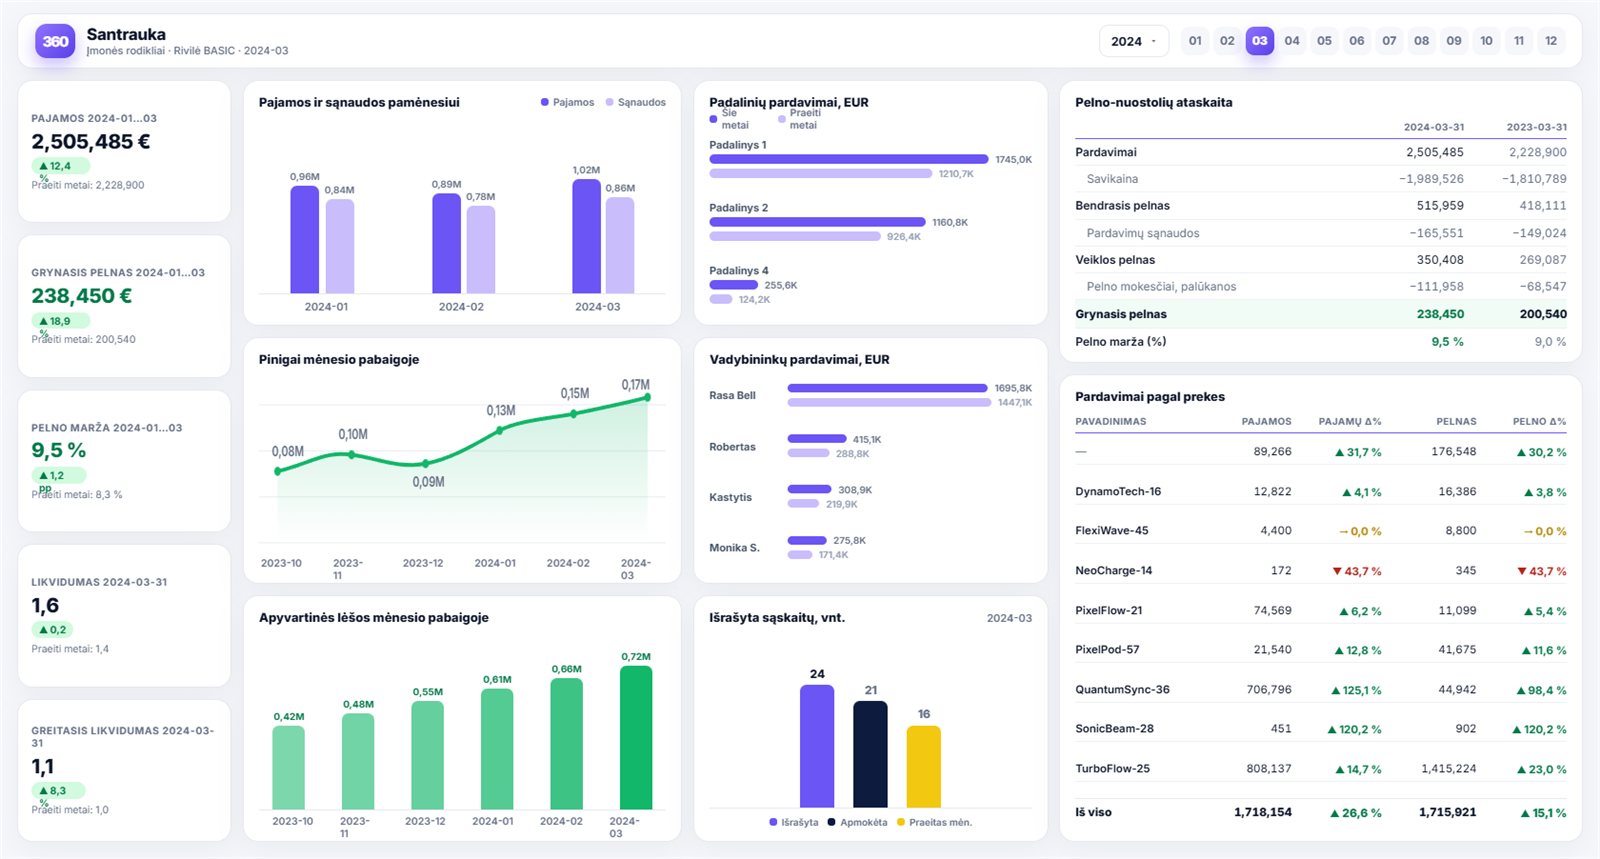
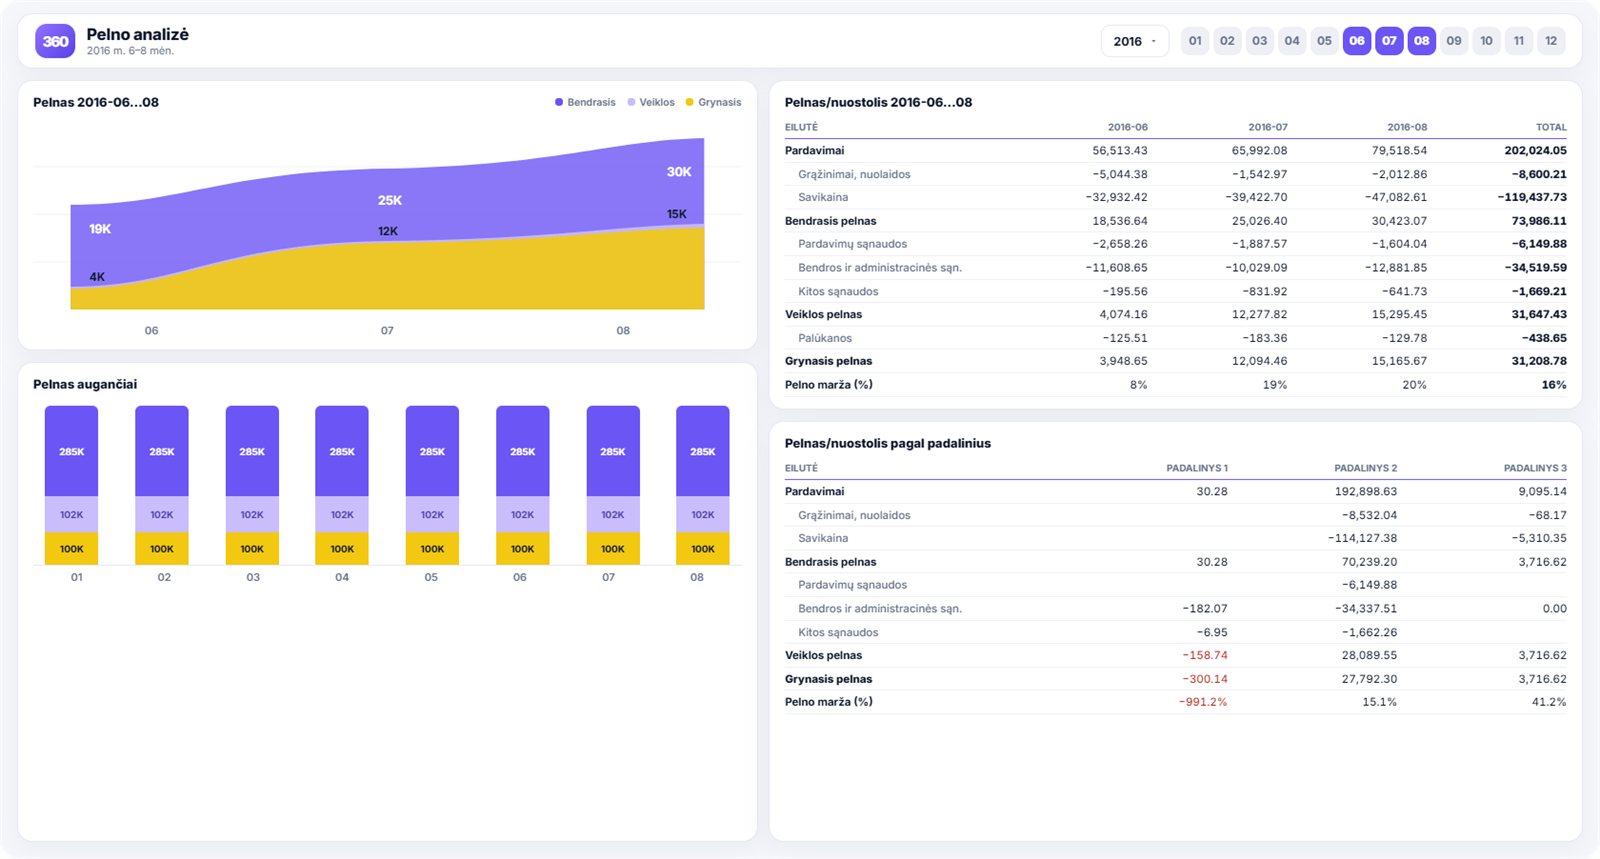
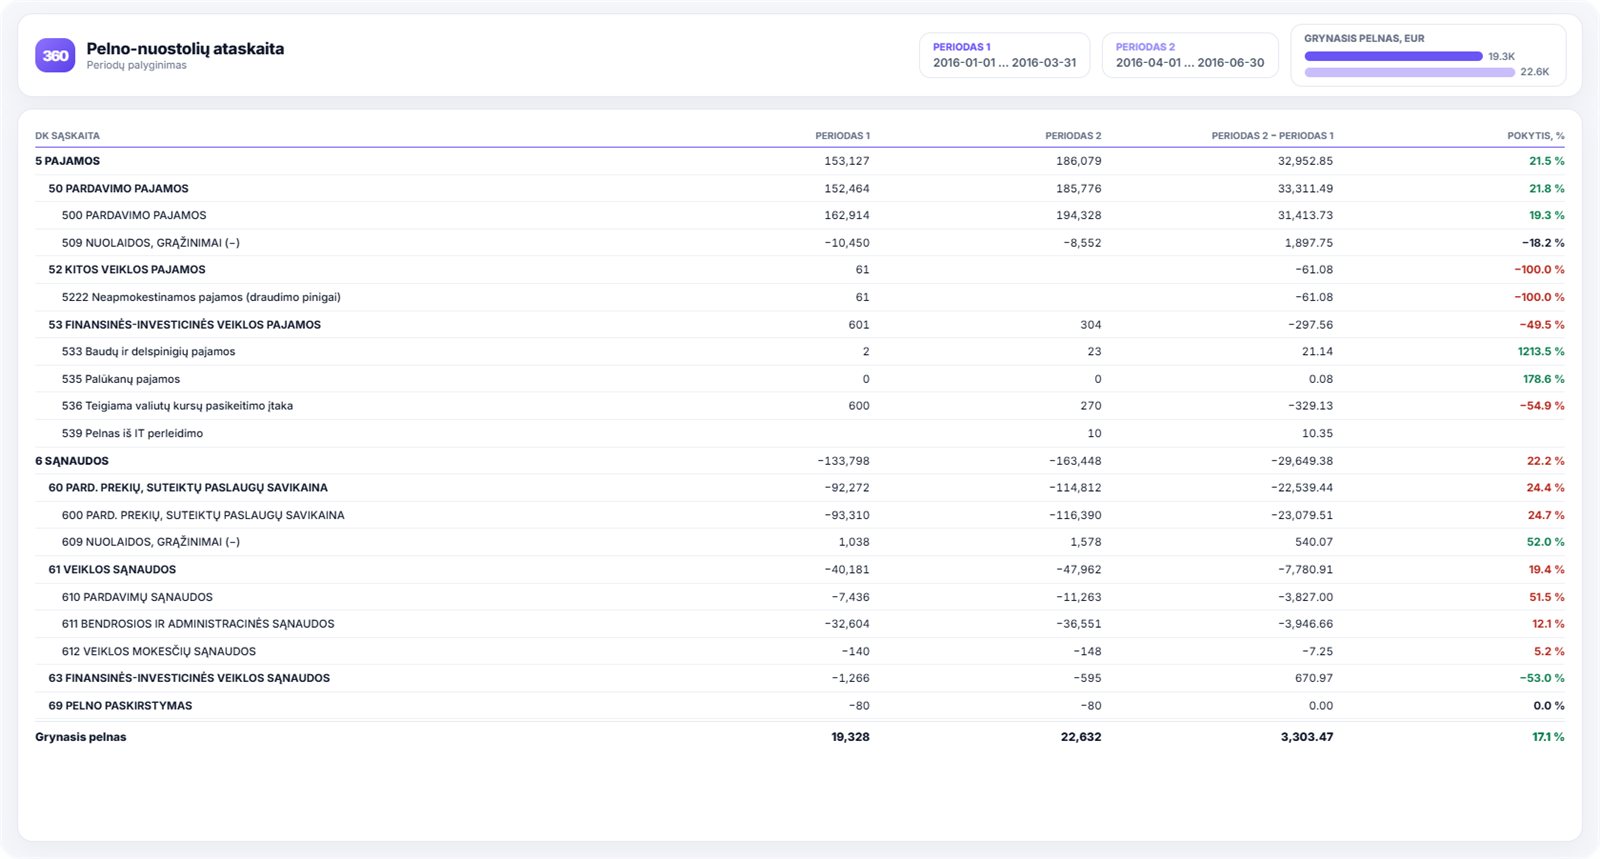
- Profit and loss statement, and sales by product
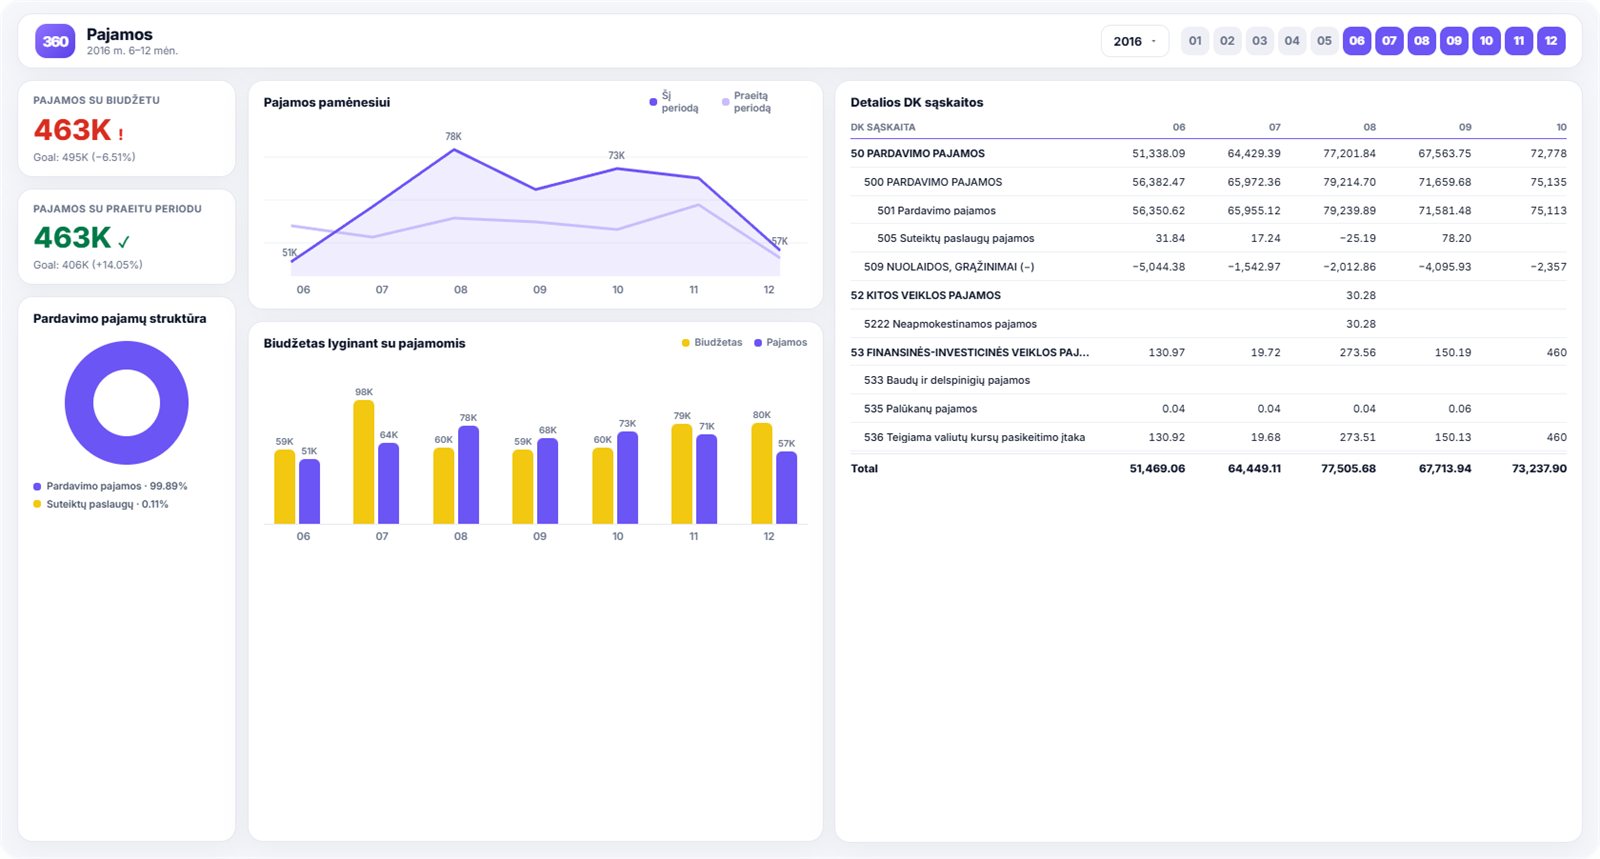
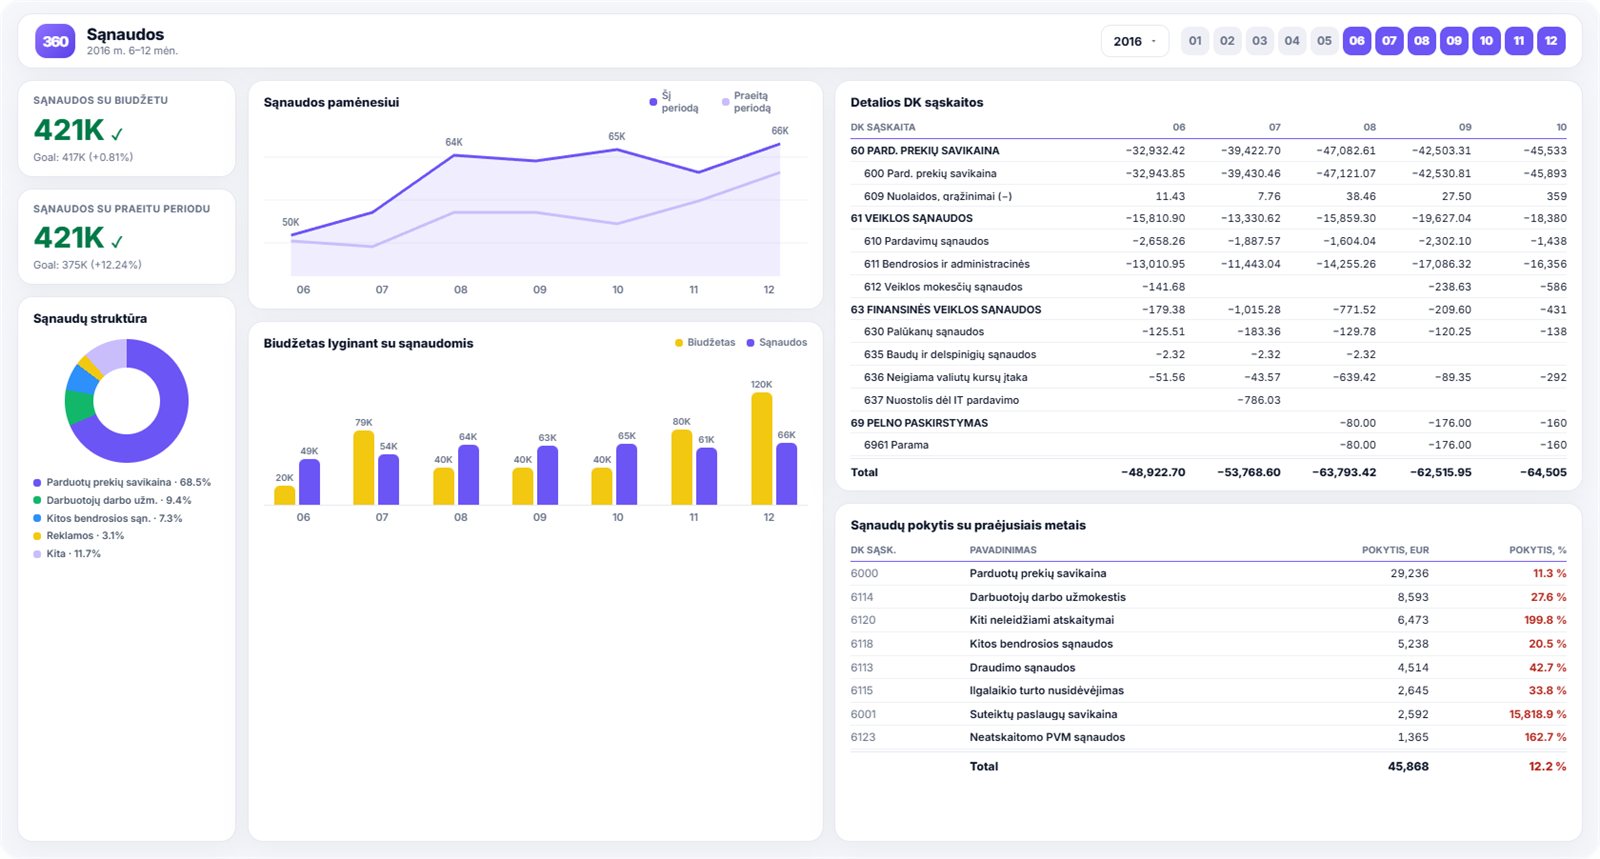
The second page analyses revenue. It shows revenue month by month and cumulatively, compares it against the same period a year earlier, breaks it down as percentages and sets it against budget. A separate table lets you expand any summary account down to the individual entries.
The third page analyses the company's costs. It shows costs month by month and cumulatively, compares them against the same period a year earlier, breaks them down as percentages and sets them against budget. A separate table lets you expand any summary account down to the individual entries.
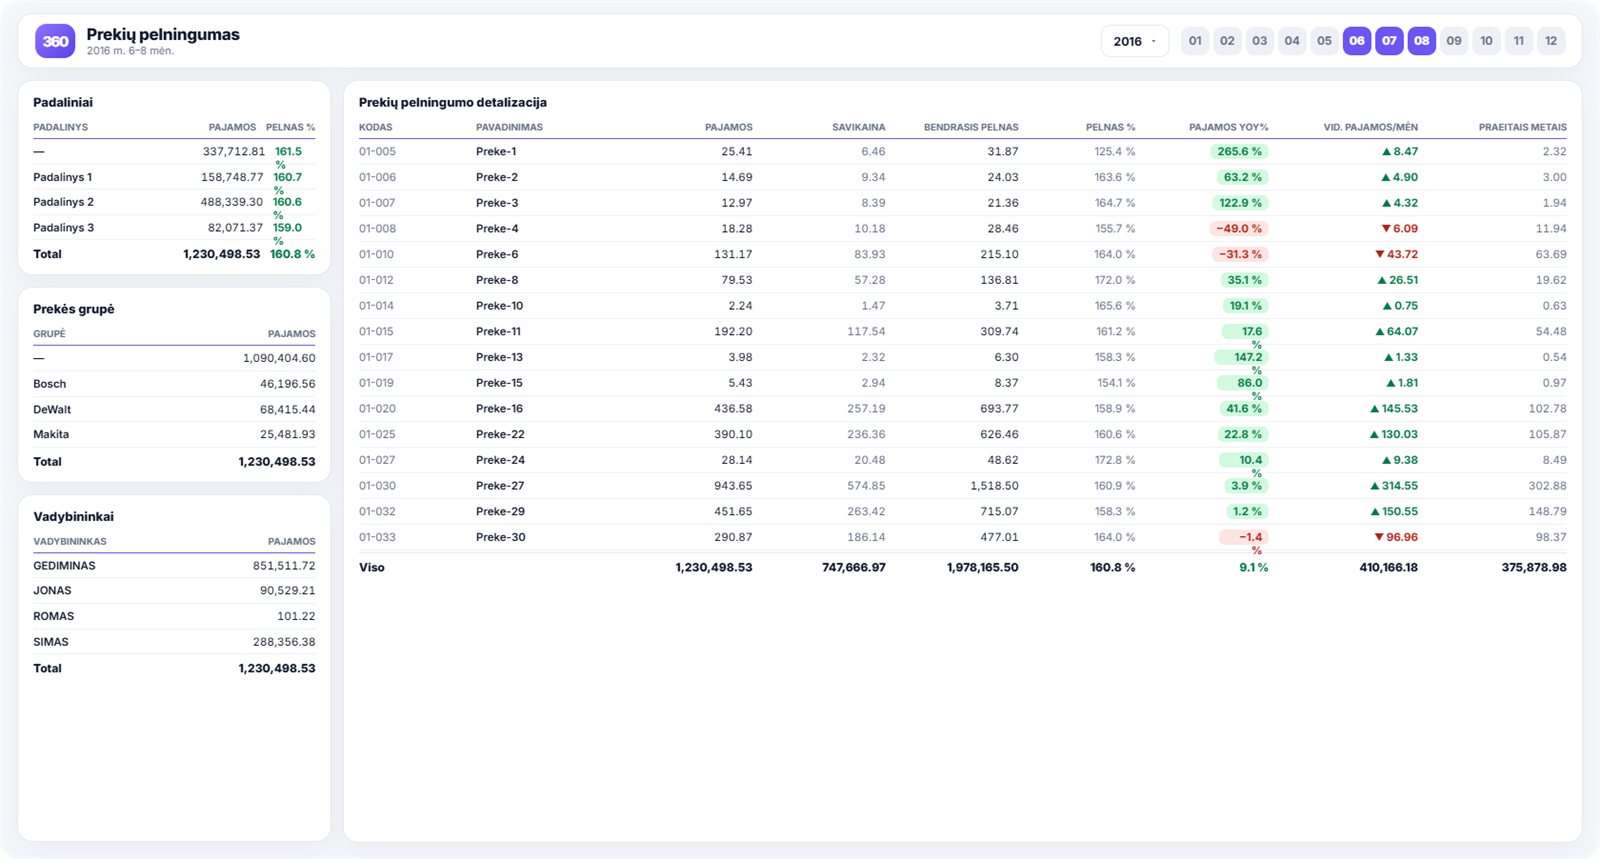
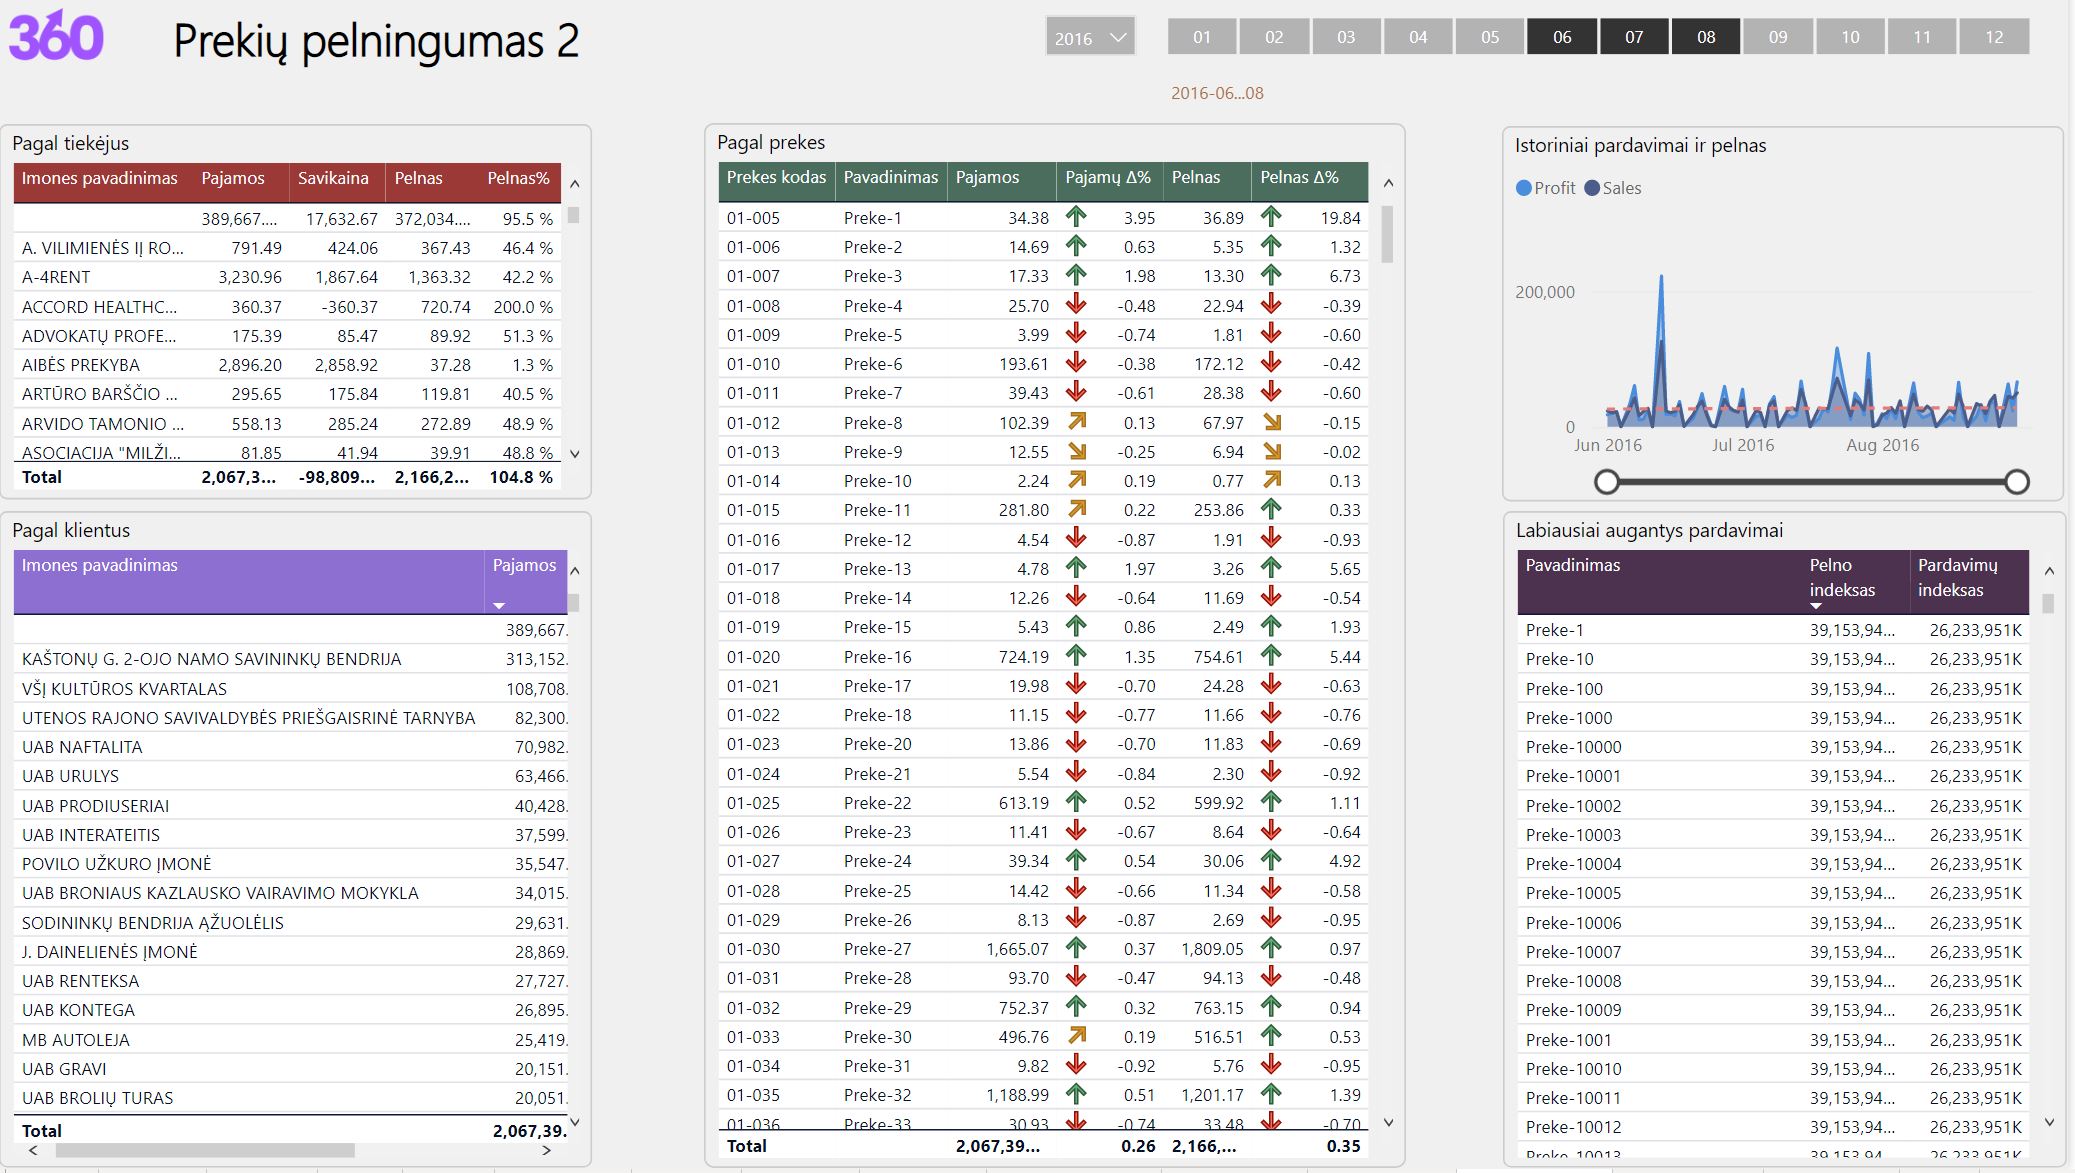
This page shows sales, profit and profit margin for the period, along with how many invoices were issued, the average invoice value and the discounts given — all against the same period a year earlier. Sales are broken down by product group and business unit, and a table shows each account manager's sales, the margin on them and how many customers they hold.
The eighteenth page shows stock on hand: how much of each product is in the warehouse, when it was last purchased and in what quantity. Select any product and its movement is drawn as a chart.
Power BI is a modern data analytics platform for presenting data quickly and clearly, filtering and sorting it, and comparing it against other periods. It also has AI features that can draw conclusions from large bodies of data with no obvious direct connection between them.
Power BI can import from practically every common database (SQL, DB2, Oracle, Informix, Netezza, Essbase, Impala and others), from accounting and ERP systems (Rivilė, Navision, Axapta, Salesforce, Dynamics 365), from online services (Azure DevOps, Google Analytics, Adobe Analytics, Facebook, web pages and more), and from Excel, PDF, XML and JSON files.
Building the same reports in Excel is considerably harder. To stop having to fix them every time the volume of data changes, you end up writing Visual Basic macros. Excel has no drill-through when you need to go deeper into the data, and it does not cope with large volumes. In Power BI the only limit on how much data you process at once is your server's memory.
All data stored in Power BI is encrypted by default using Microsoft-managed keys. Customer data held in Azure SQL databases is fully encrypted with Azure SQL Transparent Data Encryption (TDE). Customer data in Azure Blob storage is encrypted with Azure Storage Encryption.
Yes. Analitika360 requires all inbound HTTP traffic to be encrypted with TLS 1.2 or later. Any request that tries to use TLS 1.1 or older is rejected.
Yes.
Yes — every user must use multi-factor authentication. An Analitika360 user signs in with a username, a password and a code sent to their phone.
Start reading your business data in real time and decide while it still counts — write to us and we will show you how the Finvalda PRO reports would work with your own data.
See how companies like yours put Analitika360 reports to work in Power BI.