






Solutions

Business analytics for financial services firms

For brokers, insurance agencies, accountancy practices and consultancies, what matters is not turnover but the value of a client over time: what they bring in, and what they cost to serve.

Pricing and plans
Accounting vs analytics
Accounting

For brokers, insurance agencies and consultancies, turnover says very little. What counts is the value of a client over time: what they bring in, what they cost to serve, and whether the contract will be renewed.

CommissionsContract end datesTime spent per clientClient lists = a single number?
Business analytics

An analytics system joins the accounts, the CRM and the commission records, so client profitability and contract renewals sit on one screen. A falling renewal rate is spotted before the revenue drops.

Rivilė / FinvaldaCRM system
Joined up overnight Client profitability alongside the renewal rate

The figures worth watching

Client profitability

Commission or retainer less the time actually spent. A small client who needs a lot of attention is often loss-making.

Recurring revenue

How much of the revenue comes from ongoing contracts and how much from one-off deals. That ratio decides directly how predictable the business is.

Renewal rate

How many contracts are renewed at term, by product and by adviser. A falling rate shows up before the revenue does.

Customer churn

Who left, and when. Read against purchase frequency, it shows the customers you can still hold on to.

Adviser and agent performance

Profit rather than turnover, and the quality of the book. The agent with the biggest turnover is not always the one who brings in the most.

Client concentration

What share of revenue the five largest clients account for. In a service business that is the principal risk.
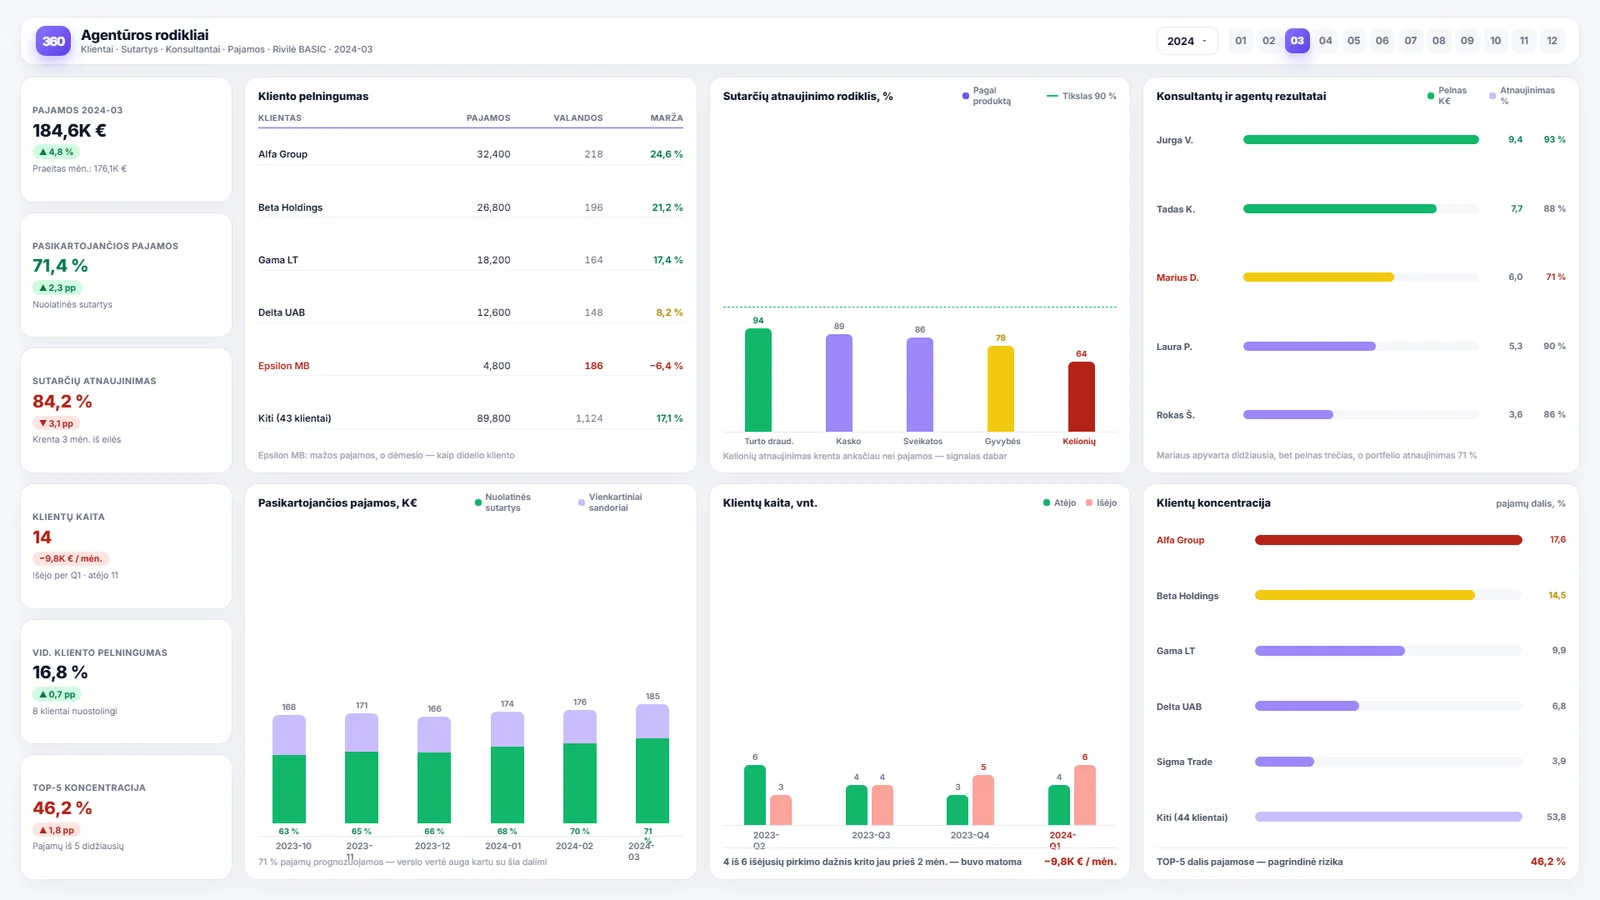
How it looks in the report

Business analytics for financial services firms — Power BI ataskaitos pavyzdys
A sample report using demonstration data.
How to read the report
01

Client profitability

Client profitability is shown with revenue and hours spent side by side. A small client who needs a lot of attention drops straight to the bottom of the table with a negative margin.

02

Contract renewals

The renewal rate is given by product against a target. A product whose renewals are slipping is an early warning — the revenue will shrink a few months later, when it is too late to act.

03

Advisers and risk

Adviser performance is shown alongside renewals in their book, and churn and concentration at the bottom answer the principal risk: what share of revenue the five largest clients account for, and how many left this quarter.

Where the data comes from

  • the accounting system
  • a CRM or client management system
  • commission and contract records
  • time recording, where it is kept
Read access The connection is read-only — the reports read your data, change nothing, and never write back to your systems.

What people usually notice first

  1. 1 What usually emerges first is that profitability varies between clients far more than expected — some small clients are served at a loss, because the contract price has not changed in years.
  2. 2 The second finding is contracts whose renewal nobody is tracking, and which quietly lapse without anyone having spoken to the client.
Analitika360 client stories

Data that helps you decide

See how companies like yours put Analitika360 reports to work in Power BI.

We took the standard R-Keeper report package and they tailored it to us on top of that. It all just works.
TB
Tomas B.restaurant owner
Twenty ready-made reports — we didn't have to work out what to ask for. Our Finvalda data is finally something you can look at. Recommended.
IM
Ingrida M.accountant
What we liked was that Analitika360 already had a 20-report package for Rivilė users — we didn't have to work out our requirements from scratch. We were up and running quickly, and later they adapted several reports to the specifics of our production. It saved us both time and money.
MK
Marius K.finance director
We are a group of companies running Rivilė, and consolidated reporting was always a headache. Analitika360 started from the standard 20-report package and then fitted it to our group structure — we now see everything in one Power BI model, and it refreshes itself.
GJ
Giedrė Jankauskaitėfinancial accountant
We run six restaurants on R-Keeper and had long been looking for a way to compare results across sites. The standard 20-report package covered most of what we needed, and reports specific to our group were added later.
Andrius Š.director of a restaurant group
We came to them on a recommendation, and the ready-made 20-report standard for Finvalda users was a pleasant surprise straight away. Management now gets a clear financial picture every Monday, and I no longer spend days exporting data into Excel.
RP
Rasa Petrauskienėhead of accounting
We use Rivilė, but we never had time to build reports from scratch. The 20-report package was exactly what we needed — we had it running within a week.
VP
Vaidas P.retail chain manager
We have four cafés on R-Keeper and for a long time we ran them on gut feel. The Analitika360 reports showed us things we had simply never noticed. We now decide on the numbers rather than on guesswork.
LK
Laura Kazlauskienėfinance director of a café group

Where to start

Most people start with a ready-built report set, which connects to your accounting system within a few days, and add the industry-specific reports as a second stage. Describe your situation and we will tell you what would work best in your case.

Report examples