
CFO reports: what they cover and how to prepare them properly

CFO reports are a standard set of financial statements and management dashboards that support quick decisions and cash flow management. They are not a single document but a set that, taken together, shows a company’s financial position, profitability and cash movements.
The core CFO reporting set includes:
- the balance sheet: a snapshot of equity, assets and liabilities on a given date;
- the profit and loss statement: a summary of income and expenses over a period;
- the cash flow statement: the actual movement of cash, which often differs from accounting profit.
Expert tip: A manager who only looks at the profit and loss statement sees half the picture. The cash flow statement shows whether the company actually has the money to pay its bills, whatever the profit figure says.
Automated reporting, such as Power BI solutions, lets you see this data in real time, without waiting for month-end and manual data entry.
Key takeaways
CFO reports only add value when they combine the right content, timely data and clear KPI interpretation, and automation speeds this process up without introducing extra errors.
| Point | Details |
|---|---|
| A full set depends on size | Micro-enterprises can often make do with abridged financial statements, whereas medium-sized and large companies usually need a full set of financial statements. |
| Deadlines are strict | Annual financial statements are prepared within 4 months, and submitted to the Centre of Registers (Registrų centras), which keeps the register of legal entities, within 3 days of approval. |
| KPIs need context | Liquidity, margin and turnover are assessed against previous periods, not in isolation. |
| Automation saves time | Power BI connected to Rivilė or Finvalda eliminates manual data entry and reduces the risk of errors. |
| Analitika360 as a solution | Analitika360 offers ready-built Power BI packages integrated with Rivilė and Finvalda, tailored to restaurants, leasing and the financial sector. |
Contents
- Which reports a CFO reporting set includes and how this depends on company size
- Which CFO KPIs matter most and how to interpret them
- When to prepare reports: frequency, deadlines and automation
- When it is worth hiring an outsourced CFO or commissioning a consultation
- Analitika360: automated Power BI reports for CFO needs
- Budgeting and budget control
- How to interpret CFO reports properly for business decisions
- Good practice and common mistakes in preparing CFO reports
- Pricing models for CFO reporting and automation services
- Why automating CFO reports matters more than it seems
- How to get started with automated CFO reports
- Sources
Which reports a CFO reporting set includes and how this depends on company size
A full set of CFO financial statements is made up of several core elements, but not every company is required to prepare all of them.

The balance sheet shows what the company controls (its assets) and to whom it owes them (its liabilities and equity) on a given date. The profit and loss statement shows how much the company earned and how much it spent during the reporting period, resulting in a net profit or loss. The cash flow statement is fundamentally different from the profit and loss statement. Profit can be positive while the bank account runs short, if customers are paying late or large sums are tied up in inventory. The statement of changes in equity shows how the capital invested by the owners changed over the period, while the explanatory notes provide context that the figures alone cannot, such as accounting policies or significant one-off events.
The scope of the set depends on company size: current legislation provides that micro-enterprises can often make do with an abridged balance sheet and profit and loss statement, while medium-sized and large companies must prepare a full set with all five elements. The statements must also include comparative figures for the previous year and be signed by the managing director, and sometimes by the chief accountant as well, as set out in the accounting requirements in Lithuania.
Which CFO KPIs matter most and how to interpret them
Figures on their own say nothing until you compare them with something: the previous period, the plan or the market average. That is why CFO report analysis always works through four main groups of indicators.
- Liquidity ratios: the ratio of current assets to current liabilities, showing whether the company can cover its most immediate debts.
- Turnover ratios: how quickly inventory or receivables are converted into cash.
- Profit margin: how much profit is actually left from each euro of sales, looking at gross and net margin separately.
- Debt-to-equity ratio: how far the company’s operations are financed with borrowed funds compared with its own.
Trend analysis (how an indicator has changed over the last six or twelve months) is often more important than a single value.
Bare calculation without context is a limited tool. Managers need commentary on causes, not just on effects. If the margin is falling, the CFO report should answer whether this is down to higher raw material prices, excessive discounts or insufficient growth in sales volume. Each cause calls for a different action: one requires negotiations with suppliers, another a review of pricing.
When to prepare reports: frequency, deadlines and automation
Monthly reports allow you to respond promptly to deviations from the budget. Quarterly reports suit strategic reviews and reporting to investors. Annual financial statements are a legally required document that brings together the results for the whole year.
The deadlines are not optional. Under the accounting requirements in Lithuania, annual financial statements must be prepared and approved within 4 months of the end of the financial year, and the approved set must be submitted to the Centre of Registers within 3 days of approval. In addition, Lithuanian law requires primary accounting documents to be kept for a set period.
Managing this cycle manually in Excel spreadsheets often means the CFO spends more time collecting data than analysing it. Automated solutions that connect accounting systems to Power BI let data refresh without manual exports, bring various files together into a single overview, and show KPIs in real time instead of in month-end reports.
When it is worth hiring an outsourced CFO or commissioning a consultation
When the in-house accounting function handles the statutory requirements but no longer answers strategic questions, that is the first sign you need an outside perspective. Other signs: cash flow forecasts are consistently inaccurate, the budget is drawn up by guesswork, or the manager makes decisions without a clear indicator to back them up.
Outsourced finance director services usually cover not only report preparation but also strategic budgeting, cash flow control and in-depth ratio analysis that identifies inefficient areas which inevitably go unnoticed in standard bookkeeping.
Before your first meeting with a consultant, it is useful to have clear questions ready about currency price forecasting methods:
- Which set of reports will you provide, and how often?
- How will you assess our cash flow risk over the next 6–12 months?
- Do you work with automated solutions, or do you prepare reports manually?
- What is your working model: a fixed monthly fee or a project rate?
Service models differ. Some CFOs work for a fixed monthly fee, becoming part of the company’s processes for the long term. Others offer project work, such as a one-off budget review or the preparation of annual financial statements.
Analitika360: automated Power BI reports for CFO needs
Technology without financial expertise rarely delivers real value. In practice, implementing CFO analytics only pays off when the Power BI setup is designed around the finance lead’s knowledge of which indicators need tracking, not the other way round.
Analitika360 closes this gap by integrating data directly from the Rivilė and Finvalda accounting programs and also combining it with Excel and SharePoint sources. The reports refresh automatically, with no further input from the user.
Restaurant chains, leasing companies and financial services firms use such solutions to see revenue, costs, profit and sales trends in real time, instead of waiting for the month-end summary from the accounts department.
The concrete value for managers is time saved and faster decisions:
- the CFO overview updates automatically, with no need to move data manually from Rivilė or Finvalda;
- for restaurant chains, the specific indicators that matter (e.g. turnover per waiter, kitchen cost percentage) are visible in one place;
- tailored solutions for leasing companies make it possible to track debt repayment trends without a separate Excel model.
Budgeting and budget control
A budget without a control mechanism is just a document in a drawer. The real value of a CFO report emerges when actual results are regularly compared with the plan and variances are analysed straight away, not at the end of the year.
The budgeting process usually starts from the previous year’s actual figures, adjusted for known changes: new products, price changes, planned growth or contraction. The most effective budgets are broken down not only by month but also by department or product line, so that any variance can be clearly attributed to a specific area rather than to the ‘company result’ in general.
Control means regularly calculating variances: the actual result minus the plan, expressed both as an absolute figure and as a percentage. It is important to distinguish a structural variance (e.g. raw materials that keep getting more expensive) from a one-off (e.g. a single large purchase that will not recur).

Automated reports speed this process up because actual data from the accounting system is automatically compared with planned figures in the dashboard, with no separate Excel file to be updated by hand every month.
How to interpret CFO reports properly for business decisions
A report that sits unread has no value, however accurately it has been prepared. Interpretation starts not with the details but with a question: what does this figure mean for our next decision?
The first step is to bring the three statements together into one picture. The profit and loss statement may show growth, but if the cash flow statement shows a shrinking balance, the cause often lies in the balance sheet, for example in rising receivables or excess inventory. A manager who looks at only one document misses this connection.
The second step is to put the figure in context. The third step is to separate the signal from the noise. A single month with a weaker result is often seasonality, not a trend. Three months in a row is a pattern that calls for a decision.
A practical example: if the cash flow statement shows the company is increasingly relying on its credit line to cover day-to-day expenses, that is a signal to review the collection terms for receivables, not just to ask for a higher credit limit. A decision based on the full set of statements is more accurate than one based on a single figure.
Good practice and common mistakes in preparing CFO reports
Good practice starts with consistency. Reports must be prepared using the same methodology in every period so that comparisons over time are valid. If costs are assigned to one category one month and to another the next, trend analysis becomes unreliable.
The second good practice is using comparative data. Every report should show not only the current period but also the corresponding period of the previous year alongside it. The third is a qualitative comment on every significant figure. A figure without an explanation leaves the manager guessing at the cause.
The most common mistakes, worth naming plainly:
- confusing cash flow with profit: managers make decisions based on the profit and loss statement, ignoring the fact that the bank account is actually short of funds;
- late reports: when the data reaches the manager weeks after the end of the period, decisions are made on an already outdated basis;
- over-detailed dashboards: dozens of indicators in a single report do not help; they drown out the most important signals;
- manual entry errors: Excel formulas pulled together from a dozen or more files often contain hidden discrepancies that only surface several months later.
Automated systems reduce the risk of the last mistake because the data flows directly from the accounting program, with no manual copying between files.
Pricing models for CFO reporting and automation services
Pricing for CFO services differs depending on whether you are talking about a human service or a technology solution. An outsourced CFO on a fixed monthly fee usually costs more than an automated reporting platform, because the price includes ongoing strategic advice, not just report generation.
The project model (e.g. a one-off review of annual financial statements or drawing up a budget) usually costs a fixed sum, depending on the scope of work and the complexity of the company. This model suits companies that need periodic help rather than ongoing involvement.
Pricing for automated Power BI solutions is usually subscription-based: a monthly fee for the chosen report package, which varies with the number of data sources integrated and the complexity of the reports. Over the long term this model is often cheaper than an outsourced CFO’s fixed fee, because the technology works without additional hours being charged every month. Bespoke projects, such as dashboards tailored to a specific industry, are priced separately according to the scope of integration.
Why automating CFO reports matters more than it seems
Most managers see CFO reports as a legal obligation rather than a management tool. That is a mistake, as the analysis in this article clearly shows: the set you are required to file with the Centre of Registers and the set that genuinely helps you make decisions can be one and the same, if the reports are prepared correctly and on time.
Conventional advice tends to focus on form (the correct balance sheet structure, meeting deadlines) rather than on substance: what the figures actually say about the health of the business. That is the wrong order of priorities. A deadline missed through delay is an administrative problem. A falling margin spotted three months later than it should have been is a strategic problem.
Readers who want real value from CFO reports should invest first in the speed of their data, not in the format of their reports. An automated Power BI system that connects Rivilė or Finvalda to a real-time dashboard delivers more value than a perfectly formatted Excel spreadsheet that arrives a month late. Technology alone will not solve everything, and you still need financial judgement to interpret the figures, but speed in itself is a competitive advantage that most companies underestimate.
— Analitika360
How to get started with automated CFO reports
The report types, KPIs and legal deadlines discussed in this article share one common denominator: the faster the data reaches the manager, the faster a decision is made. Analitika360 solves exactly this problem by integrating Rivilė and Finvalda with Power BI, with no manual data transfer and no waiting for month-end.
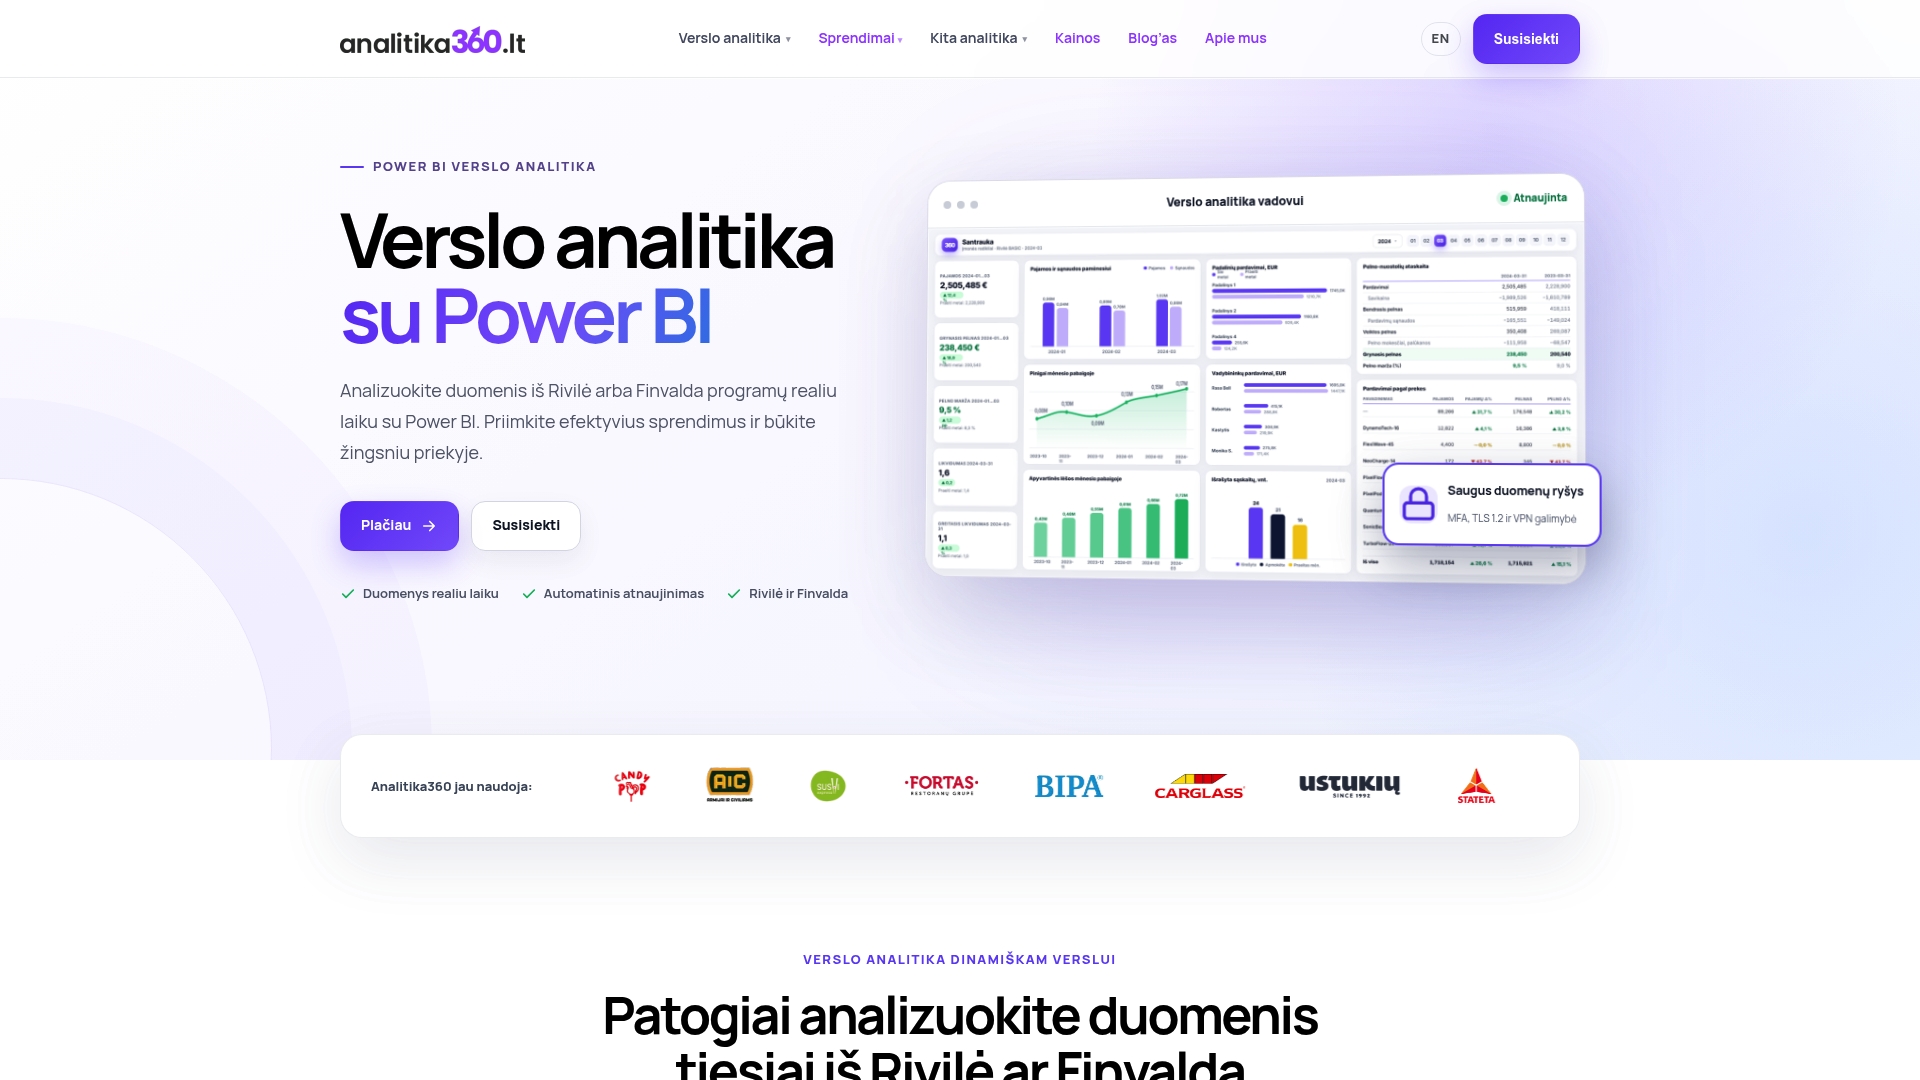
Unlike the fixed monthly fee for an outsourced CFO, here you pay for an automated system that runs without additional hours each period. You can start with the Power BI Analitika Finvalda Basic package, designed for companies just moving from manual Excel reports to an automated overview. Restaurant chains, leasing companies and financial services firms are offered solutions tailored to their sector, which take into account the specific indicators of each industry.
If you would like to see what a real CFO overview looks like without using your own data, have a look at the Power BI report examples and get in touch with Analitika360 to discuss which package suits the size of your company.
Sources
For more information, see Lithuanian legislation, the MyTax accounting guide and the Power BI CFO documentation.
- Lithuanian legislation / company financial reporting requirements
- Accounting requirements in Lithuania (MyTax)
- Expert advice: when is it worth a business hiring an outsourced finance director?