
Construction Cost Control: Practical Guidance for Project Managers

The most effective construction cost control rests on a rigorous budget plan, real-time data integration and regular variance analysis. Cost control means active budget planning, continuous monitoring and comparing actual figures against the plan, not simply a report written up at month end. What works best is a combination: a rigorous budget, regular reporting, data integration from accounting software into a business intelligence system and, where it makes economic sense, 5D BIM modelling.
In brief:
- The budget must be thorough and detailed before work begins, including a contingency reserve.
- Continuous tracking of actual spending and regular reporting help spot cost overruns and discrepancies early.
- Automatic data integration and daily refreshes ensure accurate, timely information on project finances.
- The construction cost element price index (SSKI) lets you compare market movements with project estimates and adjust plans.
- The 5D BIM method shows cost and schedule variances in real time, reducing risk and excess costs.
Contents
- Core cost control methods and practical steps
- How to organise budgeting, monitoring and reporting
- Data sources and tools: how to integrate them with accounting
- KPIs and metrics: what to track daily
- BIM and 5D in practice for cost control
- The most common mistakes and how to avoid them
- Author’s perspective: how automation is changing cost management
- How Analitika360 can help manage construction costs
- Sources
- FAQ
Core cost control methods and practical steps
Cost control starts before the first spade goes into the ground. A project manager who waits until the invoices start piling up has already lost half the battle.
- Draw up a two-stage budget. A preliminary budget is prepared at the concept stage; a detailed budget with unit rates and quantity take-offs is prepared before work starts, with a contingency reserve set aside on top.
- Establish a regular reconciliation rhythm. Weekly or monthly reports compare actual spending with the plan by cost element, not just as a single overall total.
- Apply a consistent control cycle. Planning, executing, measuring variances and adjusting the budget is a recurring process, not a one-off exercise at the start of the project.
- Get subcontractor contracts in order. Contracts must contain clear clauses on changes to the scope of work and how they are priced; otherwise every additional job becomes a subject of negotiation mid-project.
These four steps form the foundation on which everything else rests: reports, KPIs and technology only work when the budget structure is sound from the very beginning.
How to organise budgeting, monitoring and reporting
The process only works when every participant knows their role. The project manager is responsible for overall budget delivery, the quantity surveyor tracks changes in quantities, and the finance lead handles payments and checks that invoices match the contracts.
In practice, the most useful documents and report templates are:
- A monthly profit and loss (P&L) statement for the specific project, separating labour, materials and equipment costs.
- A cost breakdown by cost element, showing which area of construction is running over plan.
- Earned value (EVM) metrics, showing whether the project is behind on both schedule and budget at once, or on only one of them.
- A variance report with specific explanations of why the actual figure differs from the planned one.
The data refresh rhythm must be set in advance: daily timesheets, goods received notes for materials and incoming invoices are entered on the same or the next working day. A typical review cycle looks like this: a daily timesheet review, a weekly financial summary for the site manager and a monthly consolidated report for company management.
Data sources and tools: how to integrate them with accounting
Cost control without accurate data sources is just a set of assumptions. The main data flows on a construction project are:
- Accounting systems such as Rivilė or Finvalda, where invoices, payments and contracts are recorded.
- Time-tracking data on hours worked by employees and subcontractors.
- Supplier invoices and goods received notes confirming the actual quantities delivered to site.
- Plant and machinery operating time sheets, often forgotten but significant in the overall cost structure.
Business intelligence solutions such as Power BI, together with report packages built for it, combine these sources into a single model and automate the refreshing of metrics, so the project manager does not have to pull figures together by hand from different files. For field work, timesheet and field-operations management apps that send data straight to the central system are useful.
The technical integration step usually looks like this: data is exported via an API or in CSV format, processed through an ETL process and loaded into a unified data model from which reports are generated.
Pro tip: Set up automatic data refreshes at least once a day; otherwise your variance reports will show an out-of-date picture just when decisions need to be made.
KPIs and metrics: what to track daily
Not all metrics are equally important. Priority should go to these KPIs:
- the percentage difference between planned and actual costs by cost element,
- the split of spending between labour, materials and equipment,
- schedule variance in days,
- the earned value indicators CPI and SPI, which show cost and schedule performance at the same time.
The construction cost element price index (SSKI) is useful as an external control input: it lets you check whether price changes on a project reflect the market trend or point to an internal problem. The SSKI is calculated from statistical data using the Laspeyres formula, and it can be used to adjust initial estimates and price forecasts at later stages of the project.
In 2022 Lithuanian construction companies carried out work worth around €4.7 billion, 4.8% more than in 2021 (Official Statistics Portal). This growth shows why an external price index is becoming more important: in a rising market, static figures from old estimates quickly lose their accuracy. In practice, the most useful tools are an automated cost summary with variance alerts and a KPI dashboard that can be filtered by project and contractor.
BIM and 5D in practice for cost control
5D BIM brings quantities, schedule and budget together in a single model, so the variance between plan and actual is visible practically in real time, not a month later when the books are closed. Applying BIM methodology reduces process risks and improves data exchange between project participants, and quantitative criteria such as the difference between planned and actual costs are regarded as the main basis for assessing BIM effectiveness.
Investment in BIM makes economic sense primarily on large-scale projects or those with many changes. On smaller projects the decision should be assessed on a return-on-investment basis, not taken automatically.
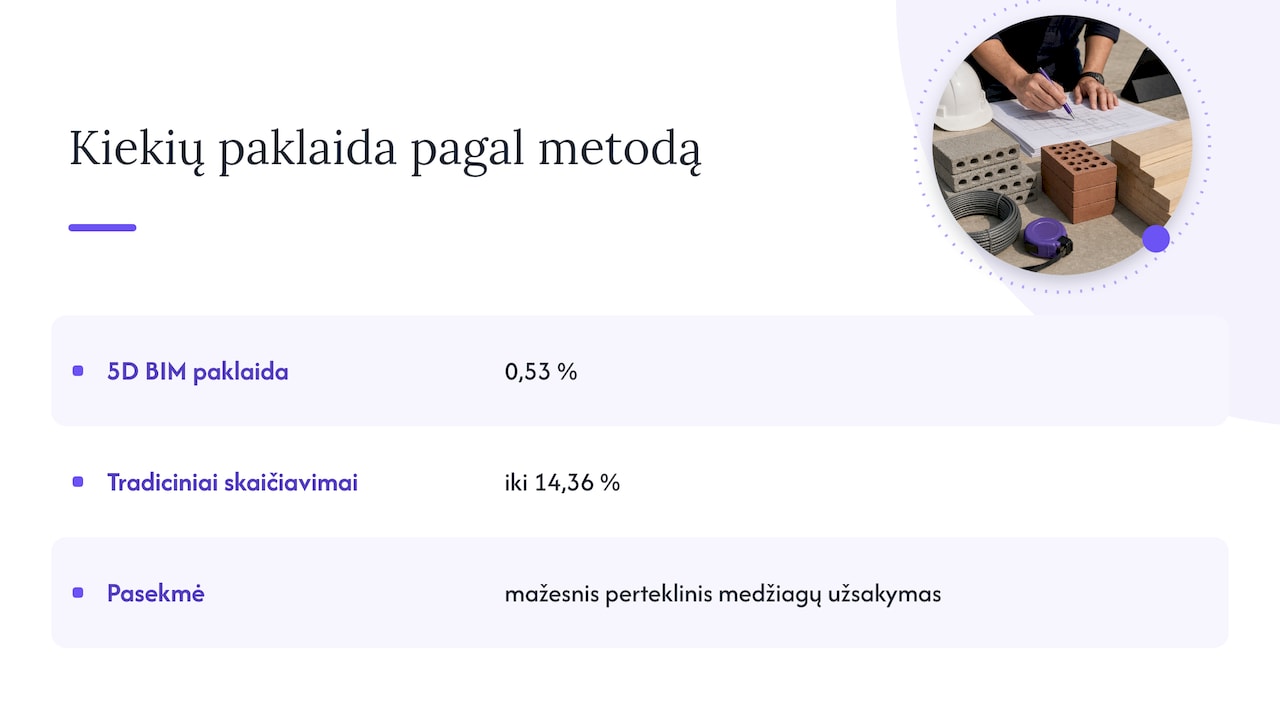
The concrete benefit is clear from a case study: quantities generated from the BIM model showed an error of around 0.53%, while traditional calculations from technical design documents showed up to 14.36% greater error than the actual values (case study). The difference has a direct impact on order volumes: more accurate quantities mean less over-ordering of materials and fewer unforeseen additional costs.
The most common mistakes and how to avoid them
Most cost overruns stem not from one big mistake but from a handful of recurring systemic problems.
- Inaccurate quantity take-offs caused by poor-quality technical designs. Solution: invest in checking technical documents and, where possible, verifying quantities against BIM.
- Manual data entry and delays between site and office. Solution: automate exports and ETL processes so data flows without an extra step.
- Unclear contract terms on changes to the work. Solution: standardise the change procedure and pricing formula at the point the contract is signed.
- Insufficient reporting discipline. Solution: set clear responsibilities and frequencies, and send variance alerts automatically rather than relying on memory.
Pro tip: Assign every change order a responsible person and a deadline by which it must be reflected in the budget; otherwise changes pile up without being included in the overall total.
Author’s perspective: how automation is changing cost management
The biggest mistake project managers make when thinking about cost control is assuming it is primarily a matter of discipline. In reality it is usually a matter of infrastructure: when data from accounting and the field is gathered by hand, even the most disciplined team spots a variance too late. Automated reports that refresh without any extra intervention change this dynamic, because a variance becomes visible on the same day it arises, not the following month in the financial summary.
— Analitika360
How Analitika360 can help manage construction costs
Construction companies working with Rivilė or Finvalda already hold all the data they need for tighter cost control, but that data often reaches decision-makers too late, or in spreadsheets that have to be stitched together by hand. You can buy ready-built Power BI report packages that automatically refresh revenue, cost and profit metrics, combining accounting data with field or SharePoint information in a single dashboard.
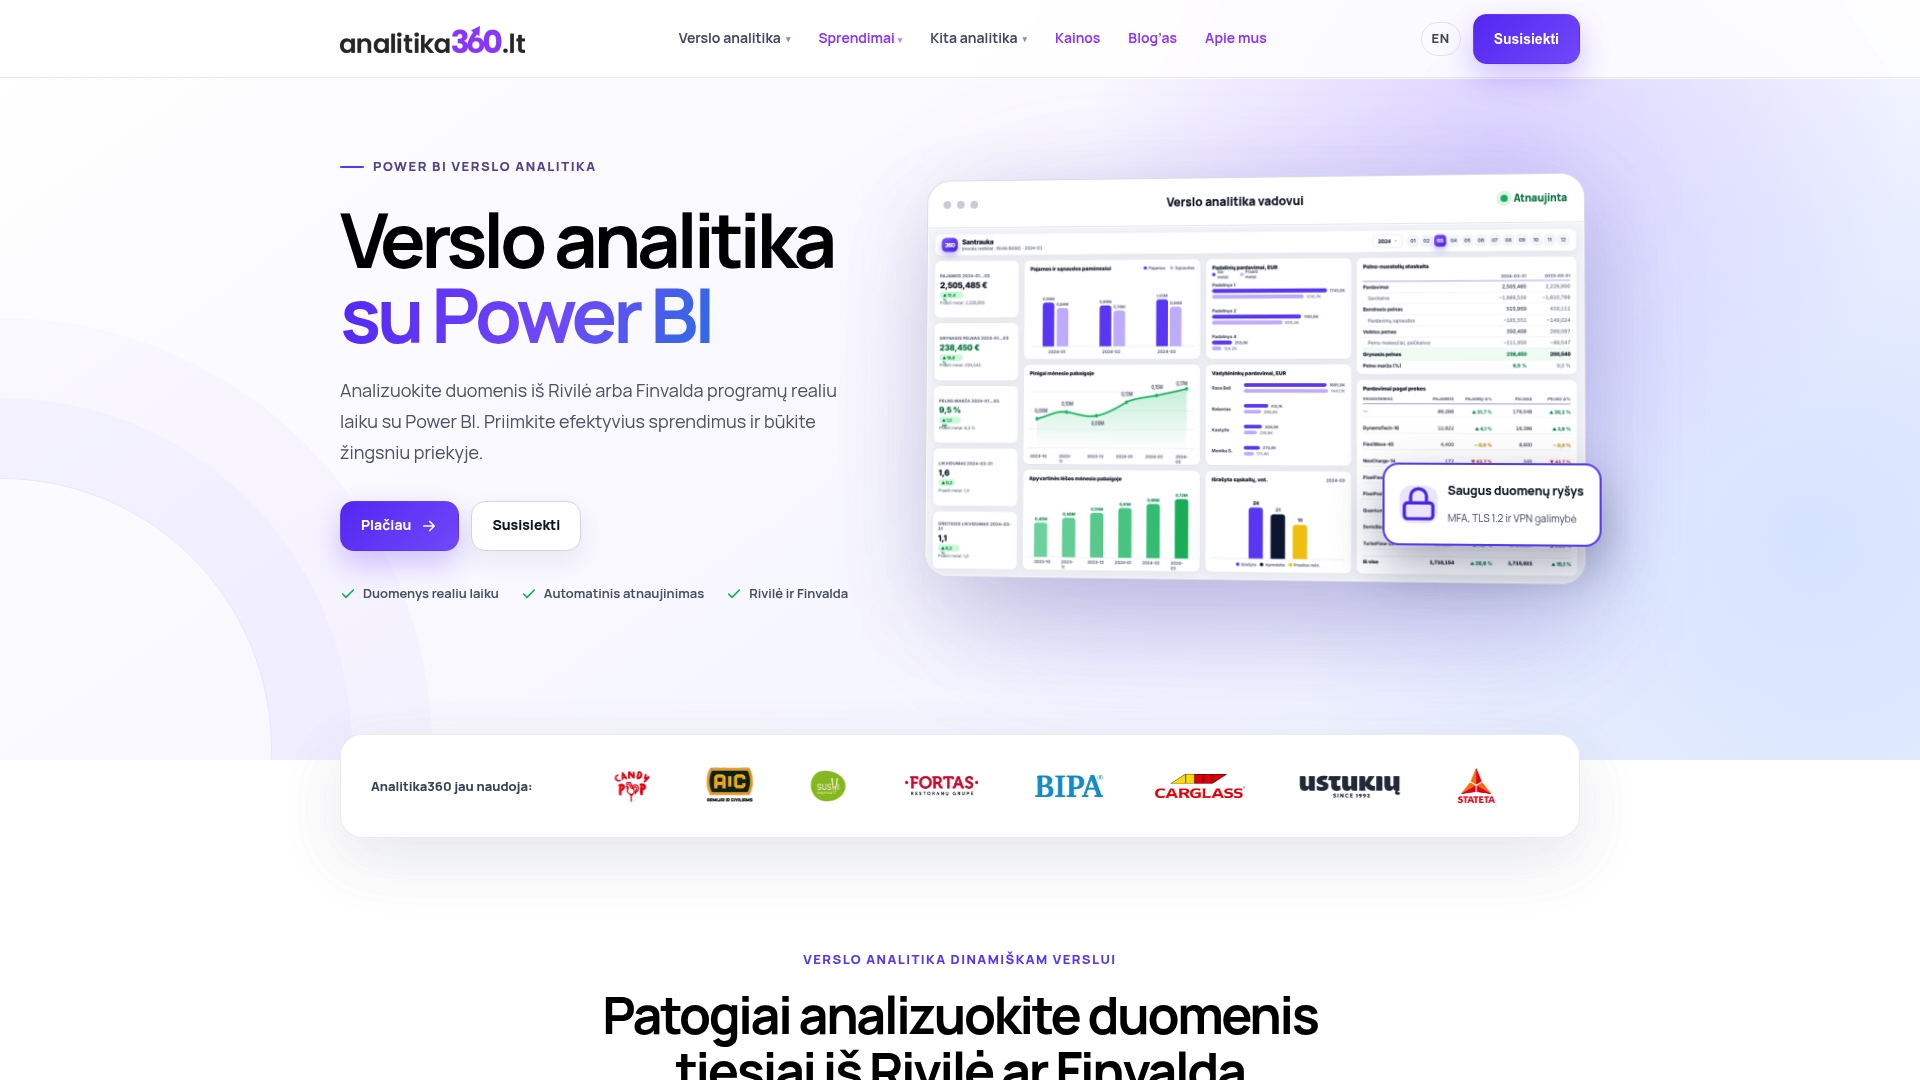
In practice it works like this:
- You choose a package to match your accounting system: Rivilė Basic or Finvalda Basic for those who need the essential reports, and PRO versions for broader analysis.
- For more complex needs, such as combining several sources or tailoring reports to specific construction processes, bespoke solutions are available.
- Implementation starts with a short conversation about your current system and ends with a demonstration of the reports before full launch.
You will find prices and terms for bespoke projects on the pricing page, where you can also get in touch about an initial consultation.
Sources
FAQ
What is construction cost control and why is it needed?
Construction cost control is an ongoing process of planning, monitoring and adjusting project spending by comparing actual costs with the budget. Its aim is to spot variances in good time and take action before they turn into major financial losses.
How is the SSKI used in monitoring construction costs?
The construction cost element price index shows how the market prices of work and materials are changing, and is used as an external control input when assessing whether price changes on a project are in line with the general trend. In 2022 the value of construction work in Lithuania reached around €4.7 billion, which illustrates how quickly market price levels can shift, and these need to be compared with your own project estimates.
Is 5D BIM worth implementing on smaller construction projects?
Not always. The decision should be based on a return-on-investment assessment, as the cost of implementing BIM must be recovered through fewer errors and less over-ordering. On large-scale projects or those with many changes the benefit is usually clearer; on small projects it needs to be calculated case by case.
What are the most common mistakes that lead to construction cost overruns?
The most common mistakes are inaccurate quantity take-offs caused by poor technical designs, manual data entry between site and office, and unclear contract terms on changes to the work. These problems are addressed by checking technical documents, automating data exports and including a standardised pricing formula for changes in contracts.
How does data from Rivilė or Finvalda help control costs?
Rivilė and Finvalda store data on invoices, payments and contracts which, when combined with business intelligence reports, give a real-time view of revenue, cost and profit metrics. Analitika360 offers ready-built Power BI packages for these systems that refresh the metrics automatically, with no extra manual work.