
Labour Cost Analysis: A Method for Finance Professionals

Labour cost analysis means converting every expense an employer incurs for an employee into a comparable metric, most often the cost per hour worked, so that decisions rest on figures rather than gut feeling. The result is a concrete number you can compare across departments, periods or against the sector average. Below is a method you can apply this month, using data from Rivilė or Finvalda.
In brief:
- Labour cost analysis lets you pin down the cost of one hour worked and compare it across departments, periods or sector averages.
- A sound analysis must include every labour cost line, including social insurance, pension, training and compensation costs, taking account of the tax changes from 2026.
- The cost per hour is calculated by dividing total labour costs by the hours actually worked, adjusted for sickness absence and seasonal swings.
- For efficient data collection and analysis, accounting software and automatically refreshed Power BI reports are recommended, as they save time and allow continuous monitoring of the figures.
- Changes to the minimum wage can indirectly affect the cost of the entire pay structure, so it is important to run a scenario analysis before implementing any change.
Contents
- Labour cost components: what exactly goes into the accounts
- Calculating the cost per hour worked: formula and example
- Cost centres and data sources: a practical data model
- Analysis methods and KPIs: which indicators to track
- Optimisation measures: what to do after the analysis
- Practical implementation: integration and automated reports
- Examples of studies and reports with practical data
- Clear definitions and examples of labour cost categories
- The aims of labour cost analysis and why it matters to the business
- The labour cost analysis process step by step
- Labour cost forecasting and budgeting
- An overview of labour cost analysis software and tools
- Publisher’s practical note: where to start today
- What Analitika360 offers: report packages and a demo invitation
- FAQ
Labour cost components: what exactly goes into the accounts
Accurate labour cost analysis starts with the right matrix of cost lines. Most companies count only gross pay and lose sight of the real picture, because the employer’s obligations go well beyond the salary line alone.
- Gross pay together with allowances, bonuses and benefits in kind.
- Employer social insurance contributions, including the VSD (state social insurance) and PSD (compulsory health insurance) portions.
- Pension contributions, where the employer takes part in a pension savings scheme.
- Training, business travel and work equipment costs directly attributable to a specific employee.
- Holiday pay and sickness benefit, which are actually paid without corresponding working time.
The most common mistake is adding up these lines without taking the tax effect into account, for example forgetting that from 2026 the tax treatment of supplementary health insurance contributions changes, which directly alters how benefits in kind are calculated. Another frequent mistake is counting the costs of people working under civil-law (service) contracts as labour costs, even though they belong to a different accounting category and distort comparability between periods.
Calculating the cost per hour worked: formula and example
The cost per hour worked is calculated by dividing the employer’s total expenses for the period by the hours actually worked, adjusted for sickness absence and holidays. This metric removes the distortions caused by differing headcounts or working patterns, and it is the recommended basis for comparison between departments.
- Add up all labour cost lines for the chosen period, for example a quarter.
- From your time records, extract the hours actually worked, excluding hours that were paid but not worked.
- Divide the total by the number of hours worked to arrive at the cost per hour.
- Compare the result with the previous period and the sector average.
Statistics: The Official Statistics Portal recommends calculating labour costs per hour worked, based on a quarterly sample survey and data from Sodra, the State Social Insurance Fund, which allows results to be compared reliably between periods.
Suppose a café incurs a certain total labour cost over a quarter, and its staff actually work a certain number of hours. The cost per hour is then obtained by dividing the total costs by the number of hours. For seasonal businesses, it is advisable to calculate over a period of at least twelve months or to adjust the result for seasonality, so that the summer or holiday peak does not distort the annual average.
Cost centres and data sources: a practical data model
Before the analysis, you need to gather data from four sources and group it into cost centres that reflect the structure of your business.
- The accounting software (Rivilė or Finvalda) provides data on salaries, taxes and allowances.
- The time and attendance system records the hours actually worked by each employee.
- Sodra reports confirm the insurance contribution amounts and allow a cross-check.
- Official statistics provide sector averages for comparison.
Cost centres are most often set up by department, project or product: a restaurant chain, for example, might create a centre for each outlet, while a manufacturer might do so by production line. For data quality, it is important to check regularly whether the amounts in Sodra reports match the entries in the accounting software. Discrepancies often arise from late adjustments or wrongly allocated payments, and this kind of cross-check is also explained in a commentary by the State Tax Inspectorate (VMI) on the boundary between employment and self-employment. How often the data is refreshed depends on the size of the business: a quarterly cycle is enough for small companies, while a monthly one is recommended for larger firms with several departments.
Analysis methods and KPIs: which indicators to track
Once the data model is in order, you need a clear set of indicators that lets you follow trends rather than merely record a single number.
- Cost per hour worked, calculated separately for each cost centre.
- Cost structure shares in percentages, showing how much is accounted for by pay, taxes and additional benefits.
- Revenue per hour worked and profitability per hour, which show whether labour costs pay for themselves.
- Variance analysis, comparing the company’s indicators with the sector average or the previous period.
- Segmentation by type of activity, where different functions have a different cost profile.
Expert tip: Before making a decision on the pay structure, always run a simulation of a minimum monthly wage change across the whole workforce, because an increase at the bottom level often triggers a knock-on effect throughout the hierarchy.
An analysis by the Bank of Lithuania notes that changes in the minimum monthly wage affect labour costs not only directly but also indirectly, through pressure on the entire pay structure. That is why scenario analysis is one of the most important tools whenever any change to pay policy is being considered.
Optimisation measures: what to do after the analysis
Once you have reliable indicators, optimisation starts with processes, not with pay cuts.
- Review the processes that take up the most staff hours and assess what can be automated.
- Review the pay structure, checking whether the bonus system reflects actual productivity.
- Analyse additional benefits and their tax effect, as some benefits have become less advantageous since the change in tax treatment from 2026.
- Decide whether the situation calls for a restructuring of staff, or whether investment in raising productivity will deliver a better result over the longer term.
- Assess the impact of each change on the profit and loss statement, together with its tax effect, before making a final decision.
Restructuring is often chosen too hastily, because there is not enough data on which team or cost centre actually drives profitability. Modelling scenarios before the decision helps avoid costly mistakes.
Practical implementation: integration and automated reports
Labour cost analysis often begins with integrating data directly from the accounting software, without any extra manual exporting.
- Integration requires payroll, tax and working time data, extracted directly from the accounting software.
- Power BI reports combine this data with other sources so that you see a single overall picture.
- Automated refresh means the finance manager gets new figures without extra manual work as soon as new entries appear in the accounting software.
- Such a solution saves the time that previously had to be spent on a manual monthly summary.
Automated reports let you track labour costs quickly, instead of waiting every month for manual reports from the accounts department.
Examples of studies and reports with practical data
In labour cost analysis it pays to draw on publicly available reports, which show trends more broadly than a single company’s data. The Official Statistics Portal publishes methodological information on labour costs and cost per hour worked, based on a quarterly sample survey. This allows a finance professional to compare their company’s figures with the national average without relying on random sources.
The Bank of Lithuania’s economic review presents changes in pay and labour costs by sector and region, which matter when interpreting results. For example, if costs in your sector are rising faster than in others, this may mean the market is exerting pressure that an internal analysis on its own would not reveal.
In practice it looks like this: each quarter the finance manager compares the company’s cost per hour with the sector average, records the deviation and, if it is larger than usual, looks for the specific source, whether it is growth in bonuses, a tax change or a shift in the staff structure. Such a comparison is far more precise than simply following your own internal trend in isolation, because the market context shows whether a change is general or specific to your company.
Clear definitions and examples of labour cost categories
Clear categorisation means that every cost line has a clear definition and allocation rule that another professional can check without further explanation.
Direct labour costs comprise gross pay and all mandatory employer taxes directly linked to a specific employee. Indirect costs cover training, work equipment and administrative personnel management that cannot be attributed to any one employee but are nonetheless part of labour costs.
Variable costs change with the time worked, for example overtime or shift allowances. Fixed costs do not change regardless of the hours worked, for example the base salary under the contract. This distinction matters for forecasting: variable costs respond to the season, fixed costs do not.
An example: a restaurant might employ a chef on a fixed monthly salary and a waiter on an hourly rate with shift allowances. The former’s costs are calculated from the agreed monthly amount plus taxes, the latter’s from the hours actually worked plus allowances. If these two categories are added together on a single line without being separated, the analysis loses the ability to show which group of employees is most sensitive to seasonal swings.
The aims of labour cost analysis and why it matters to the business
The main aim of the analysis is not to cut costs as such, but to understand where they deliver a return and where they do not. A company that knows its cost per hour in each department can make pricing decisions on a more accurate basis than a competitor relying solely on a total annual figure.
The second aim is risk management. When you know how a change in pay policy will affect the whole structure, you can assess the budget impact in advance rather than react after the event, once the bills have already arrived.
The third aim is comparability. The cost per hour makes it possible to compare departments with different headcounts or working patterns, which simply cannot be done on the basis of the total payroll. This is especially important for companies with several departments or branches, where management needs to see which unit uses its workforce most efficiently.
Finally, accurate labour cost analysis is the foundation for strategic decisions: opening a new unit, expanding the workforce or investing in automation. Without this metric, decisions are often made on instinct rather than figures, which in the long run costs more than the analysis itself.
The labour cost analysis process step by step
The process starts with data collection and ends with a decision, and the intermediate steps ensure that the result is reliable.
The first step is collecting data from the accounting software, the time and attendance records and Sodra reports. The second step is data cleansing: checking whether the amounts match across sources and resolving any discrepancies. The third step is categorisation by the cost centres described in the earlier section.
The fourth step is calculating the cost per hour separately for each cost centre, using the formula given at the start of this article. The fifth step is comparison: with the previous period, with the sector average and with the budget. The sixth step is drawing conclusions: which departments or categories need attention, and why.
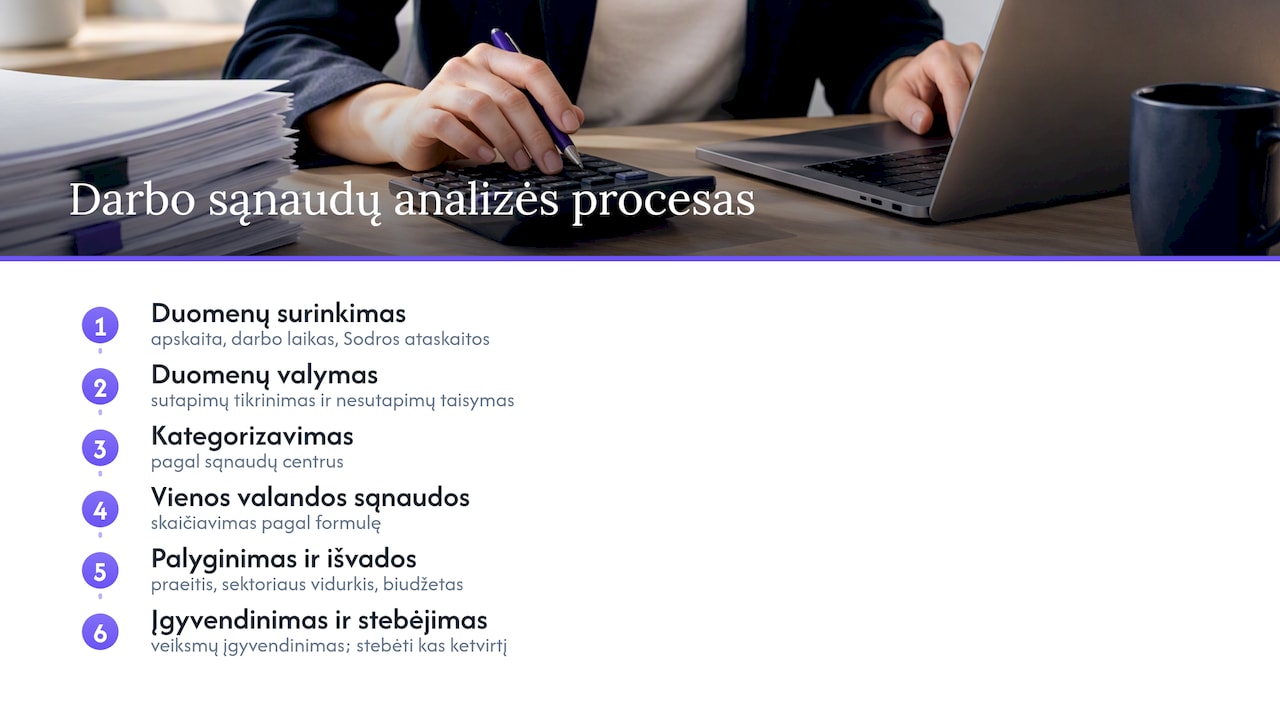
The seventh and final step is implementing the decision and monitoring the result. If you decide to revise the bonus system, the next cycle should show whether the change has had the desired effect. The process is repeated periodically, usually every quarter, so that the analysis does not remain a one-off exercise but becomes an ongoing management tool.
Labour cost forecasting and budgeting
Forecasting relies on the same lines used for the actual analysis, simply projected forward with clear assumptions. The key assumption is the change in headcount: whether you are planning expansion or a stable staffing level.
The second assumption is pay indexation, which must take into account possible changes to the minimum monthly wage. As mentioned in the earlier section on KPIs, such changes affect not only the lowest pay level but the whole hierarchy, so the budget must include not just the direct but also the indirect effect.
The third assumption is changes in tax rules, for example the changes to the taxation of supplementary health insurance that apply from 2026. Such changes must be built into the budget before they take effect, so that no unexpected budget gap arises.
A practical budgeting method is a scenario table: a base scenario with the current structure, an optimistic one with lower staff growth and a pessimistic one with greater tax or pay pressure. For each scenario, the cost per hour and the total annual amount are calculated, so that the board sees not a single number but a realistic range.
An overview of labour cost analysis software and tools
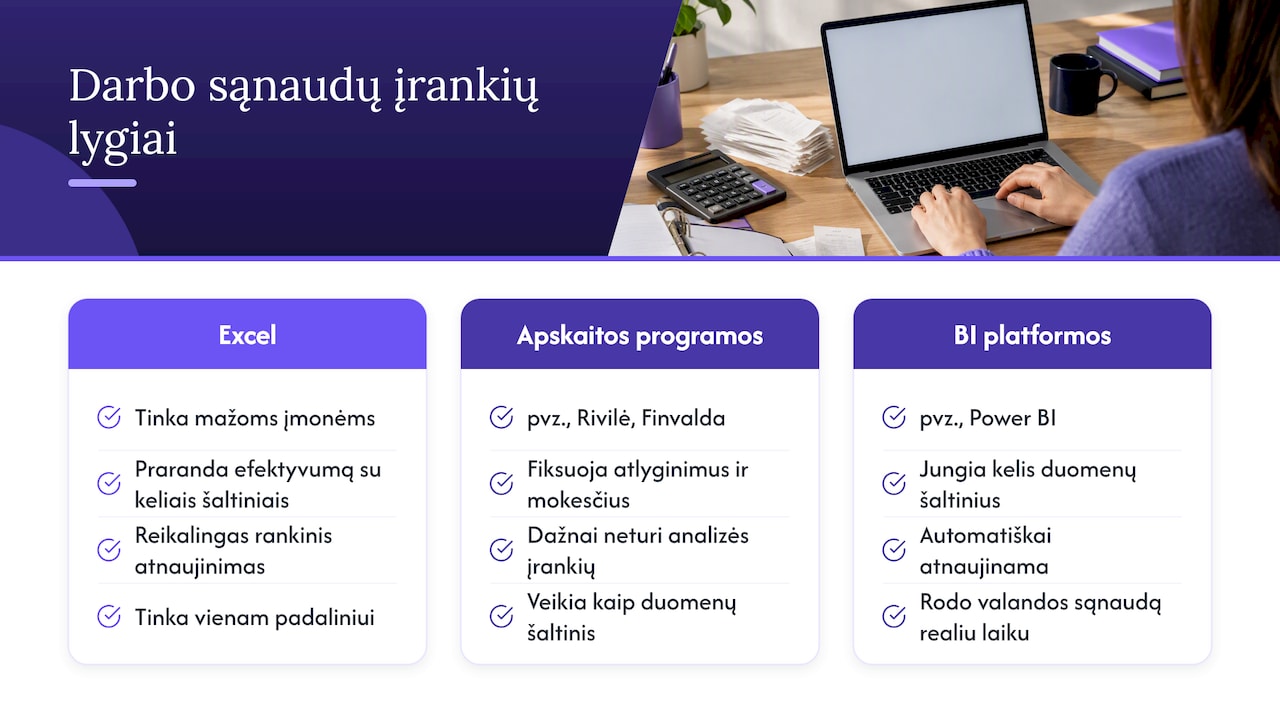
The tools used for labour cost analysis range from a simple spreadsheet to a full business analytics platform. The most basic level is Excel, which suits small companies with a single department but quickly loses efficiency when several data sources need combining or reports have to be updated manually every month.
The next level is accounting software such as Rivilė or Finvalda, which already records payroll and tax data but usually lacks tools for analysis or for comparison between periods. These programs are a data source, not an analytics platform.
The third level is business analytics platforms such as Power BI, which combine data from the accounting software, time and attendance records and other sources into a single model that refreshes automatically without manual intervention. Such a platform lets you see the cost per hour in real time, rather than once a quarter after manual data entry.
When choosing a tool, it is also worth considering the wider market for financial ratio analysis: a review of financial ratio tools for investors shows that the choice of analytics tool depends on how much automation and integration a particular business model requires.
Publisher’s practical note: where to start today
First, check whether the data in Rivilė or Finvalda matches the Sodra reports: discrepancies distort every calculation that follows. Then identify the two or three most important cost centres where labour costs account for the largest share of profit.
Calculate the cost per hour for each centre and run a simple simulation of a minimum monthly wage change to see the knock-on effect. The most common mistake we see is carrying out the analysis once and leaving it without updates: indicators only pay off when they are monitored continuously.
— Analitika360
What Analitika360 offers: report packages and a demo invitation
If you already carry out labour cost analysis manually in Excel spreadsheets, every new quarter means doing the same work all over again. Ready-built Power BI report packages are available, tailored specifically to Rivilė and Finvalda data, which refresh automatically without any extra manual input.
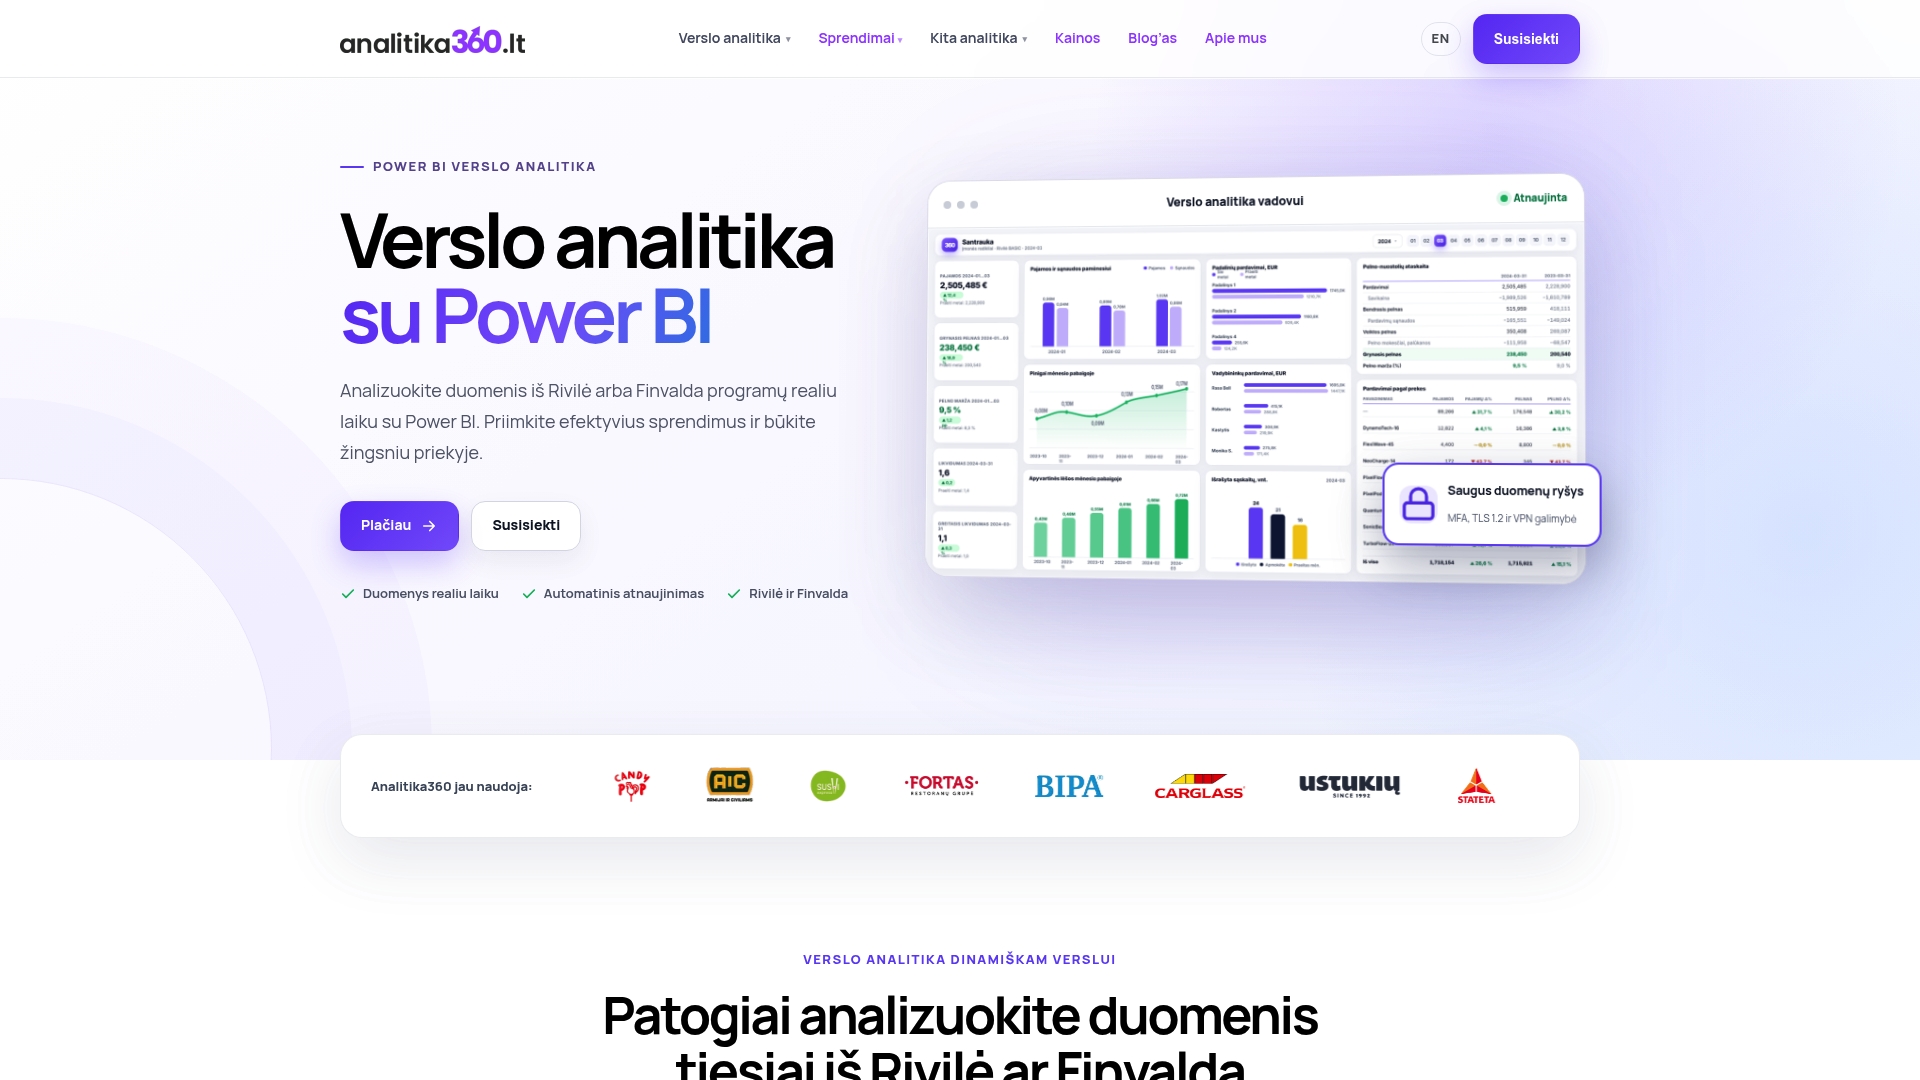
For Rivilė users, the Rivilė Basic package covers the core revenue, cost and profit reports, while Rivilė PRO adds deeper analysis. For Finvalda users, the Finvalda Basic and Finvalda PRO packages follow the same logic. For companies that need a solution tailored to their existing IT systems or processes, bespoke projects are offered at an hourly rate.
If you would like to see how this would work with your company’s data, take a look at the pricing page and get in touch to arrange a demo.
FAQ
What is labour cost analysis and what is it used for?
Labour cost analysis converts all of an employer’s expenses for an employee into a comparable metric, most often the cost per hour worked. It is used to base decisions on pricing, staff structure and budgeting on figures rather than instinct.
How do you calculate the cost per hour worked?
You divide the employer’s total labour costs for the period by the hours actually worked, adjusted for holidays and sickness absence. The Official Statistics Portal recommends basing this calculation on the quarterly sample survey and Sodra data.
What data is needed for labour cost analysis?
You need payroll and tax data from the accounting software, data on hours actually worked from the time and attendance records, and Sodra reports for cross-checking. Combining these sources into a single model lets you eliminate discrepancies and obtain an accurate result.
How does a change in the minimum monthly wage affect labour costs?
A change in the minimum wage affects not only the lowest pay level but the entire pay structure through indirect pressure. An analysis by the Bank of Lithuania notes that this effect can be significant, so it is worth simulating the scenario before making a decision.
How much does a Power BI solution for labour cost analysis cost?
The Rivilė Basic and Finvalda Basic packages start from €59 a month, and Rivilė PRO and Finvalda PRO from €89 a month. Bespoke projects are priced at an hourly rate. Current prices are listed on the official pricing page.