
Report standardisation: how to unify KPIs and automate business reporting

Report standardisation means consistent KPIs and automated Power BI reports that let managers make quick, well-founded decisions. In practice, data from accounting software such as Rivilė or Finvalda flows into a single model and refreshes automatically, with no manual data entry. Companies are adopting this model today because they want to see revenue, costs and profit in one place rather than spread across separate Excel files.
In brief:
- Standardised reports automate data collection from accounting software and refresh without human intervention, which saves time and keeps the figures current.
- Ready-made templates and KPI definitions allow different departments to speak the same language and analyse the same metrics in the same way.
- How long a project takes depends on the complexity and scope of the data sources, and a ready-made package is often cheaper and quicker to put in place than a bespoke solution.
- Successful standardisation starts with one specific report, while the team learns to manage and test the process, and with a named person taking responsibility.
- Standardisation typically covers KPI definitions, building data models, setting up automation and ongoing governance, reducing the risk of errors and improving the quality of decisions.
Contents
- What internal report standardisation is and where its limits lie
- Benefits for the business and its stakeholders
- Six steps to standardising the reporting process
- The technology components standardisation needs
- KPIs and report templates for different audiences
- Risks and controls after the system goes live
- Implementation stages from preparation to roll-out
- How to make reports clear to every stakeholder
- Time and costs worth assessing up front
- Good practice and common mistakes in report standardisation
- Adapting standardisation to different sectors
- Analitika360’s experience of implementing standardised reports
- Which Analitika360 packages meet the need for standardisation
- Sources
- FAQ
What internal report standardisation is and where its limits lie
This guide is about internal, management and operational reports, such as monthly sales summaries, profitability analysis or tracking stock movements. It is not about annual financial statements, which are governed by legislation, and the article does not go into the Lithuanian Business Accounting Standards or public-sector reporting requirements. That subject has its own rules and its own audience.
Internal standardisation means the company agrees on common metrics, the formulas used to calculate them and the format of its reports, so that different departments speak the same language. Typical sets include a sales dashboard for management, a monthly financial summary for the board and operational reports for department heads. Each set serves a different kind of decision: one shows direction, another supports control, and the third supports day-to-day work.
Benefits for the business and its stakeholders
Well-prepared reporting documents increase stakeholder confidence and make it easier to anticipate risks, as noted in a Ministry of Finance publication on making financial statements public. Companies that provide more detailed information also tend to have their financing applications viewed more favourably, because lenders have more data on which to base a decision.
Internal standardisation works on a similar principle: when a manager receives a consistent, automatically refreshed report, they no longer have to waste time reconciling data.
- Restaurant chains get a consistent view of sales and costs across all their outlets at the same time.
- Accounting firms that keep the books for several clients save time when reports are generated automatically from Rivilė or Finvalda data.
- Construction and logistics companies get a clearer view of project profitability without extra data entry.
Automated reports refresh without any further intervention from the user, which means the manager is always working with up-to-date figures, not a week-old spreadsheet.
Six steps to standardising the reporting process
A report standardisation project proceeds step by step, and skipping a step often means going back and redoing work.
- Agree the KPIs with stakeholders. Management, the finance department and department heads need to agree which metrics will be shown and how they are calculated.
- Take stock of your data sources and clean them up. Review what data sits in Rivilė, Finvalda, Excel files or SharePoint, and remove duplicates.
- Build a shared data model. The Power BI template must define the relationships between tables so that every metric is calculated in the same way.
- Set up the ETL and automation routine. Decide when and how data is imported, and test the refresh process before going live.
- Run a pilot and train users. Start with one department or one report, then expand once users trust the results.
- Put governance and support in place. Appoint a responsible person who approves KPI changes and monitors report quality.
Expert tip: Start with one set of reports that solves a specific problem for a manager, and only then extend it to other departments.
The technology components standardisation needs
A standardised reporting system has three layers: the data sources, processing (ETL), and the reporting layer, where the user sees the end result. Each layer has its own requirements and its own risks if it is missing.
- Rivilė and Finvalda supply the core accounting data: revenue, costs, the balance sheet and outstanding debts.
- Excel and SharePoint add data to the model that is not held in the accounting system, such as budgets or sales forecasts.
- Power BI combines all the sources into one model and presents the results through interactive dashboards.
- Access management, such as row-level security in Power BI, ensures that each user sees only the data that belongs to them.
If you need to work with several currencies, for example when importing supplier invoices not denominated in euros, it is worth sorting out the currency conversion logic in advance. This guide to the currency exchange workflow shows how such a process can be set up without manual recalculation every month.
KPIs and report templates for different audiences
Not every manager needs the same report. Senior management cares about direction, the finance director cares about liquidity, and the accountant cares about day-to-day data accuracy. Standardisation therefore means not a single report but a coordinated set of templates.
- Sales and conversion: total sales, and the conversion rate by channel and period.
- Profitability: EBITDA or net profit, compared with the previous period.
- Liquidity and debts: receivables and payables, and their ageing profile.
- Stock movement: inventory turnover and the quantity of unsold goods.
Every KPI must have a documented formula, data source and the period over which it is calculated. Without this description, different departments often calculate the same concept differently, which undermines the comparability that the whole standardisation process is trying to achieve.
Risks and controls after the system goes live
The most common risk is a mismatch between data sources, where Rivilė and Excel show different figures because they were imported at different times. Another risk is having too many KPIs: when a dashboard carries too many metrics, the manager loses sight of the most important ones.
Controls reduce these risks in several ways: regular data quality checks before each refresh, periodic report reviews with stakeholders, and a clearly defined steering committee that approves KPI changes. Success is worth measuring in concrete terms: how much time is saved preparing reports, how quickly decisions are made, and whether the company’s negotiating position with banks or suppliers improves.
Implementation stages from preparation to roll-out
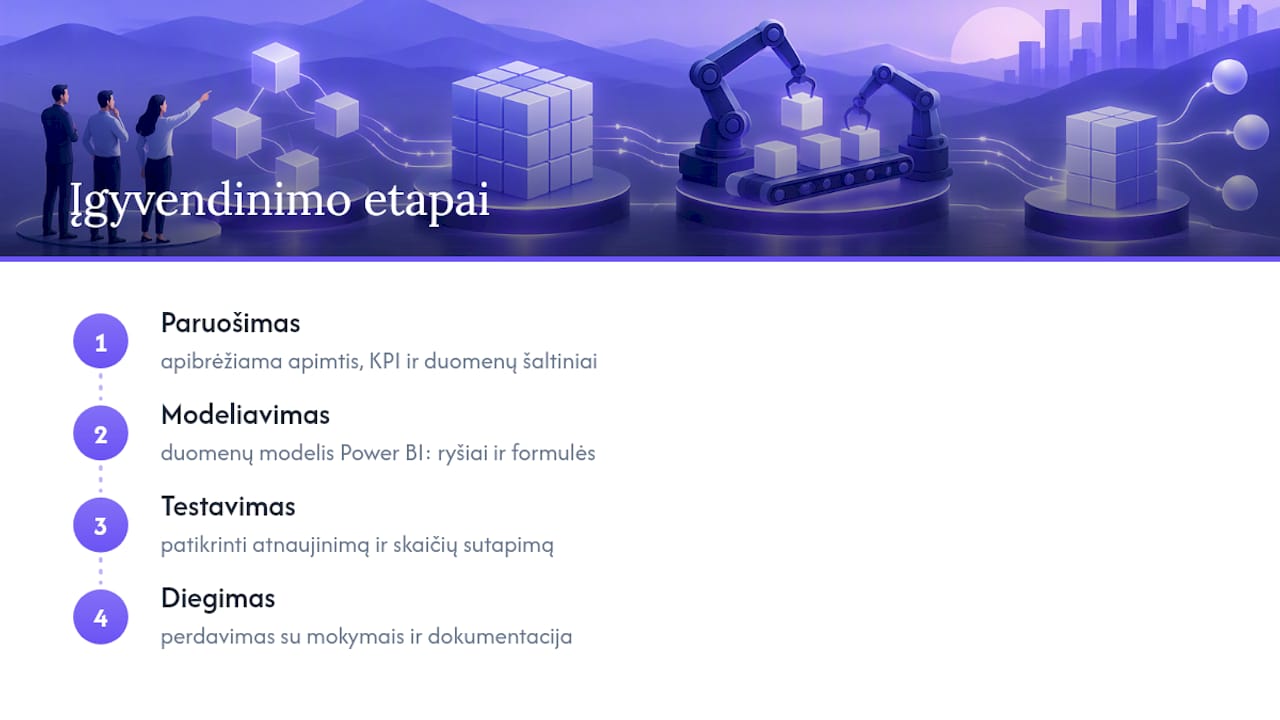
A standardisation project is usually divided into four stages, each with its own purpose.
In the preparation stage, the scope of the project is defined: which departments, which KPIs and which data sources are included first. At this stage it is important to agree who has the final say on KPI definitions, so that the discussion does not have to be reopened later.
In the modelling stage, the data model is built in Power BI: the relationships between tables, the calculation formulas and the structure of the visuals. This stage often takes the longest, because the data formats of different systems have to be aligned.
In the testing stage, you check that automatic refreshes work correctly and that the figures match the source data. It is worth testing at least one full refresh cycle before handing the system over to users, so that incorrect figures do not create mistrust.
In the roll-out stage, the system is handed over to users with training and documentation. A Kaunas University of Technology (KTU) study on the transition to IFRS shows that changes in standards do not in themselves improve report quality without proper training and adaptation of the software. The same logic applies to internal standardisation: technology without user acceptance delivers no results.
How to make reports clear to every stakeholder
A standardised report has one purpose: to let different people quickly understand the same information. This means that the managing director, the finance director and a department head looking at the same report should see the same figures, just presented at different levels of detail.
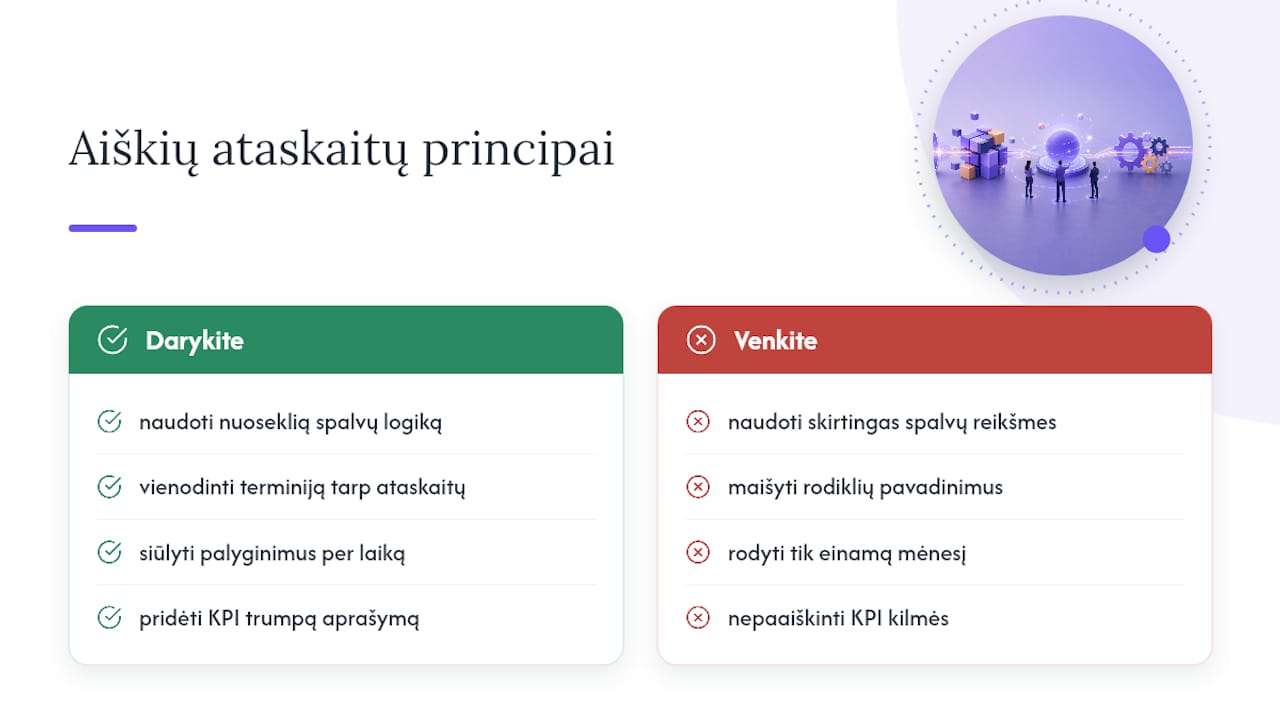
Clarity comes from a handful of practical decisions. Every dashboard should follow a consistent colour logic, for example green for a positive change and red for a negative one, applied in the same way across all reports. Terminology must be aligned too: if one report uses “profit” and another “EBITDA”, the reader cannot tell whether they are the same measure.
Comparability over time is another important aspect. A report that shows only the current month tells you less than one that immediately compares it with the previous month or the same period last year. The Business Accounting Standards set out similar comparability principles for annual financial statements, and the same logic is useful when designing internal templates, even though these are not legally regulated.
Finally, every KPI should have a short description visible in the report itself: where the data comes from, how it is calculated and how often it is refreshed. This cuts down the number of questions in meetings and keeps the discussion focused on the decision rather than on where the figures came from.
Time and costs worth assessing up front
The duration and cost of a standardisation project depend on three factors: how many data sources are connected, how many KPIs are defined and how many departments are brought in at once. A project with a single accounting source and clearly defined KPIs moves faster than one that connects several accounting systems plus additional CRM or logistics data.
The cost structure usually has three parts. First, licences: Power BI requires an appropriate Microsoft licence, the level of which depends on how many users have access to the reports. Second, integration work: combining data from different sources, which may be a ready-made package or a bespoke project, depending on how complex the company’s systems are. Third, support: maintaining the system, updating KPIs and training new users after the initial roll-out.
A ready-made package designed for a specific accounting system usually costs less and is implemented faster than a bespoke project, because the data model has already been built. A bespoke project is needed when the company has non-standard data sources or sector-specific needs that a ready-made package does not cover.
Good practice and common mistakes in report standardisation
The most successful projects start with a small, clearly defined set rather than an attempt to standardise the whole company at once. Piloting in small waves allows the model to be tested and users to be trained before the system is extended further, which reduces the risk of the transition.
The most common mistake is trying to build a single report that suits everyone: the managing director, the finance director and the accountant all at once. This often ends in an overloaded report that nobody uses fully. Another frequent mistake is a lack of KPI definitions: when a formula is not recorded in the documentation, after a few months different people start calculating the same concept in different ways.
The third mistake is introducing automation without a testing stage. When the refresh routine goes straight into production, errors in the data are only noticed once the manager already trusts the figures and has made a decision based on them. Fourth, the governance side is often forgotten: who has the right to change a KPI definition or add a new metric. Without this rule, within a year the reporting system becomes inconsistent with itself.
Adapting standardisation to different sectors
The principles of standardisation remain the same, but the set of KPIs and the data sources vary by type of business. For a restaurant chain, the priority is seeing sales by outlet, food cost as a percentage and staff costs relative to turnover, often comparing several outlets in a single report.
For a logistics company, the priorities are route profitability, fuel costs and vehicle utilisation, and the data often comes from several different systems that have to be combined into one model. In construction, what matters most is project profitability and cost control across project stages, because a single project can run for several months and needs interim checks.
For accounting firms that keep the books for several clients, standardisation means something different: a uniform report template applied to every client, regardless of which accounting system the client uses. This lets the accountant prepare reports for a new client more quickly, because the data model already exists and only needs to be adapted to the new data source.
Analitika360’s experience of implementing standardised reports
Some companies integrate data from accounting software and provide automated reports that refresh without any further intervention from the user. This approach can be applied to restaurant chains and accounting firms that need a comparable financial picture from several outlets or clients quickly. If you would like to check whether your data sources are suitable for this kind of model, you can get in touch to discuss your specific case.
— Analitika360
Which Analitika360 packages meet the need for standardisation
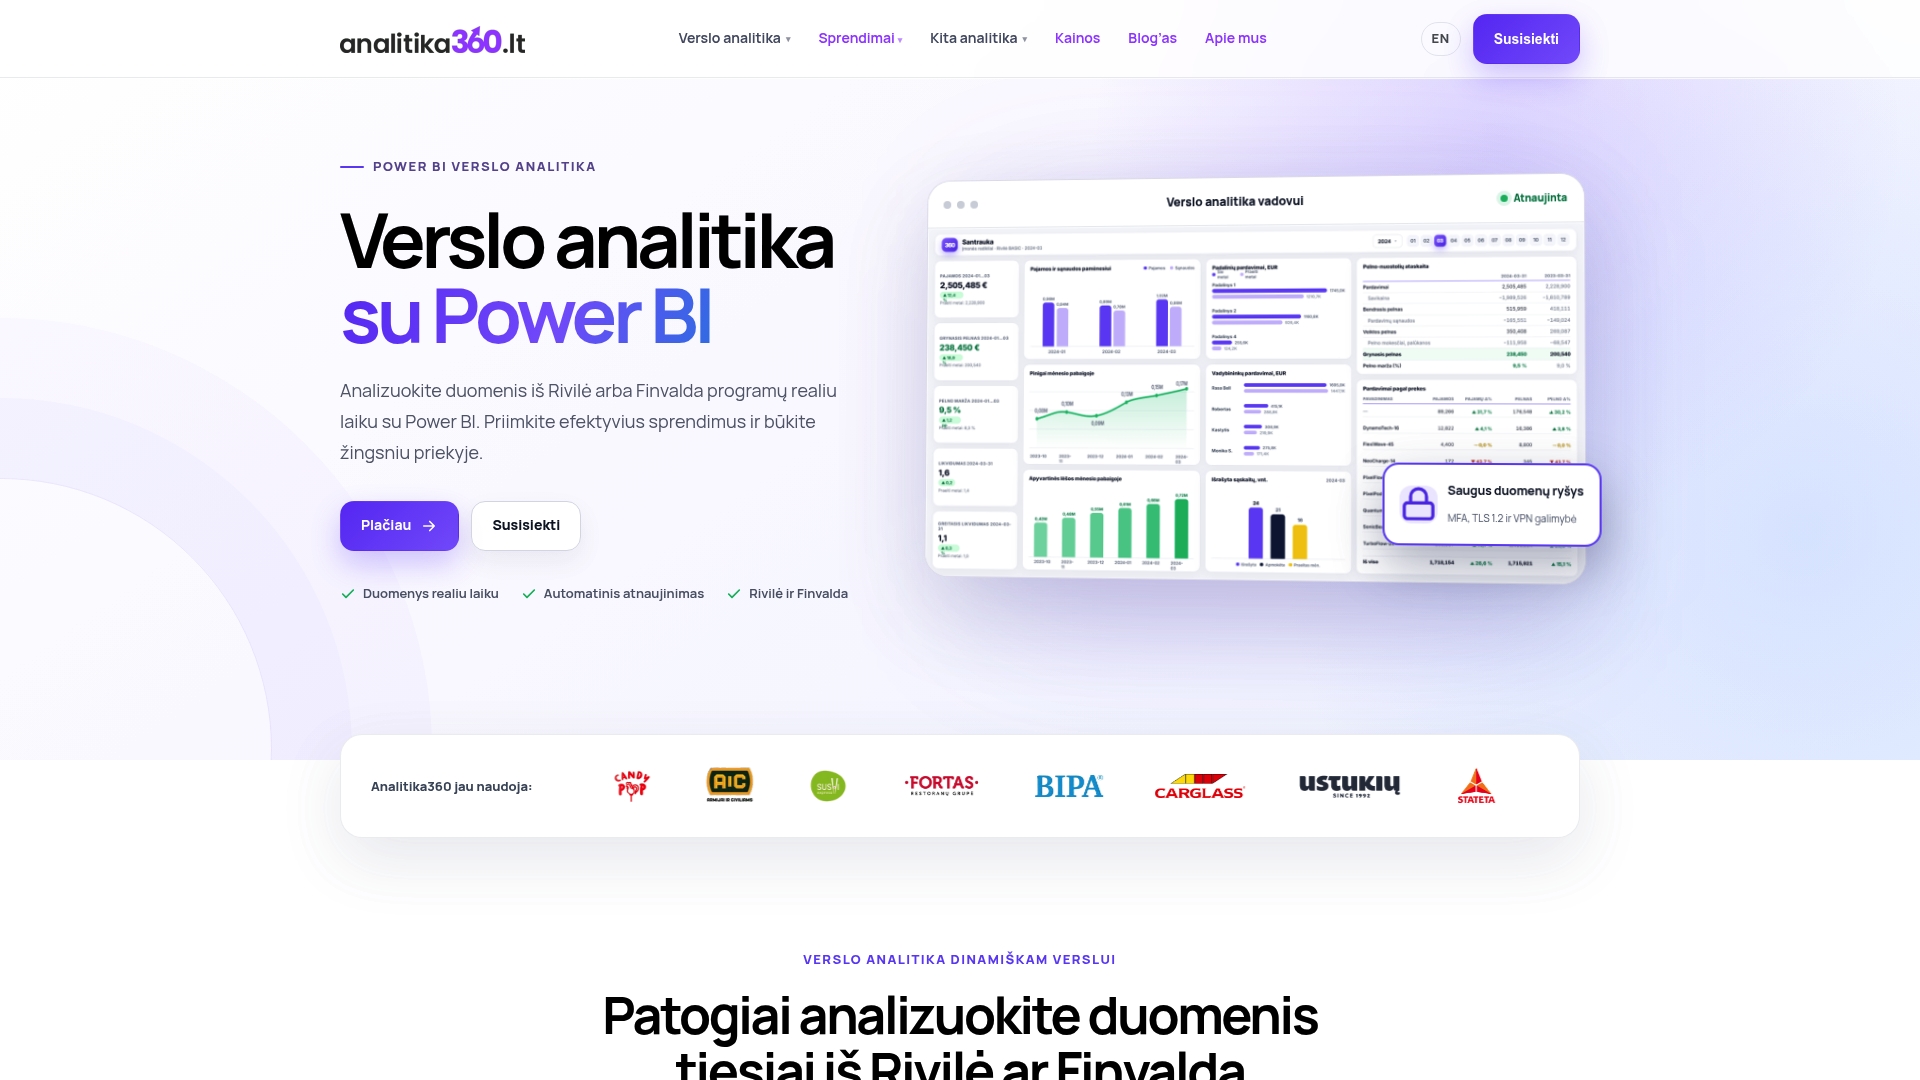
Analitika360 tackles standardisation directly by offering ready-made Power BI report packages tailored to Rivilė and Finvalda users, with no need to build a data model from scratch. That means a faster start and fewer working hours than building a system yourself from the first step.
Depending on your needs, you can choose from several options:
- Rivilė Basic at €59 a month, a core report set for Rivilė users.
- Rivilė PRO at €89 a month, with a wider range of metrics.
- Finvalda Basic at €59 a month, for Finvalda users.
- Finvalda PRO at €89 a month, for additional needs.
If a standard package does not match the complexity of your systems, you can order a bespoke project at €70 an hour, tailored to your specific IT environment and data sources. Take a look at the pricing page and choose the package that fits your accounting system.
Sources
- Ministry of Finance: why publishing financial statements matters
- Business Accounting Standards (legal act)
- Analysis of the impact of the transition to IFRS (KTU)
FAQ
What is the difference between report standardisation and automation?
Standardisation defines which KPIs are used and how they are calculated across the company. Automation is the technical step that ensures those reports refresh without manual data entry. Neither delivers the full result without the other: a standardised but non-automated report still requires manual work every month.
How long does a report standardisation project take?
The duration depends on the number of data sources and the scope of the KPIs: a project with a single accounting source moves faster than one with several integrations. A ready-made package designed for a specific system, such as Rivilė or Finvalda, shortens the preparation time because the data model already exists.
Can reports be standardised using Excel alone?
Excel can be a first step, but it requires manual updating and struggles to maintain comparability between departments. A Power BI solution that combines data from Rivilė, Finvalda or SharePoint allows reports to refresh automatically and keeps a consistent format for all users.
Which KPIs should be standardised first?
Priority usually goes to sales, profitability and liquidity, because these metrics directly affect a manager’s short-term decisions. Sector-specific metrics, such as inventory turnover or project profitability, are added later, once the core set is running reliably.
Do standardised reports help in obtaining financing?
Companies that provide more detailed and reliable financial information tend to have their financing applications viewed more favourably, as the Ministry of Finance publication notes. Internal standardisation contributes to that reliability, because it lets you quickly present a clear and comparable financial picture to a bank or investor.