
Restaurant Sales Analysis: What to Measure and How to Act Straight Away

Restaurant sales analysis means continuously tracking food cost, bar cost and sales metrics, so that pricing and menu decisions rest on actual figures rather than gut feeling. Once it is in place, you can quickly spot where unnoticed losses are eating into your margin and adjust prices or portions within days, not months. The first steps are to sort out the data flows from purchasing, the stockroom and the till, and then to start on menu engineering.
In brief:
- Continuous monitoring of sales and kitchen metrics lets you detect losses quickly and adjust prices or portions.
- A gap between theoretical and actual food cost usually points to theft, waste or incorrect portions.
- Integrating data from the POS, stockroom, purchasing and accounting ensures reliable KPIs and allows real-time analysis.
- Menu engineering helps identify your most profitable dishes and optimise pricing and menu structure.
- Automated Power BI reports let you monitor key metrics in real time, reduce manual work and make analysis more efficient.
Contents
- Key KPIs and metrics for a restaurant
- How to collect and integrate data: purchasing, stockroom, POS, accounting
- Menu engineering: how to classify dishes and optimise pricing
- Food cost control and inventory management in practice
- Sustainability and measuring food waste: the link to your finances
- Putting it into practice: the role of automated analysis
- Seasonal swings in sales and their effect on analysis
- Analysing customer demographics and buying habits
- Analysing competitors’ sales and pricing
- Sales forecasting and identifying trends
- An overview of technology and software for sales analysis
- Editorial view: priorities and the most common mistakes
- How Analitika360 packages help you put this analysis in place
- Frequently asked questions
- Sources
Key KPIs and metrics for a restaurant
Every metric should answer a specific question about the money you keep or lose each day.
Food cost is calculated in two ways: theoretical (based on recipes and purchase prices) and actual (based on the stock genuinely used). When these two figures differ by more than a few percentage points, it usually means theft, waste or incorrect portions. Bar cost works in a similar way, except that losses on drinks often go unnoticed for longer, because the contents of a bottle are harder to check by eye.
The most important metrics to track daily or weekly:
- Food cost percentage (theoretical and actual, compared against each other)
- Bar cost percentage and gross margin by category
- Average spend per bill and sales by channel (dine-in, online, delivery)
- Table turnover and stock turnover rate
Turnover data for restaurants and catering businesses shows how the sector changes over time, and this data is a useful basis for benchmarking when comparing your own results with market trends.
Your priority in the first week: compare theoretical and actual food cost for at least one category, such as meat dishes, and look for the biggest gap.
How to collect and integrate data: purchasing, stockroom, POS, accounting
Reliable KPIs only emerge when data from different systems match in units and periods.
The main sources that need to be linked:
- The till system (POS), recording sales by dish, time and channel
- The purchase ledger, showing how much raw material was bought and at what cost
- Stock records, which show balances and usage
- The accounting system, such as Rivilė or Finvalda, where costs and revenue are consolidated
- Excel or SharePoint files, used for interim calculations where there is no automatic connection
During integration, the most important thing is to reconcile units of measure (kilograms with litres, portions with ingredient quantities in recipes) and to give every item a unique code (SKU), so that the system can automatically match purchases to sales.
When data is gathered by hand across several Excel files, the likelihood of errors rises and reports go out of date within hours. An automated data flow removes this risk, because the figures refresh without anyone having to step in.
Expert tip: start integration with your three biggest revenue-generating categories rather than the whole menu at once.
Menu engineering: how to classify dishes and optimise pricing
Menu engineering combines two measures, popularity and margin, to show which dishes deserve their place on the menu and which cost more than they bring in.
A dish’s margin is calculated by deducting the ingredient cost from the selling price, while popularity is measured by the number of portions sold over a chosen period. When these two measures are plotted on a matrix, dishes fall into four groups:
- Stars: high margin and high popularity, worth promoting and protecting the price
- Puzzles: high margin but low popularity, worth moving to a more prominent spot on the menu or renaming
- Ploughhorses (popular, low margin): suitable for a gentle price rise or a smaller portion
- Dogs: low popularity and low margin, usually worth removing from the menu
After each change, it is important to compare the shift in sales and margin over four weeks, because a shorter period may reflect random fluctuations rather than a genuine trend.
Food cost control and inventory management in practice
Actual food cost comes down not through infrequent stocktakes but through recording losses every day and standardising recipes.
Practical steps for control:
- Record product losses (spoiled goods, over-portioning, wrong orders) daily, not once a month
- Standardise recipes in units of weight, not ‘by eye’, so that every portion is the same
- Include hidden costs, such as spices, oils and sauces, in the overall cost of each dish, as they are often left out of the calculation
- Assign responsibility for stocktaking to specific staff members, so it is clear who answers for discrepancies
Expert tip: carry out a partial stocktake (of one or two categories) every week and leave the full count of all stock to once a month; that way you keep control without spending too much time on it.
Audits carried out at least once a quarter by an independent person help uncover systemic errors that go unnoticed in the daily routine by those who have grown used to them.
Sustainability and measuring food waste: the link to your finances
Food waste is not just an environmental issue; it is a direct loss of profit that can be measured and reduced.
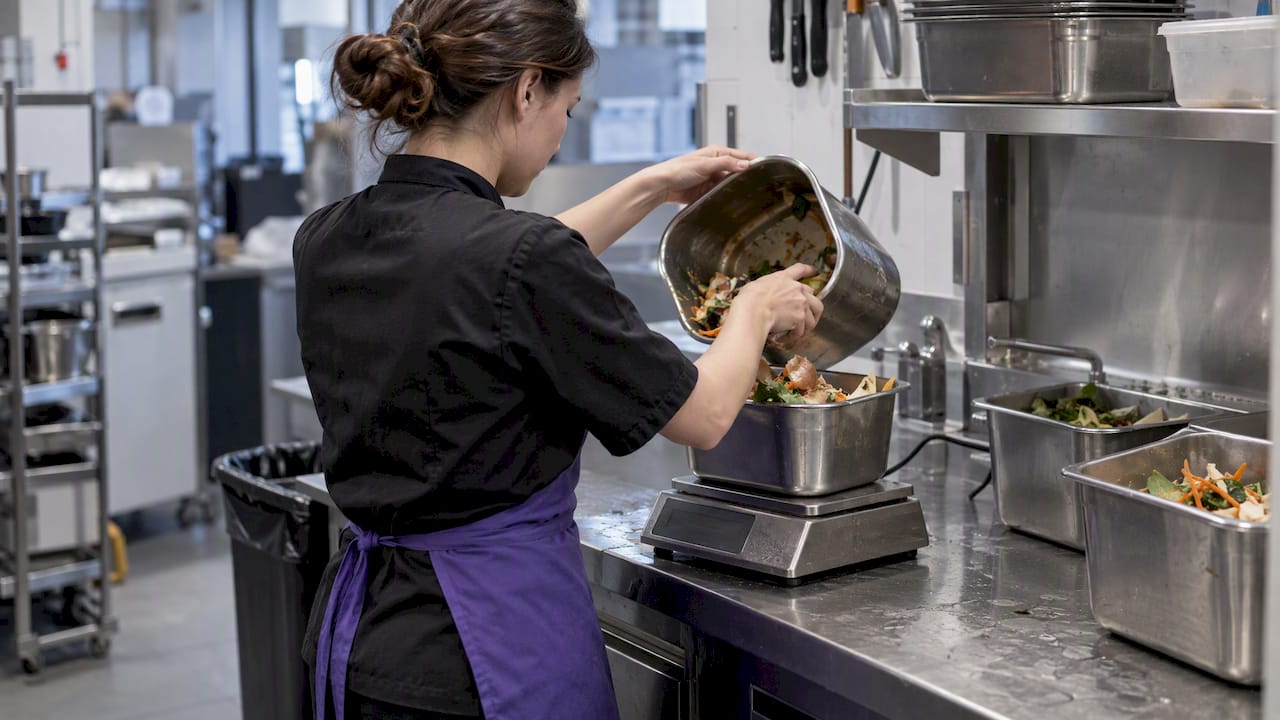
The GRI 306 standard sets out how to record waste at different stages of operations, such as preparation, serving and storage, and what data to include in reports. For a restaurant, this makes it possible to pinpoint the stage where the biggest losses occur and to put an accurate monetary value on them.
EFSA data shows that the restaurant and catering sector accounts for a significant share of total food waste in the European Union, which makes it one of the priority areas for prevention.
| Measurement stage | What to record | Practical benefit |
|---|---|---|
| Storage | Spoiled ingredients, expired items | Adjusting purchase quantities |
| Preparation | Trimmings, unused ingredients | Reviewing recipes and portions |
| Serving | Returned dishes, food left on plates | Adjusting the menu or portion sizes |
The ETC CE report summarises the action EU member states are taking to prevent food waste and provides a catalogue of specific measures that restaurants can adapt to their own context.
Putting it into practice: the role of automated analysis
Power BI reporting solutions built for accounting systems let you see revenue, costs and profit in real time, with no additional manual work.
The system brings data from the accounting software, the stockroom and additional sources such as SharePoint or Excel into a single reporting model. This means that food cost, bar cost and sales channel metrics update automatically, rather than once a month through manual data entry.
The practical benefits for a manager:
- Reports refresh without the user having to do anything
- Data from different systems is combined into a single view
- Priority KPIs can be tracked daily rather than at month end
Implementation starts with tidying up the data sources, after which you choose either a ready-made report package or a bespoke project tailored to your specific needs.
Seasonal swings in sales and their effect on analysis
Restaurant sales are rarely steady throughout the year, and these swings directly affect how KPIs should be interpreted.
In the summer months, outdoor terraces and the influx of tourists often push up the average bill, but they also increase ingredient costs, as larger stocks of perishable produce are needed. In winter, by contrast, sales volumes fall but fixed costs such as rent and staff remain much the same, so the margin percentage can look worse even when nothing about the management has changed.
Seasonality affects analysis in several ways. First, comparing one month’s results with the previous month can lead to the wrong conclusions, because December’s results are not comparable with January’s. It is more accurate to compare the same month across different years, so that you see the real trend separated from seasonal noise.
Second, inventory and purchase planning needs to take seasonal peaks into account in advance. A restaurant that knows sales rise over the festive period can negotiate better prices with suppliers ahead of time, rather than buying in a rush when prices have already gone up.
Third, menu engineering also has a seasonal dimension: a dish classed as a ‘dog’ in winter can become a ‘star’ in summer if it contains seasonal ingredients that are cheaper and more popular at that time. Reviewing the menu matrix once a quarter rather than once a year therefore gives a more accurate picture.
Analysing customer demographics and buying habits
Who orders, when and how much often matters more than what is sold, because this data shows how to tailor the menu and marketing to a specific audience.
Demographic data such as age group, time of visit and average party size helps you understand which customers generate the most turnover. For example, a restaurant may notice that families with children tend to come at lunchtime on weekdays, while younger customers make up the evening and weekend trade.
Buying habits cover not only what a customer orders but also how often they return, how much they typically spend and whether they choose extra dishes and drinks. This data is usually collected through the till system, loyalty schemes or online ordering platforms, if the restaurant uses them.
By segmenting customers according to behaviour, you can make more targeted decisions. Frequent visitors respond well to loyalty offers, while those who visit rarely but spend a lot are better suited to personalised offers for special occasions. This segmentation also helps identify which menu items attract new customers and which encourage repeat visits.
Analysing competitors’ sales and pricing
Assessing your results without market context gives an incomplete picture, so keeping an eye on competitors becomes a natural part of the analysis.
In practice, competitor pricing analysis begins with comparing the menus of restaurants in a similar format: prices for similar dishes, portion sizes and the cost of additional services (delivery, reservations). This comparison does not reveal a competitor’s exact sales figures, but it helps you understand whether your pricing meets market expectations.
The second step is to follow publicly available information: reviews, social media activity, seasonal offers and promotions. If a competitor regularly changes prices at certain times of year, that is a sign that seasonality in their area works much as it does for you.
Third, sector-wide statistics, such as turnover data for catering businesses, let you compare your growth rate with the market as a whole, not just with individual competitors. If the whole market is growing faster than your restaurant, that suggests the problem may lie not in the general market situation but in your own specific decisions, pricing or menu offering.
Sales forecasting and identifying trends
Past data is only useful when it becomes the basis for future decisions, not just last month’s report.
The core principle of forecasting is to compare data for the same period over several years, so that you can separate a genuine upward or downward trend from random fluctuation. For example, if sales in March have grown three years in a row, that is a stronger signal than a one-week spike.
To identify trends, it helps to track several metrics together: sales volume, average bill and customer numbers. When volume rises but the average bill falls, more people are coming in but spending less, which calls for a different response than when customer numbers fall but the average bill rises.
Forecasting also helps you plan staffing and ingredient needs in advance. A restaurant that knows its weekend trade is roughly a third higher can schedule shifts and purchases more precisely, avoiding both the cost of overstaffing and ingredient shortages at peak times.
It is important not to overreach with complex models while the foundation, clean and consistent data, is still not in place. A simple trend line based on reliable data from previous years often gives a more accurate result than a sophisticated model fed with messy figures.
An overview of technology and software for sales analysis
There are several types of solution on the market, each suited to a different restaurant size and level of maturity.
The simplest level, manual tracking in Excel, suits very small restaurants with low volumes but quickly becomes unmanageable as dishes, channels or sites multiply. In most cases, till systems (POS) include basic built-in reporting modules, but their capabilities are often limited to sales data, without integrating purchasing or stock.
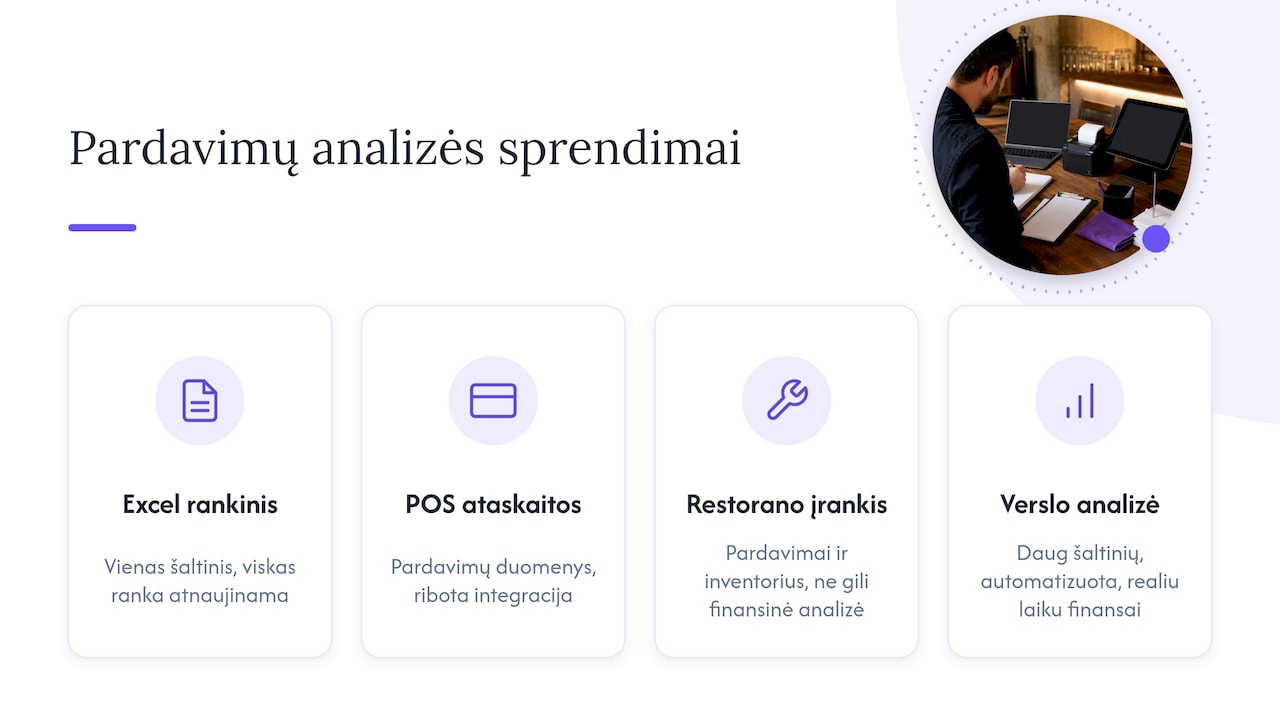
Specialised restaurant management tools bring sales, inventory and sometimes staff scheduling together in a single window, but such solutions are usually geared towards general operational management rather than in-depth financial analysis.
Business intelligence platforms such as Power BI let you combine data from several sources (the till, the accounting system, the stockroom) into a single automated set of reports. The advantage of this kind of solution is that reports can be tailored to the specific accounting system the restaurant uses, such as Rivilė or Finvalda, and key metrics can be seen in real time without manual data entry.
The choice depends on how many data sources need to be combined and how often you need up-to-date figures. A single site may manage with a simpler solution, while for a chain of several restaurants with centralised accounting an automated analytics platform becomes practically unavoidable if accuracy is to be maintained without extra administrative burden.
Editorial view: priorities and the most common mistakes
The biggest mistake we see is trying to start with sophisticated analysis while the core data is still in a mess. Menu engineering or forecasting is of no use if the food cost figures do not reflect reality.
Invest first in data integration and inventory control: it is the duller work, but it pays back fastest. The second common mistake is ignoring menu engineering, with prices changed on instinct rather than on the basis of margin and popularity data.
Decisions should be made by whoever sees the figures every day, not by whoever receives them once a month in an out-of-date report.
— Analitika360
How Analitika360 packages help you put this analysis in place
You can get started without a large investment: there are ready-built Power BI report packages designed for users of accounting systems, so there is no need to build analytics from scratch.
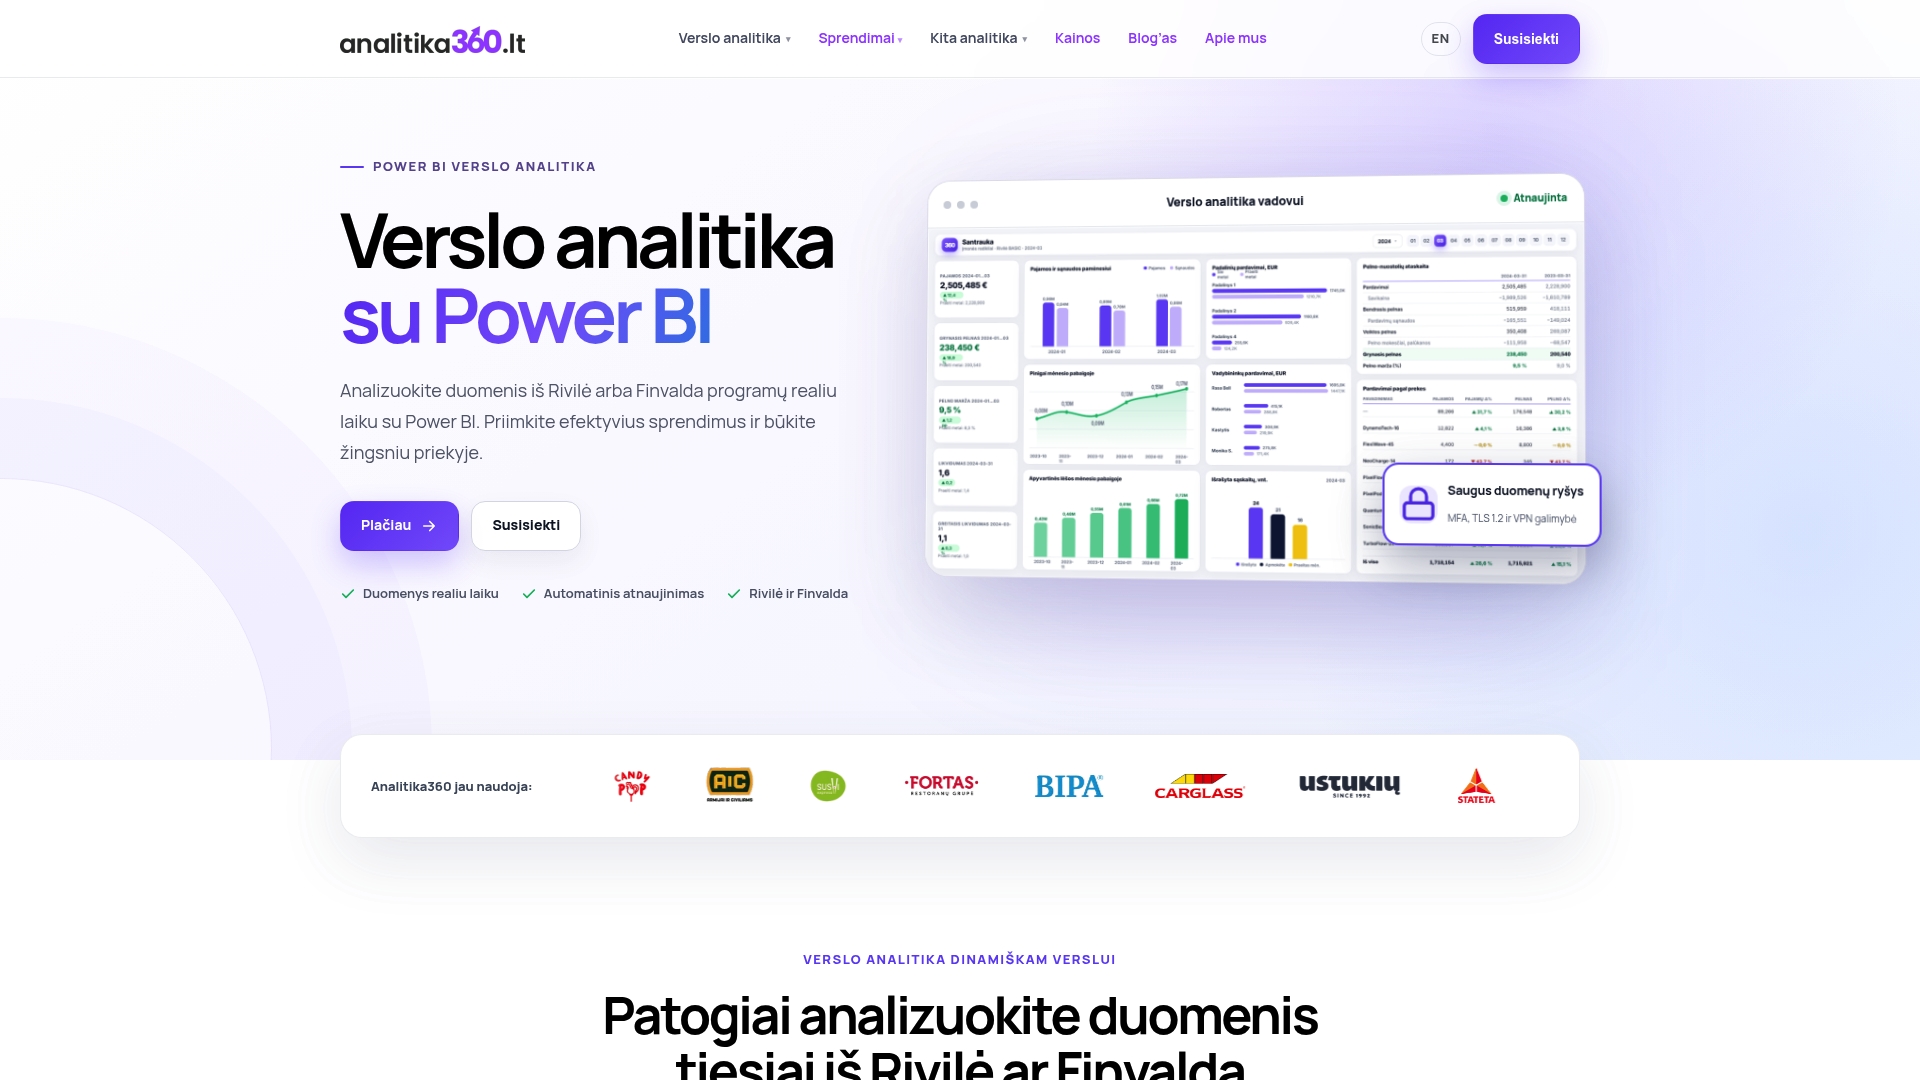
If you use Rivilė and want to start with the core sales and cost metrics, the Rivilė Basic package provides a ready-made set of reports with no extra implementation time. For broader analysis covering several sites or more detailed financial reporting, Rivilė PRO is the right fit. For Finvalda users we offer equivalent options: Finvalda Basic for the core metrics and Finvalda PRO for more complex needs.
- For a single restaurant with standard accounting, we recommend the Basic packages
- For a chain or a more complex structure, we recommend the PRO packages
- For unique processes or additional integrations, we offer bespoke projects
For pricing, please see the pricing page, which lists the fees for report packages and bespoke projects.
Before ordering, sort out your main data sources and decide which KPIs matter most to you; this will let us tailor the reports to your needs more quickly. You can request a demo or a bespoke solution via the pricing page.
Frequently asked questions
What is restaurant sales analysis and why do you need it?
Restaurant sales analysis is the continuous monitoring of food cost, bar cost and sales metrics, allowing pricing and menu decisions to be based on actual data. You need it because without it, it is hard to see where losses arise from waste, incorrect portions or the wrong pricing.
How do you calculate the food cost percentage in a restaurant?
The food cost percentage is calculated by dividing the ingredient cost by the selling price and multiplying by one hundred. It is important to compare the theoretical calculation, based on recipes, with actual usage, as the difference between them indicates losses or theft.
What is menu engineering and how do you apply it in practice?
Menu engineering classifies dishes by margin and popularity into four groups: stars, puzzles, ploughhorses and dogs. Based on this classification, decisions are made on pricing, portions or promotion, with the aim of steering sales towards more profitable dishes.
How is measuring food waste linked to a restaurant’s finances?
Food waste represents a direct loss of profit, because ingredients that are bought but not used cost money without generating corresponding revenue. The GRI 306 standard helps you record waste in a structured way at different stages of operations, so that it can be valued in monetary terms and reduced.
How much does an automated sales analysis solution cost?
The price depends on the package you choose: Rivilė Basic and Finvalda Basic cost €59 a month, while Rivilė PRO and Finvalda PRO cost €89 a month. Bespoke projects tailored to specific needs cost €70 an hour.
Sources
The resources below will help you explore the standards and statistics mentioned in this article in more depth.