Revenue and Cost Analysis: A Practical Guide for Finance Professionals

Revenue and cost analysis is a systematic process that brings together accounting data and analytical methods to support decisions on profitability and cost optimisation. It answers a specific question: where are we making money, where are we losing it, and what should we do about it? Below we look at the metrics, methods and a practical workflow you can follow when preparing a monthly or quarterly report.
In brief:
- Revenue and cost analysis helps pinpoint where a company makes and where it loses profit by separating direct from indirect costs.
- Cost recognition rests on the accruals and matching principles, which ensure costs are recorded in the right period and segmented accurately.
- Measures such as EBITDA and operating profit reveal operational efficiency better than net profit, particularly in capital-intensive businesses.
- Modern data refresh solutions and automated reports make it possible to track profitability in real time and respond quickly to change.
- Developing proactive analytical skills and adopting automation are becoming essential to effective financial management in the future.
Contents
- Key terms and accounting principles
- Classifying revenue and costs in practice
- Key analysis metrics and ratios
- Analysis methods and models
- A practical workflow: from data collection to the report
- How to interpret the results and what to do next
- Analitika360: data integration and report automation
- Editorial perspective: how the finance analyst’s role is changing
- Rivilė and Finvalda report packages for your analysis
- FAQ
- Sources
- Reliable standards and further reading
Key terms and accounting principles
Before calculating any ratios, you need to agree on when, in principle, costs are recognised in the accounts. The accruals principle means that revenue and costs are recorded when they arise, not when cash is received or paid out. The matching principle complements this logic: costs are assigned to the period in which the related revenue is earned. The Lithuanian Business Accounting Standards (VAS) state that costs are recognised according to these two principles and recorded when they can be measured reliably.
In practice, this means distinguishing between cash outflows and accounting costs, which do not always coincide in time.
- Accruals principle: revenue and costs are recorded when they arise, regardless of when cash moves.
- Matching principle: costs are assigned to the same period as the revenue they relate to.
- Documentation: every adjustment (e.g. accrued expenses, provisions) must have a clear basis and date.
Classifying revenue and costs in practice
Correct classification makes reports quick to read and comparable across periods. The first step is to separate direct costs (raw materials, production wages) from indirect costs (rent, administration). The second step is to calculate the cost of goods sold, which shows what it cost directly to produce the goods or services sold; this figure is the basis of gross profit.
- Assign direct costs to a specific product or service so you can see its true profitability.
- Separate operating expenses (sales, administration) from finance costs (interest, currency fluctuations).
- Build account grouping logic that matches your segments: product lines, departments or customer groups.
This structure later lets you quickly put together a profit and loss statement, which shows revenue, costs and net profit in one place.
Key analysis metrics and ratios
Once the classification is in order, you move on to the ratios that management and auditors expect to see. Gross profit shows what is left after direct costs are deducted. Operating profit also deducts administrative and selling expenses. EBITDA strips out the effect of depreciation, amortisation, interest and taxes, so it better reflects operational efficiency, independent of accounting adjustments.
| Ratio | Formula | What it shows |
|---|---|---|
| Gross profit | Revenue minus cost of sales | Profitability after direct costs |
| Operating profit | Gross profit minus operating expenses | Profitability after all operating costs |
| EBITDA | Operating profit plus depreciation and amortisation | Operating performance excluding non-cash costs |
| Gross profit margin | Gross profit divided by revenue | The percentage of revenue left after cost of sales |
Net profit can be misleading because of non-cash costs such as depreciation. For this reason, capital-intensive businesses should look at EBITDA or operating profit alongside the bottom line rather than relying on net profit alone. It is useful to compare margins across segments and against benchmarks from previous periods, not just as absolute figures.
Analysis methods and models
Once the ratios are calculated, you need a method that explains why they are what they are. Activity-based costing (ABC) makes it possible to identify more precisely which processes or products actually drive costs, rather than simply spreading overheads proportionally. An ABC system provides more information for management decisions on the profitability of products or departments, especially where traditional cost accounting fails to show where additional costs really arise.
- ABC is worth introducing when you have several products or services with different cost profiles.
- Budgeting becomes an analytical tool when you continually compare actual results with the plan and explain the variances.
- Scenario modelling helps you prepare optimistic, base and pessimistic cases, so that management decisions are not based on a single forecast.
Professional tip: start scenario modelling with a single variable (e.g. raw material prices) and only then move on to combinations of several variables.
Modern financial analysis is becoming proactive: predictive analytics, scenario modelling and anomaly detection make it possible to spot problems earlier than they show up in the final report.
A practical workflow: from data collection to the report
An analysis is only as valuable as its data is reliable. The workflow usually has three stages: consolidating the data, classifying it with adjustments, and preparing the report itself.
- Gather data from the accounting system and additional sources (Excel, CRM), and check that totals agree across sources.
- Apply the classification rules, make accrual adjustments and document every unusual entry.
- Prepare the report with segmentation and comparisons against the budget and the previous period.
Practical control points can reduce the number of errors: check the data source, the currency conversions applied, VAT reporting and the reconciliation of payroll with HR data. Companies that carry out some of their transactions in foreign currency should also look at opportunities to reduce currency exchange costs, as exchange rate fluctuations can have a significant impact on finance costs.
How to interpret the results and what to do next
Numbers on their own change nothing until you turn them into action. A falling gross profit margin usually signals that raw material or supply prices have risen faster than selling prices, so the first step is to review pricing. Administrative costs growing relative to revenue suggest it is worth reviewing processes or the organisational structure.
- Short-term action: adjust pricing or negotiate with suppliers when the margin falls for several periods in a row.
- Long-term action: invest in automation or process redesign when administrative costs consistently grow faster than revenue.
- Communication: give management not just the figures but one specific recommendation with a timeframe.
For monitoring, it helps to use the same KPIs in every period so that changes are comparable, rather than judged against a context that shifts every month.
Analitika360: data integration and report automation
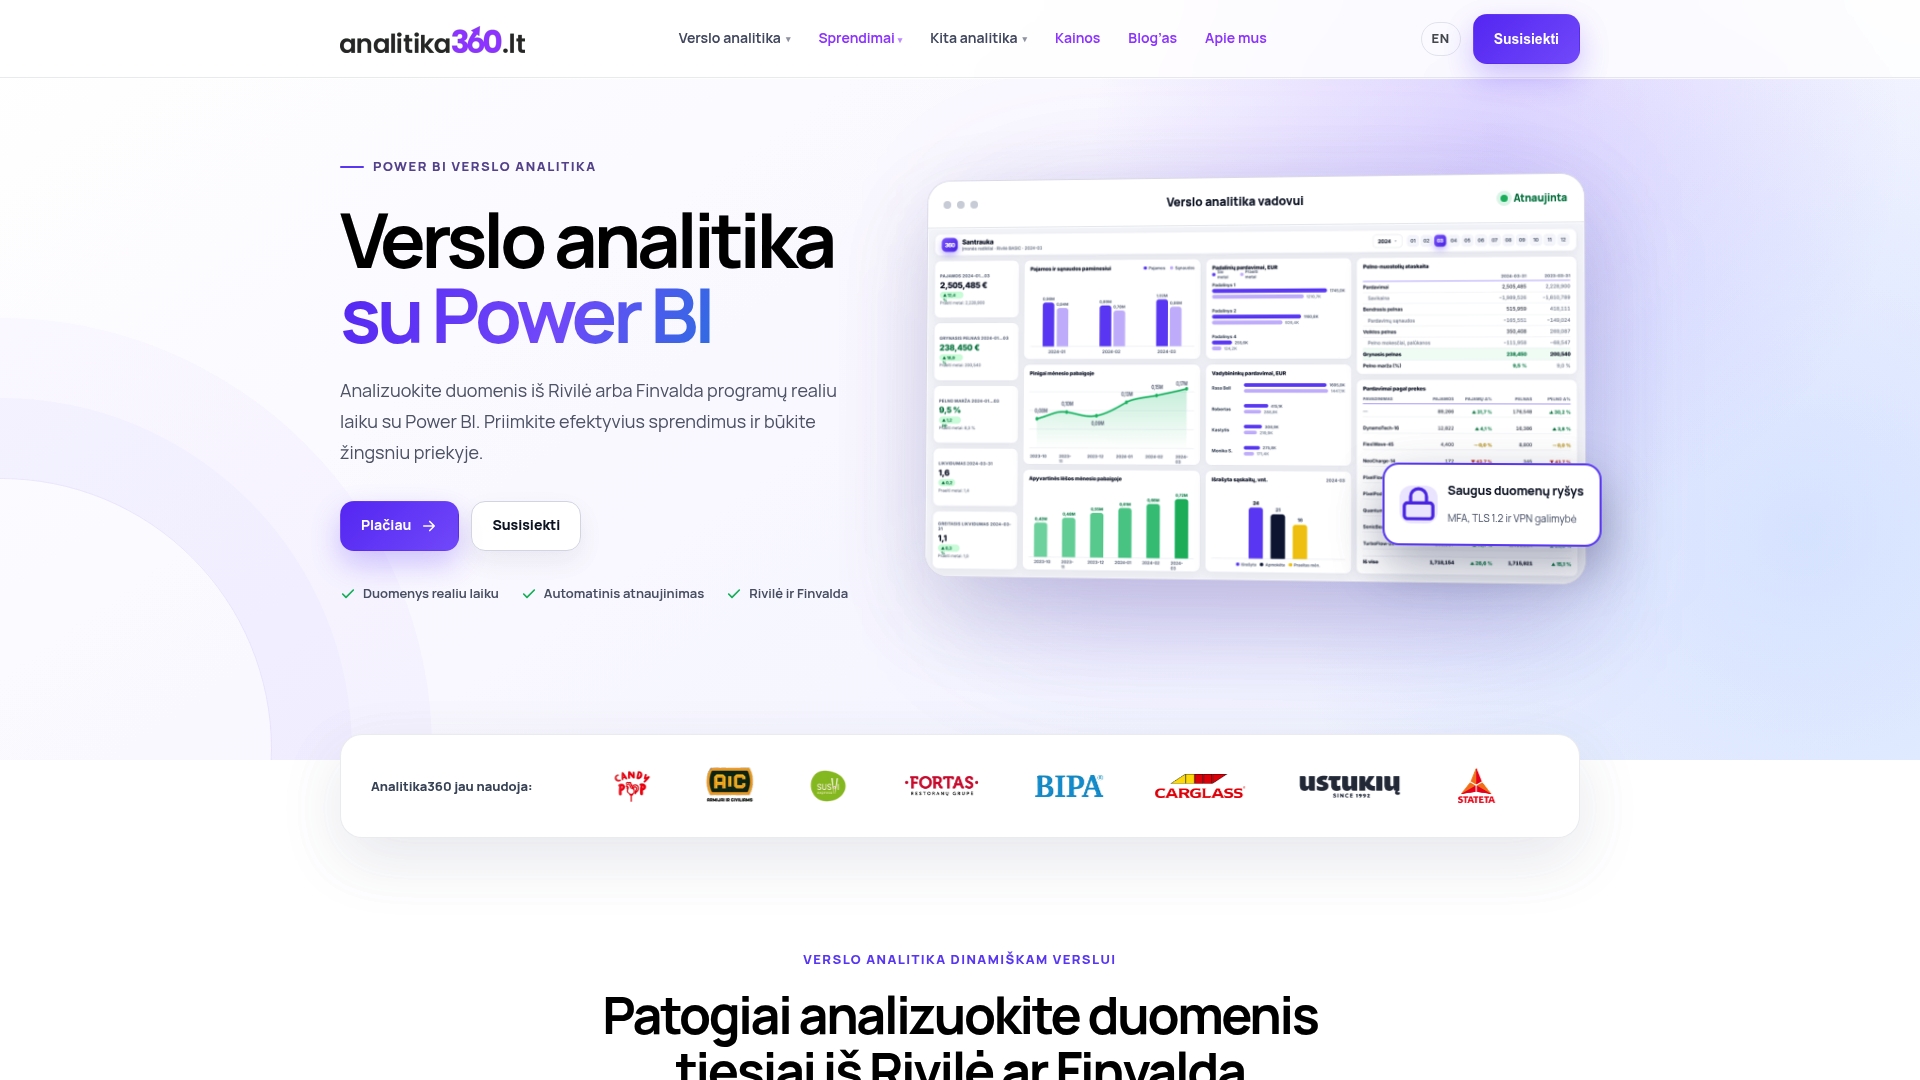
The workflow described above can be carried out manually in Excel spreadsheets or automated. Solutions can combine data from accounting software with additional sources, such as SharePoint or Excel, in a single Power BI model. This lets you see revenue, cost and profit indicators in real time, without manual data entry every month.
Automated reports that refresh in real time reduce the risk of manual errors and make it possible to react faster to anomalies in the cost structure.
A typical workflow with such a solution is simpler: data from the accounting system refreshes automatically, the report already has segmentation built in, and the finance professional spends the time saved on interpretation rather than data preparation.
Editorial perspective: how the finance analyst’s role is changing
The finance professional’s role is shifting from retrospective report preparer to proactive business partner. Predictive analytics and anomaly detection make it possible to spot a problem before it appears in a report, but this calls for new skills: data management, scenario modelling and the ability to communicate conclusions clearly to management, not just in tables. Those who invest in these skills now will spend less time preparing data and more time making decisions in the future.
— Analitika360
Rivilė and Finvalda report packages for your analysis
If the workflow described in this article looks familiar and time-consuming, we can cover part of it without any extra manual work. Our Rivilė Basic and Finvalda Basic packages cost €59 a month each, while the PRO versions, including Finvalda PRO, cost €89 a month. They include automatic data refresh and real-time tracking of key indicators.
- Rivilė Basic and Finvalda Basic: €59 a month, key revenue and cost indicators.
- Rivilė PRO and Finvalda PRO: a monthly package with a broader set of reports and segmentation.
- Bespoke projects: hourly rates available when the solution needs to be adapted to specific IT systems.
If you would like to see how this works with your own data, take a look at the pricing and plans page or get in touch to arrange a personal demo.
This article is general information, not a substitute for advice from a qualified financial advisor. Consult a qualified financial professional about your own circumstances before acting on anything here.
FAQ
How does revenue and cost analysis differ from budget analysis?
Revenue and cost analysis assesses actual results and their structure, whereas budget analysis compares actuals with the plan. In practice they are used together: budget variances are often the starting point for a deeper cost analysis.
When should you use EBITDA and when net profit?
EBITDA is useful when you want to assess operational efficiency independently of the effects of depreciation, interest or taxes. Net profit can be misleading in capital-intensive businesses, so it is best to look at both measures side by side.
How can you tell whether costs have been recognised correctly in the accounts?
Costs are recognised when they are incurred and can be measured reliably, in line with the accruals and matching principles. If the accounting date does not match the moment the service or goods were actually received, it is worth checking the adjusting entries.
What solutions help automate revenue and cost reporting?
Automation is usually achieved by connecting accounting system data to an analytics platform, such as Power BI, which refreshes without manual intervention. The Rivilė and Finvalda report packages are one such solution, tailored to users of these systems.
Sources
- APPROVED by Order No. VAS-61 of the Director of the Audit and Accounting Service of 28 December 2015
- Profit and loss statement
- Financial management and ABC costing (Kvalitetas)
- How to manage financial processes properly in a modern company (SPPC)
- The profit and loss statement: how to prepare it correctly (Pasiskaitom)
Reliable standards and further reading
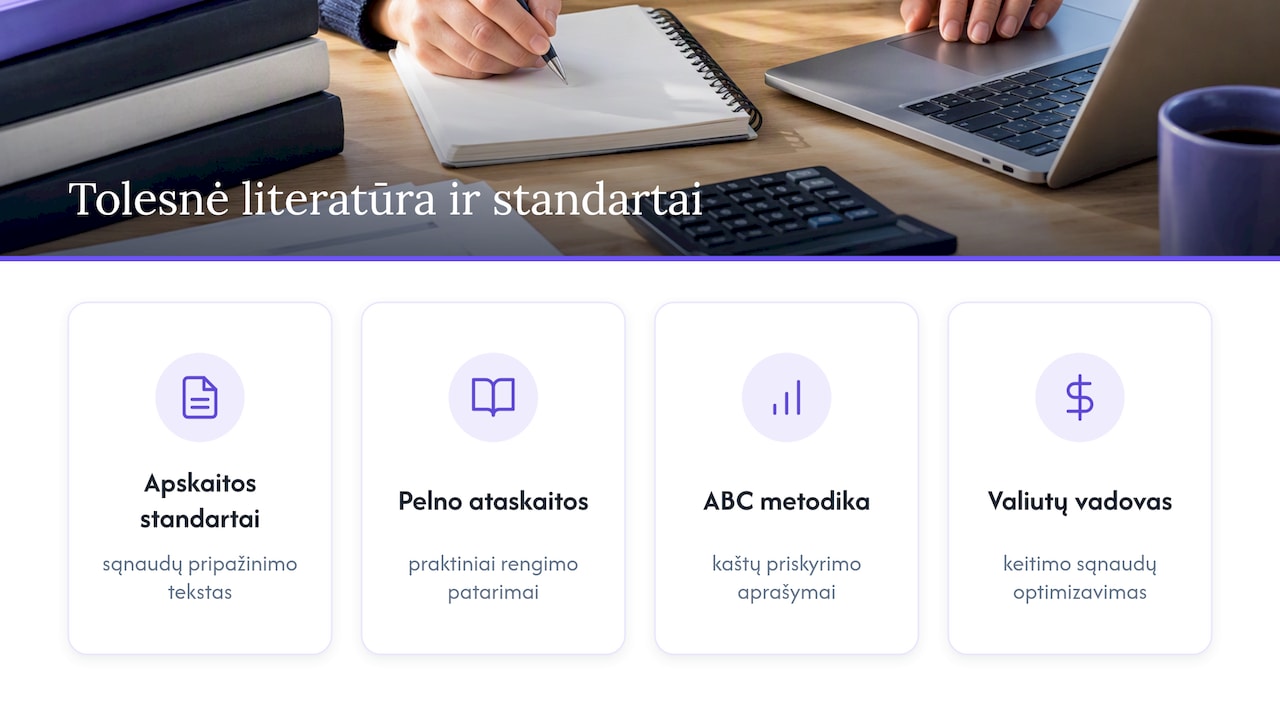
For further study, we recommend reviewing the text of the Business Accounting Standards on cost recognition, practical guides to preparing the profit and loss statement, and descriptions of the ABC costing methodology. For companies dealing in foreign currencies, a guide to reducing currency exchange costs is also useful.