
Transport cost analysis: from your first route to a 90-day plan

To get real control over transport costs, set 3–5 key metrics, including l/100 km, €/100 km and total cost of ownership (TCO), connect telematics and fuel cards to your accounts, and begin by analysing a single route. An automated data flow cuts manual entry errors and reveals the first savings opportunities within a week. Your first task: choose one route or vehicle and gather its fuel, mileage and repair data.
In brief:
- Automated data collection and a single analytics system improve accuracy and save time by reducing manual entry errors.
- Integrating fuel and repair data makes it quick to identify costly business processes and opportunities for optimisation.
- Precise metrics such as €/100 km and TCO allow an objective comparison of vehicle performance and well-founded decisions.
- AI-assisted route planning can cut total costs by up to 13%, whereas simply replacing vehicles without integrating a system delivers only around 3%.
- A ready-made automated report pack with built-in KPI tracking tackles the challenges of managing transport costs faster and more effectively.
Contents
- Key metrics for transport cost analysis
- Data sources and tools: telematics, fuel cards, accounting integration
- A worked example: €/100 km and TCO step by step
- Practical savings and optimisation tactics
- How an automated report pack speeds up decision-making
- 90-day implementation plan
- Analitika360: a solution for automated transport cost analysis
- Sources
- FAQ
Key metrics for transport cost analysis
Before you start optimising, you need clear figures rather than a general impression of the state of your fleet. Four metrics form the basis of any analysis.
Fuel consumption (l/100 km) shows how much fuel a vehicle uses per hundred kilometres. It is calculated as (litres used ÷ kilometres driven) × 100. This metric lets you compare similar vehicles and spot deviations, which often point to driving habits or a technical fault.
Cost per 100 km (€/100 km) combines fuel, repairs and other variable costs into a single monetary figure. The Lithuanian Energy Agency (Lietuvos energetikos agentūra) regularly publishes average fuel costs using this metric by vehicle category, so you have a benchmark for your fleet’s results.
Cost per kilometre (cost/km) is useful when you need to price a service for a customer or compare the profitability of routes.
Total cost of ownership (TCO) covers all costs over a vehicle’s operating life: purchase price, fuel, repairs, insurance, depreciation and staff costs.
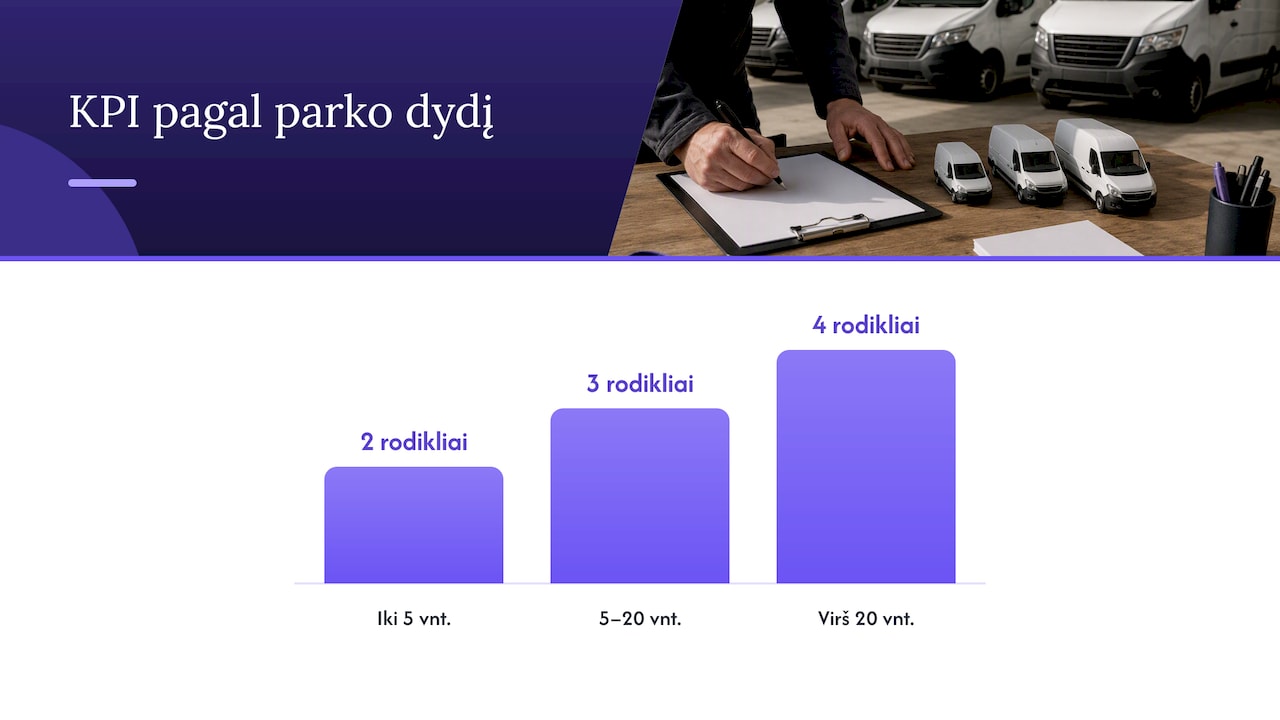
When choosing which KPIs to track first, it is important to take the size of your fleet into account:
- Up to 5 vehicles: monthly tracking of l/100 km and €/100 km is enough.
- 5–20 vehicles: add a TCO calculation for each vehicle individually.
- More than 20 vehicles: you need an automated report with all four metrics and a comparison between routes.
Data sources and tools: telematics, fuel cards, accounting integration
Accurate analysis depends on the quality of the data, not just on the formulas. Three sources deliver the greatest value.
Telematics systems record real-time fuel consumption, empty running and driving behaviour: harsh braking, speeding and prolonged idling. This data lets you tell whether high fuel costs stem from the route or from the driver’s habits.
Fuel cards automatically record every purchase: date, quantity, price and location. Importing this data directly into your accounts reduces the risk of a receipt being lost or entered incorrectly.
Accounting software such as Rivilė or Finvalda only becomes valuable once its data reaches a business intelligence system. By combining these sources in a single BI model, you see revenue, costs and fuel metrics in one place, without manually compiling them every month.
How often to synchronise depends on your needs: telematics data is useful in real time, while fuel and accounting data usually only needs updating daily or weekly.
- Telematics: real-time monitoring, especially for idling and route deviations.
- Fuel cards: automatic import reduces manual entry errors.
- Accounting integration: Rivilė or Finvalda data, combined with a BI tool, gives a complete picture of costs.
Pro tip: before connecting a new data source, check that its format matches the fields in your accounting system, so you avoid having to clean the data twice.
A worked example: €/100 km and TCO step by step
The calculation becomes simple once your data is properly collected. The example below is hypothetical and intended to illustrate the method, not to state a market fact.
- Gather the core data for the month: kilometres driven, litres used, fuel price, repair costs, insurance premium and the depreciation charge.
- Suppose a lorry covered 10,000 km in a month and used 3,200 litres of diesel at €1.45 per litre, which comes to €4,640 for fuel.
- Add the monthly fixed costs: repairs €350, insurance €180, depreciation €420. Total: €5,590.
- Divide the total by the kilometres and multiply by 100: (5,590 ÷ 10,000) × 100 = €55.90 per 100 km.
- Compare this figure with the results of your other vehicles or with the average fuel cost published by the Lithuanian Energy Agency.
If a vehicle’s result is well above the fleet average, first check driving behaviour using the telematics data, then its maintenance history. Often an expensive route hides not a fuel problem but recurring repairs that a timely preventive check would have avoided.
Practical savings and optimisation tactics
Once you have accurate figures, the next step is action that genuinely reduces costs.
AI-assisted route planning delivers tangible results: an assessment by the European Commission and its partners shows that AI-based route planning reduced total cost of ownership by around 8–13% compared with the fleet replacement alternative, while simply replacing vehicles without integrating a system saved only around 3%. This means an investment in a planning system often pays for itself faster than buying new vehicles alone.
Proactive maintenance carried out on a schedule, rather than after a breakdown, reduces costly emergency repairs and downtime. It also extends the vehicle’s service life and so directly affects the depreciation calculation.
Eco-driving training for drivers, backed by transparent rewards for fuel saved, changes behaviour faster than supervisory instructions alone.
Fuel purchasing strategies, such as fixed-price contracts or fraud protection through fuel cards with PIN codes and GPS checks, reduce losses that often go unnoticed without automated monitoring.
- Route optimisation with planning tools reduces empty running and fuel costs.
- Preventive maintenance reduces the frequency of emergency repairs and downtime.
- Driver training combined with a reward scheme changes fuel use habits.
- Fuel purchase controls with card protection reduce the risk of fraud.
Pro tip: introduce a monthly “exceptions report” showing only the vehicles whose €/100 km exceeds the average by more than 15 per cent.
How an automated report pack speeds up decision-making
Manually compiling data from fuel cards, telematics and accounting software takes up time that finance staff could spend on analysis rather than calculation. A solution that brings these sources together in a single Power BI model automatically imports data from Rivilė or Finvalda and updates KPIs without any further input from the user.
Such a package includes:
- Automatic data import from your accounting software, with no manual export every month.
- Ready-made reports tailored to transport sector metrics.
- Real-time KPIs visible in one place, without waiting for the month-end summary.
A ready-made solution makes sense when in-house development would take more time than the hours saved could justify, especially for companies without a dedicated data analyst.
90-day implementation plan
In the first month, set three to five KPIs and audit your data sources: who records fuel purchases, who logs repairs, and whether telematics is already in use. In the second month, connect these sources to your accounting software and launch the first reports, even if they cover only part of the fleet. In the third month, test one optimisation measure, such as a route change or driver training, and compare the result with your baseline €/100 km figure.
— Analitika360
Analitika360: a solution for automated transport cost analysis
For a transport company using Rivilė or Finvalda, the quickest route to automated cost analysis is a ready-made report package rather than building a system from scratch. Analitika360 offers the Rivilė Basic and Finvalda Basic packages at €59 a month, while for broader needs with additional data sources such as telematics or CRM, Finvalda PRO is available at €89 a month.
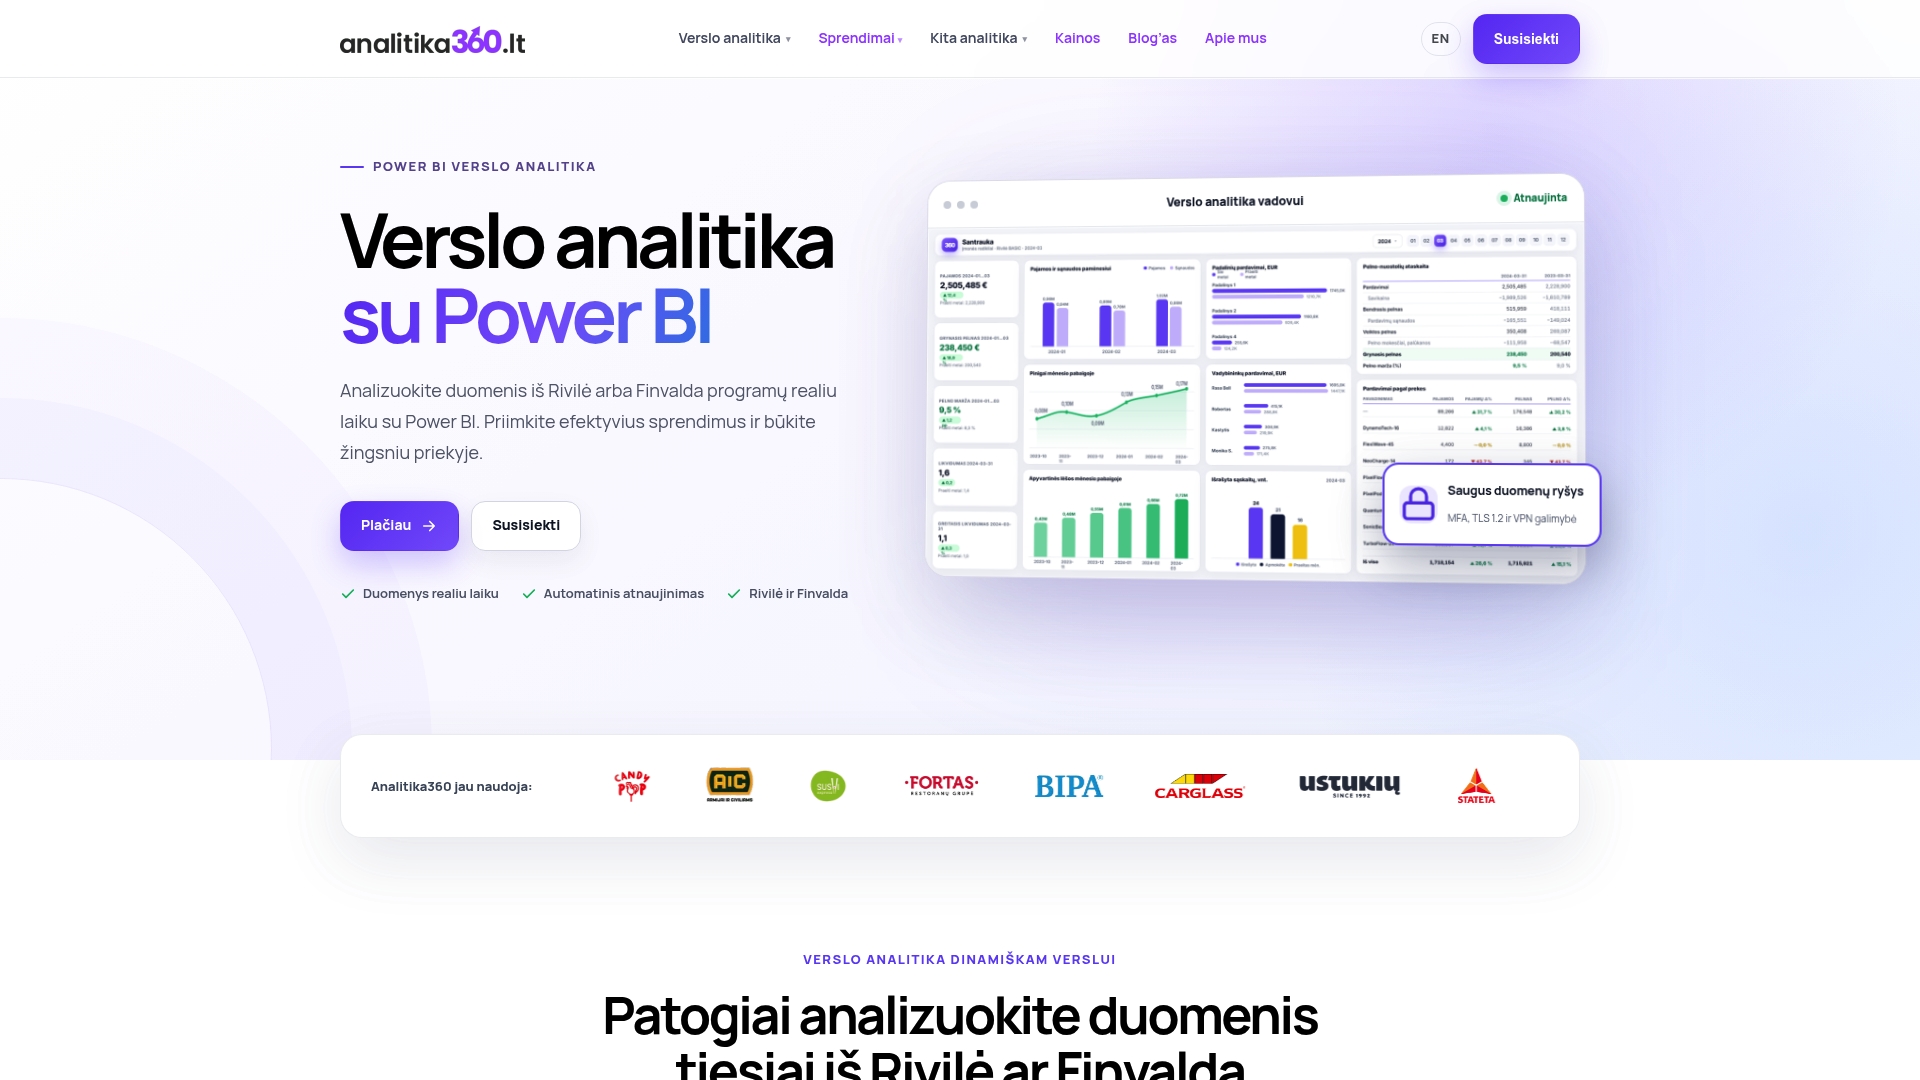
- Automatic data refresh from your accounting software, with no manual work every month.
- Ready-made KPIs tailored to the transport and logistics sector.
- Bespoke projects available when specific integration with your existing IT systems is required.
To compare plans and prices or to book a call about a bespoke solution, visit the pricing page.
Sources
- Reviews of changes in average fuel expenditure - Lithuanian Energy Agency
- AI fleet planning cuts logistics costs and boosts electric truck use - EU Urban Mobility Observatory
FAQ
What is transport cost analysis and why does it matter?
Transport cost analysis is a systematic assessment of all costs associated with running vehicles, covering fuel, repairs, insurance and depreciation. It lets you identify which vehicles or routes cost more than average and make optimisation decisions based on figures rather than gut feeling.
How do I calculate the €/100 km metric for my fleet?
Add up all the variable and fixed monthly costs: fuel, repairs, insurance and the depreciation charge, then divide by the kilometres driven and multiply by 100. The result can be compared with the average fuel costs published by the Lithuanian Energy Agency.
How much can route optimisation with AI planning save?
The assessment shows that AI-based route planning can reduce total cost of ownership by around 8–13%, compared with replacing vehicles alone, which saves around 3%. The difference comes from the planning system reducing empty running and optimising routes, rather than simply upgrading equipment.
What data do I need to calculate TCO?
To calculate total cost of ownership, you need the purchase price, fuel costs, repair and maintenance costs, insurance premiums and depreciation over the entire operating life. The more of this data is collected automatically from fuel cards and your accounting software, the more accurate the result.
Is it worth choosing a ready-made reporting solution instead of building an in-house system?
A ready-made solution, such as the Rivilė Basic package, often pays for itself faster because it already includes KPIs tailored to the transport sector and automatic data refresh. In-house development requires a dedicated analyst and a longer implementation period, which rarely pays off for small or medium-sized companies.