See more. Decide better.
 When Does a Business Need a Power BI Data Warehouse?

A separate analytical warehouse usually becomes necessary when you have several data sources and want Power BI reports that are consistent, fast and reliable. If your accounting data comes from Rivilė or Finvalda, sales from a CRM and stock levels from Excel files, connecting to them directly often produces mismatches and slow reports. A warehouse built on an ETL process and a clear data model brings these sources together into one consistent system, leaving Power BI to act purely as the visualisation layer.
In brief:
- Investing in a data warehouse becomes essential once you have more than three data sources and discrepancies start appearing regularly.
- A warehouse built on a dimensional model and an ETL process provides reliable data consistency for complex reports.
- The choice of technology depends on data volumes and how often data needs integrating; Azure SQL or Synapse are the most common options.
- Cross-checks and data model validation reduce the risk of errors before reports are used for business decisions.
- Basic mistakes can be avoided by defining requirements up front, standardising terminology and monitoring the warehouse consistently.
Contents
- What a ‘data warehouse’ means in the context of Power BI
- When to invest in a separate analytical warehouse: business criteria
- Technology and architecture: Azure solutions and integration options
- ETL/ELT and data modelling: practical steps to ensure reliability
- Implementation steps, timescales and costs: a guide for business leaders
- Analitika360: our solution and the evidence
- How a data warehouse is maintained and updated after implementation
- Data warehouse security and privacy
- Common mistakes when implementing a data warehouse and how to avoid them
- Optimising and scaling Power BI data warehouse performance
- Next steps: order a pilot or contact Analitika360
- Analitika360’s practical perspective: our key recommendation
- Sources
What a ‘data warehouse’ means in the context of Power BI
A data warehouse is a centralised system designed for analysis that collects, organises and stores historical data from different sources. Unlike an operational database, which is optimised for day-to-day transactions (a new order, issuing an invoice), a warehouse is optimised for complex query workloads and long-term analysis.
In practice, this means dimensional modelling. The star schema, in which a fact table (sales, expenses) links to descriptive dimensions (customer, time, product), is the most widely used model for BI scenarios because it offers a simpler structure and faster query performance. The snowflake schema suits cases where dimensions have complex hierarchies and stricter normalisation is needed, but this structure slows queries down.

Power BI essentially works as a visualisation layer. Professional solutions often use an intermediate store, such as an Azure SQL database, to clean and standardise data so that Power BI receives data that is already prepared rather than raw. When you have a single source and simple reports, a direct connection is often enough. When there are several sources and the data does not match up, an intermediate layer becomes essential.
When to invest in a separate analytical warehouse: business criteria
The decision to invest in a warehouse is rarely made for the sake of the technology itself. It is made when specific business warning signs start recurring every month.
- Multiple data sources. Once you have three or more systems (accounting, CRM, warehouse, online shop), combining them manually in Excel becomes impossible.
- Discrepancies in figures. If the finance and sales departments calculate revenue differently, the cause is usually not the accounting but the lack of a proper data model.
- Performance requirements. When a report that used to load in a few seconds now takes minutes, connecting directly to the operational database becomes a bottleneck.
In the short term, tactical fixes are possible, such as Power Query transformations without a full warehouse. But when the need comes up several times a year, it is worth looking at an architectural solution that can support growth.
Technology and architecture: Azure solutions and integration options
Moving to the cloud brings flexibility and faster access management, which is why most companies in the Power BI ecosystem choose Azure solutions. When choosing technology, these are the components that matter to a business:
- Azure SQL Database – the most common choice for mid-sized business warehouses where data volumes are modest.
- Azure Synapse Analytics – suitable when data volumes are growing rapidly or structured and unstructured data need to be combined on a single platform.
- Azure Data Factory – an ETL/ELT orchestration tool that automatically moves data from Rivilė, Finvalda or a CRM into the warehouse on a set schedule.
- Power Query – suitable for lighter transformations directly within Power BI when volumes are small.
Rivilė and Finvalda integrations usually require an intermediate export or an API connection, after which the data is loaded into the SQL warehouse in a standardised format. CRM and Excel sources are connected on a similar principle, although they are often refreshed less frequently.
ETL/ELT and data modelling: practical steps to ensure reliability
A business analytics project typically involves several stages: defining requirements, building the data model, choosing the technology, creating the ETL process and confirming data accuracy. Each stage has its own purpose, and none can be skipped.
The ETL (extract, transform, load) process begins with extracting data from the source systems. The data is then transformed: formats are standardised, duplicates removed and rules applied (for example, how net profit is calculated). Finally, the data is loaded into the warehouse according to a model designed in advance. Power Query and Data Factory are the tools most commonly used at this stage.

Before the technical build, it helps to create a conceptual data model that aligns terminology between the business and IT teams. When the finance manager and the developer understand ‘net profit’ differently, errors in the reports are inevitable.
Expert tip: Before releasing the first report to users, compare at least three figures (for example, total revenue, the VAT amount and the number of customers) taken directly from Rivilė or Finvalda with the warehouse output. If the figures match to the last cent, validation has succeeded.
This reconciliation test, in which warehouse data is compared with the source systems, is the key control that protects against wrong decisions at business level:
- Automated comparison tests after every refresh.
- Control reports showing the number of discrepancies.
- A manual check before the first go-live in the production environment.
Implementation steps, timescales and costs: a guide for business leaders
A typical warehouse implementation project follows a clear sequence, which is worth knowing before you start negotiating with a supplier.
- Requirements gathering – which metrics matter most, which sources are used and who will use the reports.
- Prototype – a report for one department or one metric that tests whether the architecture is sound.
- ETL build – data connections, transformation rules and automation.
- Modelling and validation – the dimensional model and reconciliation tests.
- Deployment and training – user access and putting reports live in production.
For a smaller company with one or two sources, a pilot may take a few weeks. For a larger group with several subsidiaries and complex accounting, the process takes longer, depending on the number of sources and the quality of the data.
The simplest way to measure return on investment is through time saved: how many hours a month the accountant or finance manager used to spend preparing reports manually in Excel, compared with the automated approach and training on interpreting financial ratios. When reports refresh automatically several times a day, that time is usually redirected to analysis rather than data gathering.
Analitika360: our solution and the evidence
Analitika360 integrates data from Rivilė, Finvalda, SharePoint and Excel into a single automated Power BI environment. Reports refresh without any further user involvement, and managers see revenue, costs, profit and other key metrics in real time.
The service packages are tailored to different types of business:
- CockpitCEO – all-round business analytics for managers, covering financial and operational metrics in a single report.
- CockpitSHOPS – analytics tailored to retail chains, with sales and stock monitoring.
- CockpitHR – an HR analytics solution for managers who track workforce metrics.
- Rivilė and Finvalda packages – dedicated report sets built directly from the data in these accounting systems.
Restaurant chains and accounting firms use these solutions because automated reports free up the time previously spent combining data manually in Excel.
How a data warehouse is maintained and updated after implementation
Implementing a warehouse is not a one-off project. When data sources change (a new CRM system, an additional warehouse module, an accounting software upgrade), the warehouse structure has to adapt.
In practice, ongoing support involves several recurring tasks. First, monitoring the ETL processes: when Rivilė or Finvalda update their data structure, connections can break, and this needs to be spotted before a manager opens an empty report. Second, extending the data model: a new metric (for example, a new product category) requires changes to the dimension tables, not just to the Power BI report.
Third, monitoring performance over the long term. As the volume of historical data grows year after year, queries that used to run in seconds may slow down. That is a signal to review indexing or archiving rules.

It is advisable to have a clearly designated person or partner who periodically (for example, quarterly) checks data quality and whether the model still meets business needs. Companies that leave the warehouse to ‘run itself’ without periodic maintenance usually find, within a year or two, that their reports no longer reflect the actual structure of the business. A support agreement with a reliable partner such as Analitika360 allows these changes to be made on an ongoing basis, without waiting until the problem becomes critical.
Data warehouse security and privacy
A data warehouse that holds financial information, sales history and sometimes personal data needs a clear security strategy from the first day of implementation.
Access management is the first layer. Not every user should see every metric. A sales manager may see sales for their own region but not the profit margin for the whole company. Power BI supports row-level security, which lets a single report file show different data to different users according to their role.
Encryption in transit and at rest is a standard requirement when data travels from Rivilė or Finvalda through cloud infrastructure into the warehouse. Azure solutions encrypt data both at rest and in transit by default, but the configuration should be checked rather than simply taken for granted.
Where personal data is involved (customer lists, employee information in the CockpitHR solution), the requirements of the General Data Protection Regulation (GDPR) apply. This means you need to know where the data is physically stored, how long it is kept and who has the right to access or delete it.
A practical principle: for each new integration (a new CRM, a new warehouse module), it is worth reviewing afresh what data is being moved into the warehouse and whether it needs additional protection. Security measures designed for one source do not automatically suit another, especially if the new source contains more sensitive information than the previous ones.
Common mistakes when implementing a data warehouse and how to avoid them
The most common mistake seen in implementation projects is insufficient reconciliation between the operational systems and the warehouse. When automated tests and control reports are not set up from the start, data errors are only noticed once a manager has already made a decision based on the wrong figure.
The second common problem is starting the project with the technology rather than the requirements. The company buys an Azure Synapse licence, but nobody has defined in advance which metrics matter most to management. The result is powerful infrastructure that does not answer real business questions.
The third mistake concerns the data model. When a warehouse is built without a clear dimensional structure, simply by copying tables from the operational system, Power BI reports run slowly and the metrics become hard to understand even for experienced analysts. Companies that skip the data cleansing stage often run into quality problems and inaccurate reports that only come to light after several months of use.
Fourth, the importance of standardising terms is often underestimated. If the sales department calculates ‘revenue’ including VAT and the finance department excluding it, every report will show different figures, even if the technology works perfectly.
A simple rule helps avoid these mistakes: define requirements and terminology first, then build the model, and only then choose the technology. The validation stage before going live should never be cut short in a rush.
Optimising and scaling Power BI data warehouse performance
As data volumes grow, reports that ran quickly with a thousand rows may start to stall at a million. Performance optimisation starts with the data model, not with Power BI settings.
Step one: reduce table width. Every unused column imported into the model increases the file size and slows queries down. Step two: use import mode instead of DirectQuery when data does not change several times a day, as an imported model runs considerably faster within Power BI.
Step three involves aggregation tables. When users mostly look at annual or monthly figures, it is worth creating an aggregated table in advance rather than forcing Power BI to sum millions of rows every time a dashboard is opened.
For scaling, as a company grows and adds new divisions or subsidiaries, Azure Synapse becomes the logical direction because it separates compute from storage. This means processing capacity can be increased only when it is needed, without paying for additional infrastructure all the time.
In practice, companies that regularly monitor report load times and model size spot problems before they become critical. A periodic model review, say every six months, is a cheaper option than an urgent architectural overhaul once users are already complaining about slow reports.
Next steps: order a pilot or contact Analitika360
Analitika360 is an alternative to building a data warehouse yourself from scratch: you get a ready-made integration with Rivilė or Finvalda, automated reports and a package tailored to your industry, rather than months of architectural design.
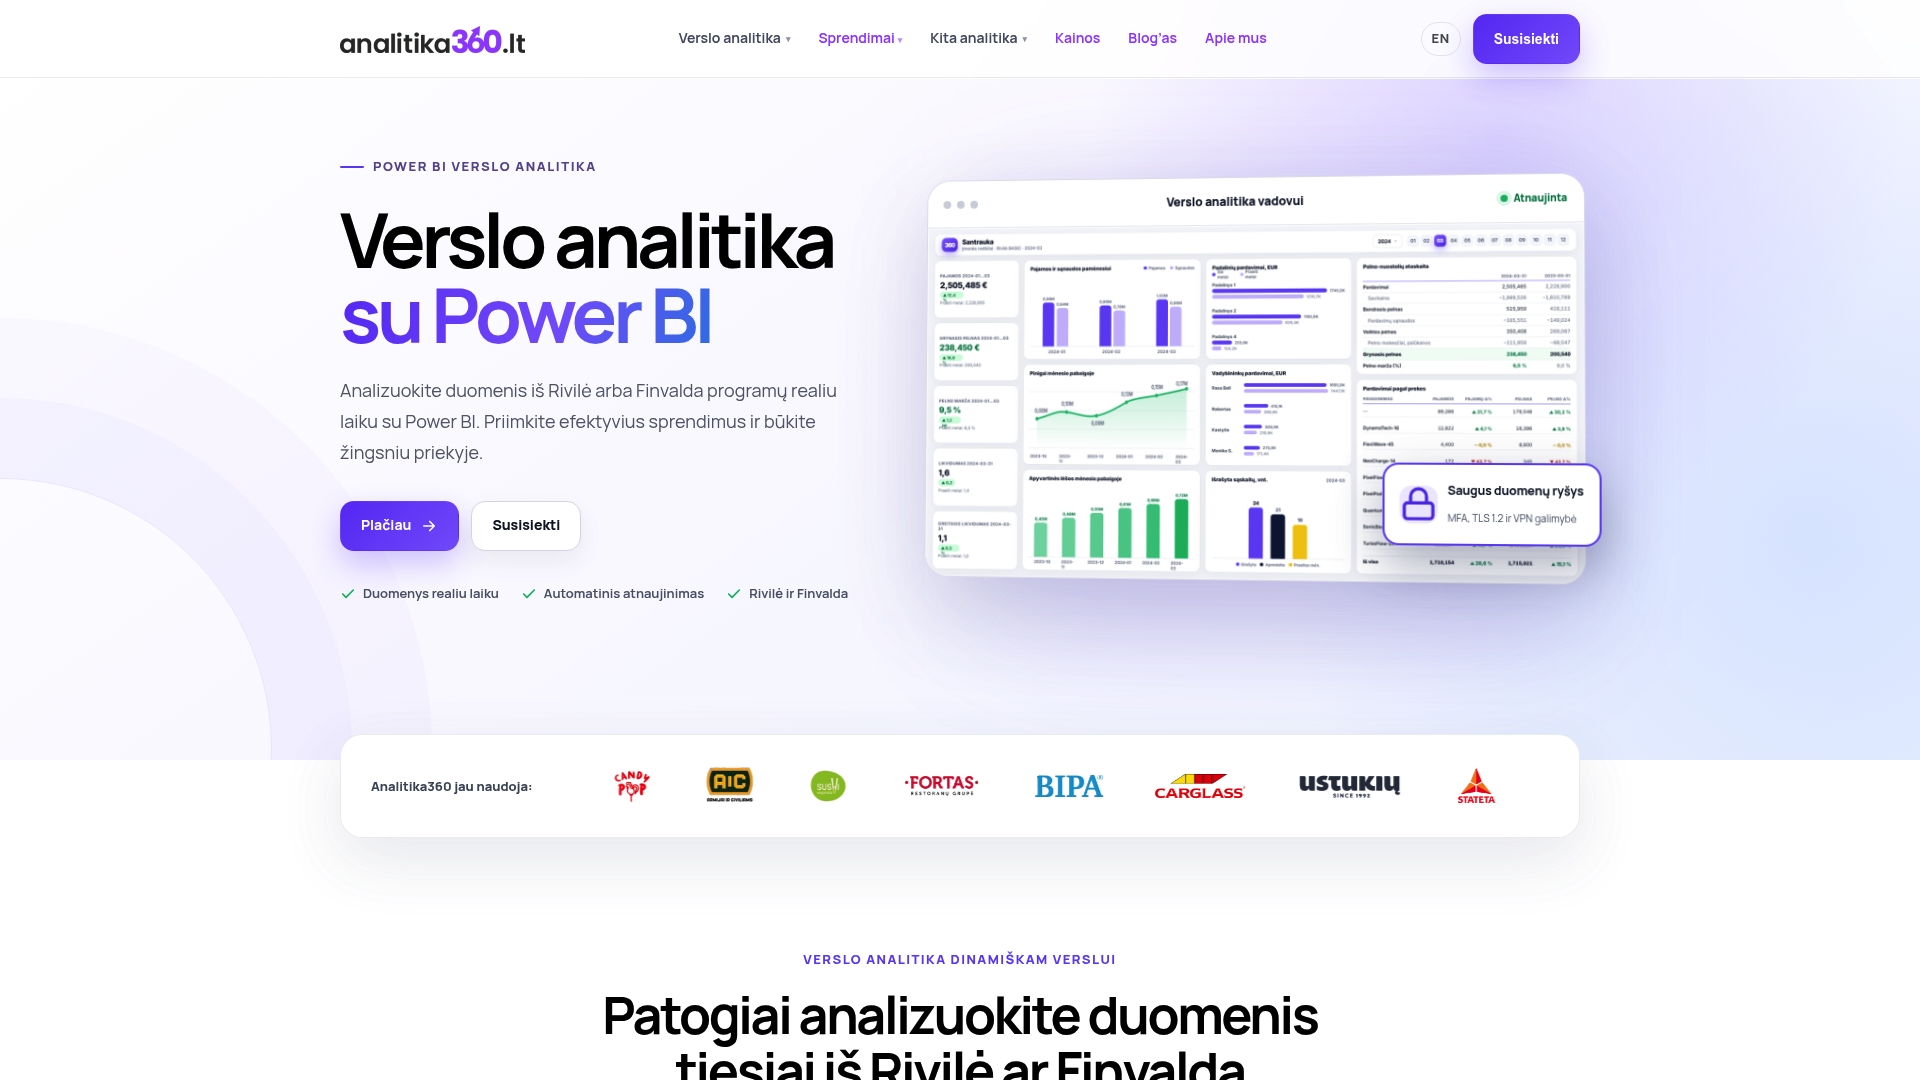
The offer includes data integration from accounting systems, SharePoint and Excel, automated report refreshes and a choice of ready-made packages such as CockpitCEO or specialised solutions for restaurants, logistics and construction. If you are not sure whether the architecture will suit your systems, the quickest way to find out is a pilot project: a small proof-of-concept report covering one or two of your most important metrics within a few weeks, rather than the whole system at once.
Browse all our business analytics solutions by sector and get in touch for a tailored proposal designed around your accounting system and data sources.
Analitika360’s practical perspective: our key recommendation
The biggest mistake we see in the market is trying to build the ‘perfect’ warehouse for every metric straight away. Start with a single pilot covering two or three clear KPIs, such as revenue and profit margin, and only expand the model once validation has succeeded. As a next step, we invite you to contact the Analitika360 solutions team to arrange a demonstration.
— Analitika360