
Supply chain reports: what you must include and how to prepare them

A supply chain report should cover materials and production data, environmental impact metrics including Scope 3 emissions, and traceability information about your supplier chain. Before you collect any data, start with a materiality assessment, guided by the ESRS guidance, to establish what actually matters for your business. Only then is it worth building an automated reporting template that refreshes itself without constant manual work.
In brief:
- When refining Scope 3 emissions, sector averages or industry benchmarks are often used where supplier data is unreliable or missing.
- A materiality assessment lets you limit the scope of the report to the most significant impacts and risks, as the ESRS set out clear methods for the assessment.
- Introducing automated data collection lets reports update themselves, reducing manual work and keeping data consistent.
- For smaller suppliers, voluntary standards such as the VSME are recommended, as they simplify data submission and reduce the administrative burden.
- Digital Product Passport (DPP) metadata is built into reports, making it possible to link certificates and compliance documents to a specific product.
Contents
- What types of data to include in a supply chain report
- Materiality and the legal context: ESRS, CSRD, VSME and the Omnibus I changes
- How to collect data from suppliers and prepare an effective data request
- Technology and data integration: ERP, DPP, IoT and automated reports
- KPIs and report templates: what to track and how to structure the report
- Practical demonstration: how automated Power BI reports bring supply chain data together
- Editor’s perspective: a strategic plan for rolling out supply chain reporting
- How Analitika360 can help you prepare and automate supply chain reports
- Frequently asked questions
- Sources
What types of data to include in a supply chain report
Auditors and sustainability teams expect to see specific, structured blocks of data rather than general descriptions. Each block has its own purpose and its own data source, so it pays to separate them from the outset to keep the structure of the report from becoming chaotic.
Material composition data shows what a product is made of and whether it contains hazardous chemical substances. This block is usually needed for both regulatory and customer safety purposes, so it is worth keeping it as a separate field linked to a specific product code.
Production process data covers production sites, capacity and any impurities or deviations from specification. This data lets you trace exactly where a product was made and is essential when you need to demonstrate compliance with a particular standard.
Environmental impact metrics cover emissions, water use and waste volumes. These indicators are often collected from different suppliers with varying degrees of accuracy, so it is worth defining in advance which units of measurement and periods will be used throughout the report.
The key fields to include in the report template:
- Material composition and a list of hazardous substances by product code.
- Production site, capacity and a log of quality deviations.
- Direct emissions (Scope 1) and emissions from purchased energy (Scope 2).
- Indirect emissions in the supply chain (Scope 3), kept separate from Scope 1 and 2.
- Water use and waste generation indicators per unit of production.
- Traceability markers: batch number, country of origin, logistics route.
Scope 3 often causes the most difficulty because it depends on the quality of third-party data. In the report, it is worth showing this category separately from direct emissions and indicating which figures are exact and which have been calculated using average values.
Metadata from the Digital Product Passport (DPP) is also becoming an important part of the report. The DPP acts as a digital container holding information about a product, recorded in a common EU registry and accessible through a unique identifier. As the DPP is being introduced in stages for different product categories, it is worth providing now for the fields that will later let you link certificates and compliance documents to a specific product.
Materiality and the legal context: ESRS, CSRD, VSME and the Omnibus I changes
The legal basis for sustainability reporting in the EU rests on several interrelated documents that are worth understanding before you start collecting data. The Corporate Sustainability Reporting Directive (CSRD) determines which companies are required to report, while the European Sustainability Reporting Standards (ESRS) specify what must be disclosed and how.
The materiality assessment is the starting point for the whole process. The ESRS state that reports must disclose those impacts, risks and opportunities that are material to the business or its environment, and the assessment can be approached from two directions.
- Top-down approach: you start with the strategic business risks and opportunities, then identify which elements of the supply chain relate to them.
- Bottom-up approach: you analyse specific products, processes and suppliers and derive general risk categories from them.
- Combination: most companies use a mix of both approaches, cross-checking their conclusions.
- Documentation: every materiality decision must be justified and recorded, as auditors will examine this process separately from the data itself.
The materiality principle lets you limit the scope of the report to what genuinely matters, rather than collecting every possible data field from every tier of the supply chain.
The Omnibus I changes, taking effect from the 2027 financial year, provide for a revision of the ESRS and additional proportionality measures that should reduce the reporting burden for some companies. One of the most important changes directly affecting supply chain reporting is the so-called value-chain cap: larger companies may not demand more data from their smaller suppliers than is provided for in the Voluntary Sustainability Reporting Standard for small and medium-sized enterprises (VSME).
The European Commission has recommended the VSME as a voluntary standard designed to simplify data submission for smaller suppliers, and this step directly reduces the administrative burden across the entire supply chain.
Where specific supplier data cannot be obtained, or its accuracy cannot be relied upon, sector averages or other proxy indicators may be used. Such substitute figures must be based on reasonable and reliable information rather than chosen at random, because auditors check not only the figures themselves but also the logic behind where they came from.
How to collect data from suppliers and prepare an effective data request
The biggest obstacle in preparing a supply chain report is usually not the methodology itself but obtaining data from suppliers, who have their own priorities and limited resources. A well-prepared request reduces resistance and speeds up responses.
The request template should have a clear structure and accept standardised formats, such as XBRL, CSV, an API connection or a QR code linked to the product. The fewer free-text fields there are, the easier it is for the supplier to respond and the easier it is for your team to process the data received.
- Set a specific response deadline and a reminder sequence in case the supplier does not reply within the agreed time.
- Offer a short training session or guide on how to complete the template, particularly for smaller suppliers.
- Following VSME principles, allow smaller suppliers to submit a simplified data set instead of a response covering the full CSRD scope.
- Document every case in which a supplier declines to provide data, and state which alternative source you used instead.
- Periodically check the consistency of the data received by comparing it with values from previous periods.
Where a supplier objects or cannot provide exact figures, the alternative is to use sector averages or indicators published by industry associations. Such a substitute source must be marked in the report as an estimate rather than a primary measurement.
Pro tip: before sending the request to all your suppliers, test the template with two or three of the largest, as their feedback usually reveals formatting problems that are worth fixing before dozens of smaller partners notice them.
For audit reliability, it helps to store not only the final figures but also their source: who provided the data, when and in what format. This lets you answer auditors’ questions quickly and reduces the risk of the report being challenged over an opaque methodology.
Technology and data integration: ERP, DPP, IoT and automated reports
Collecting data from dozens of suppliers by hand becomes impossible once the supply chain grows beyond a handful of partners. The technical architecture determines whether the report updates itself or whether a spreadsheet has to be pieced together again from Excel files every quarter.
Such an architecture is usually made up of several classes of tool:
- ERP systems, which hold purchasing, inventory and production data.
- TMS (transport management) systems, which record logistics routes and delivery times.
- IoT and RFID sensors, which collect real-time data on conditions during production or transport.
- DPP registrars, which store product metadata and certificates in a digital registry.
- Business intelligence (BI) platforms, such as Power BI, which bring all the sources together into a single reporting model.
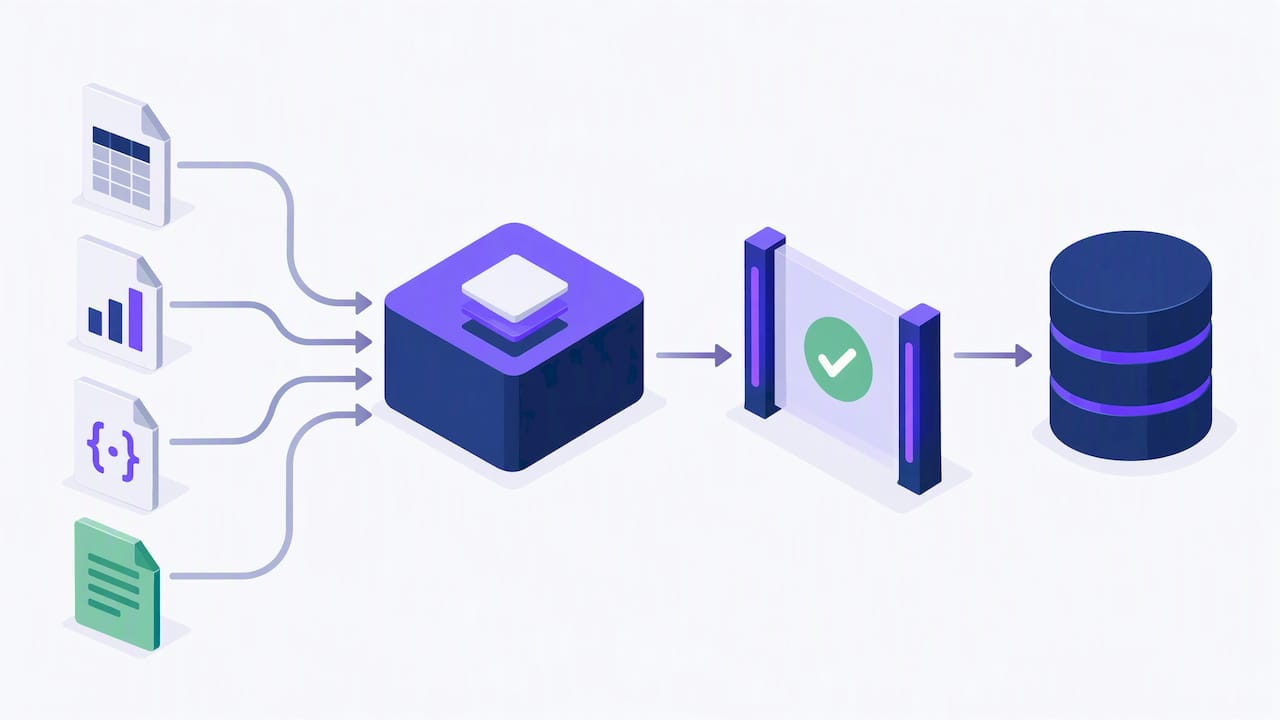
The recommended data architecture relies on a single trusted data source from which all figures are derived, so that different dashboards do not show different values for the same metric. ETL or ELT processes play an intermediate role here: data is extracted from the various systems, transformed into a common format and loaded into the analytics model. API connections between ERP and BI solutions allow this process to be automated without moving files around manually.
A real-time data stream is rarely needed: it is usually justified only for critical operational metrics such as warehouse stock levels or delivery status, as described in the technology sector overview. For sustainability and compliance reports submitted quarterly or annually, a batch data refresh, for example nightly or weekly, is sufficient and cheaper.
In practice, the most common technical problem is incompatible data formats: one ERP system exports dates in one format, another in a different one, and the supplier’s file arrives in a third. Introducing a standardised ETL process with clear data validation rules solves this problem at once, instead of having to correct errors by hand in every reporting cycle.
KPIs and report templates: what to track and how to structure the report
A good supply chain dashboard has to answer different questions for different audiences. The operations manager cares about speed, the finance director about costs and the sustainability team about environmental impact, so a single report rarely serves everyone equally well.
- Operational KPIs: days of inventory (how many days stock will last without replenishment), delivery accuracy (the share of orders delivered on time) and the delay rate.
- Financial KPIs: logistics costs per shipment, additional costs related to environmental impact, and costs allocated to each stock-keeping unit (SKU).
- Sustainability KPIs: Scope 1, Scope 2 and Scope 3 emissions, each shown separately, water consumption and the volume of waste generated.
- Dashboard structure for management: summary indicators, trends over several periods and risk flags, without excessive detail.
- Dashboard structure for operations: detailed data on specific suppliers, routes and batches, with the option to filter by date.
- Dashboard structure for the sustainability team: emissions broken down by category, materiality flags and data quality indicators (exact figure or proxy).
Automation settings here mean the rules by which the dashboard refreshes itself whenever the primary sources are updated, without having to reload the report or rewrite formulas each time.
Practical demonstration: how automated Power BI reports bring supply chain data together
Working with companies that keep their accounts in Rivilė or Finvalda, we see how important it is to bring financial data and operational supply chain indicators together in one place. Data on purchases, costs and logistics held separately rarely gives the full picture needed for decision-making.
Power BI solutions can combine data from accounting software with additional sources, such as SharePoint or Excel files, which may contain supplier data on material composition or production batches. Bringing these together lets you see both the financial and the operational side of the supply chain in a single report.
- Automatic data refresh, with no further input from the user, whenever the primary sources change.
- Visibility of key indicators.
- The ability to combine several data sources into a single analytics model, instead of separate, unconnected tables.
- Tailoring to specific industries, whose supply chain structures may differ.
Automated reports that refresh without extra work from users let teams save time and focus on the analysis itself rather than on preparing data. Each package is tailored to the specific accounting system, so the most important thing at the start of implementation is to pin down exactly which sources need to be connected.
Editor’s perspective: a strategic plan for rolling out supply chain reporting
Most companies try to build an all-encompassing supply chain report in one go, and that is the biggest strategic mistake. The right path starts with a materiality assessment and a minimum working version of the report containing only the data that genuinely influences decisions.
The second misstep is demanding the same level of data detail from every supplier, regardless of their size. VSME principles and sector averages exist so that smaller suppliers are not overloaded with requirements beyond their capabilities, so it is wiser to apply different levels of rigour depending on supplier size than to lose a partner because of an excessive administrative burden.
The third priority is automation, but only of the rules that deliver a quick return: data refresh, recurring calculations and dashboard synchronisation. Complex, rarely used rules should be automated last, as their cost often exceeds the time saved.
— Analitika360
How Analitika360 can help you prepare and automate supply chain reports
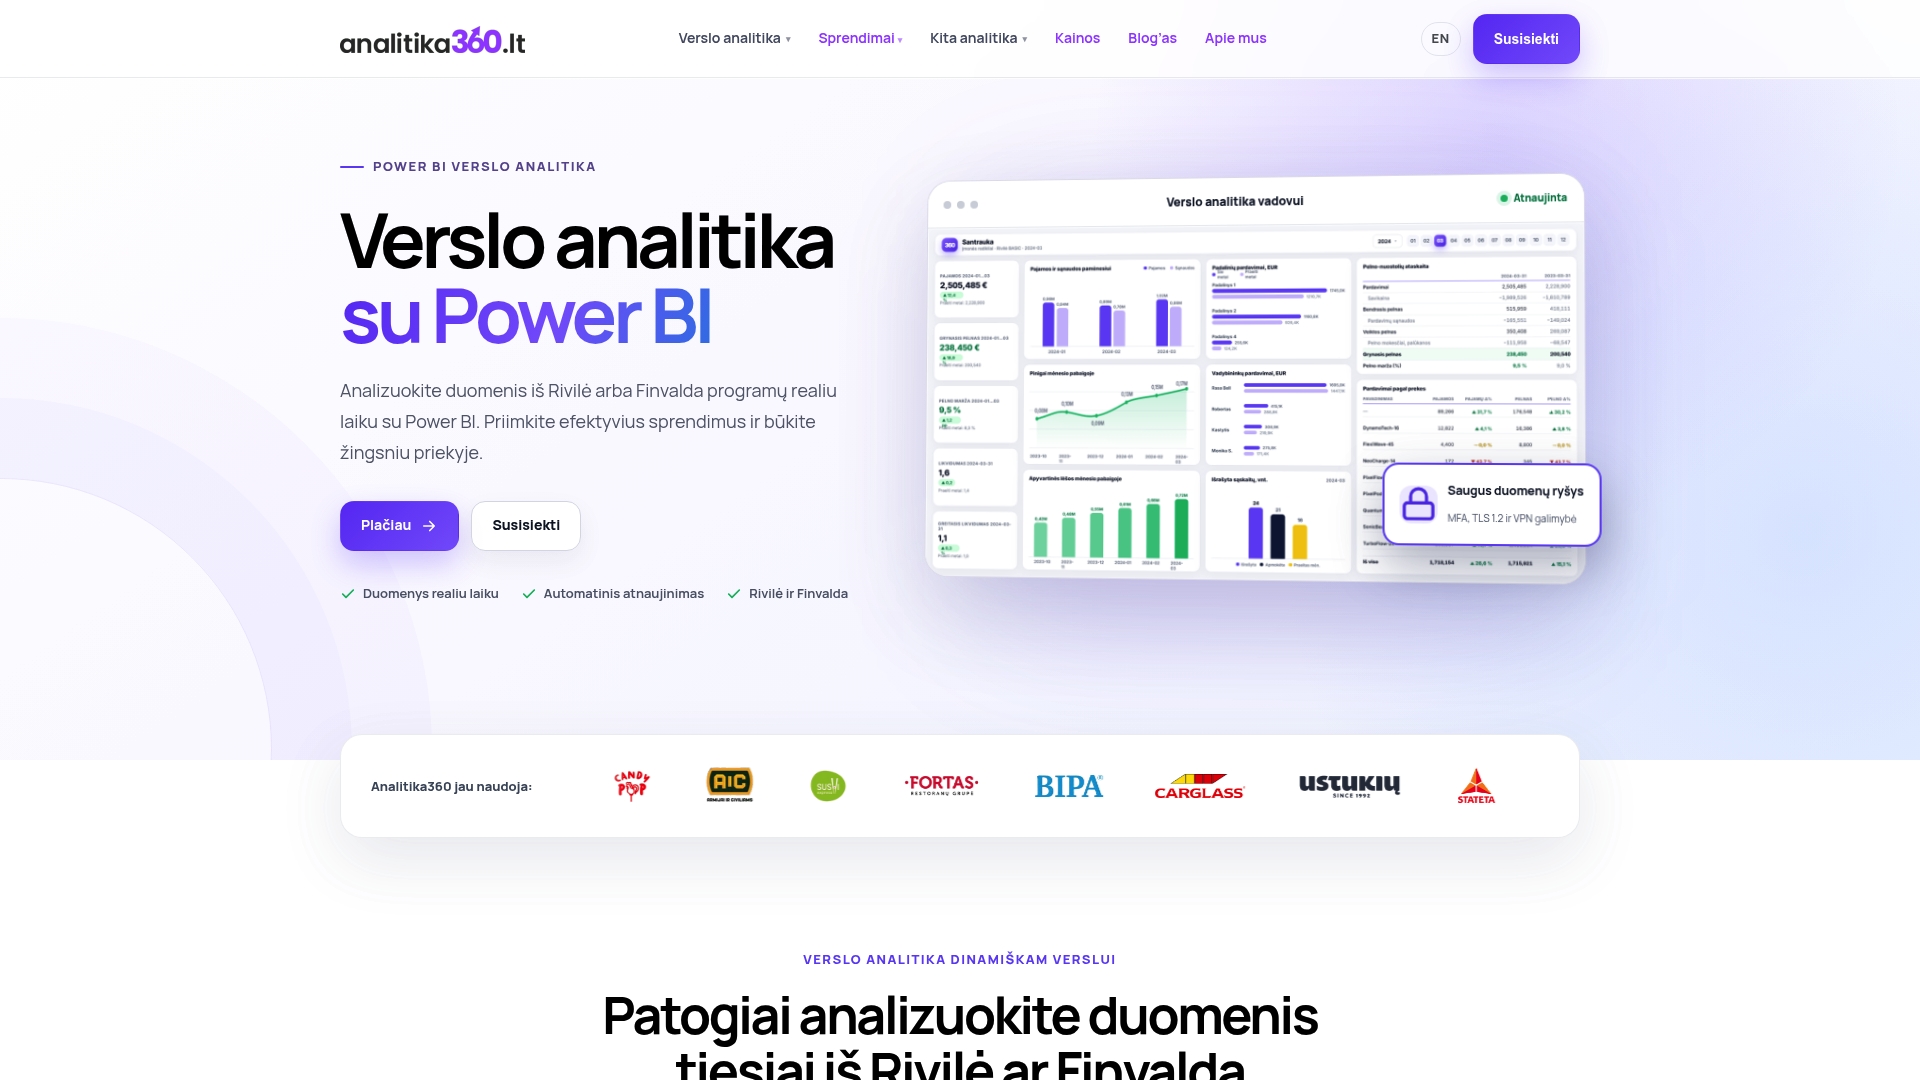
Supply chain reports become much simpler when financial and operational data are already combined in a single analytics system rather than scattered across several programs. Our Power BI packages for Rivilė and Finvalda users address exactly this problem, as they combine accounting data with additional sources and update reports automatically.
Our range of solutions includes:
- Rivilė Basic and Rivilė PRO packages for companies of different sizes using the Rivilė accounting software.
- Finvalda Basic and Finvalda PRO packages for Finvalda users on the same basis.
- Bespoke projects where reports need to be adapted to a specific supply chain structure or to additional systems, such as CRM or logistics platforms.
Every implementation begins with an assessment of your existing data sources, so that the model is built precisely around your processes rather than from a generic template. If you would like to see how this would work for your company, take a look at our pricing and services information and get in touch to arrange a consultation.
Frequently asked questions
What is a materiality assessment in a supply chain report?
A materiality assessment is the process of determining which impacts, risks and opportunities are significant enough to be disclosed in the report. The ESRS allow the assessment to be carried out in different ways, and the outcome defines the scope of the report.
What is the VSME and who is it for?
The Voluntary Sustainability Reporting Standard for small and medium-sized enterprises (VSME) is a simplified standard proposed by the European Commission to help smaller suppliers respond to data requests from larger partners. The Commission recommends the VSME as a way to reduce the administrative burden without requiring small companies to provide a data set covering the full CSRD scope.
What is a Digital Product Passport (DPP)?
The Digital Product Passport (DPP) is a digital container holding information about a product, recorded in a common EU registry and accessible through a unique identifier. The DPP will be introduced in stages, depending on the product category, under the Ecodesign Regulation.
How do you calculate Scope 3 emissions when a supplier does not provide exact data?
Where exact supplier data is not available, sector averages or other proxy indicators based on reasonable and reliable information may be used. Such figures must be marked in the report as estimates, kept separate from data supplied directly by the supplier.
How much does an automated supply chain reporting solution cost?
Our Power BI packages for Rivilė or Finvalda users start from €59 a month for the Basic version or €89 a month for the PRO version. Bespoke projects tailored to a specific supply chain structure cost €70 an hour.