
Automate Your Finvalda Debt Reports in 1–2 Weeks

Yes, Finvalda provides detailed debt reports and lets you automate them. The system covers debts as at a given date, receivables settlements, debt turnover and a payment plan for creditors, while reconciliation statements and reminders can be generated and sent automatically. That means less manual work in the accounts department and a lower risk of errors when settling with customers. Companies that need deeper analysis can also move the data into Power BI with help from Analitika360.
In brief:
- Without a data check, inconsistently formatted customer records can cause errors in the automated debt report.
- Automatic reminders and reconciliation statements cut manual work and errors, saving around 90 per cent of the time spent.
- When exporting data to Power BI, you must use unique identifiers to avoid records being joined incorrectly.
- The first steps towards automation are checking data quality, running a test send and assessing the results before a wider roll-out.
- When debt analysis calls for comparing several periods or several business units, it is worth considering deeper integration with Power BI.
Contents
- Overview of Finvalda debt reports: which metrics are available
- Automated debt management features in Finvalda
- How to prepare your data so automation works correctly
- Export and integrations: from Finvalda to Power BI
- Action plan: from set-up to full automation
- Configuration and data quality requirements for automation
- Analysing the latest period and comparing it with earlier periods
- The most common mistakes in debt reports and how to avoid them
- The Analitika360 view: when it is worth going a step further
- Power BI report packages for Finvalda data
- Sources
Overview of Finvalda debt reports: which metrics are available
Finvalda gives the finance manager several views of debt, which can be looked at separately or combined into a single picture. The standard functionality in the MINI, MIDI, MAXI and WEB editions includes the following debt reports:
- debts as at a date – shows how much a particular customer or supplier owes at a chosen point in time;
- settlements with creditors – shows the company’s obligations to suppliers and partners;
- creditor payment plan – helps you anticipate upcoming payments and avoid delays;
- debt turnover – reflects how quickly debts are paid over a chosen period;
- receivables settlements and current debts – details who still owes what.
These reports can be viewed through the report tree, where they are organised into groups with dynamic filter windows. According to the WEB edition documentation, the user picks the fields to filter by (for example customer, period or currency) and the system produces a summary report. Exporting the data makes sense when you need to share it with management, the bank or your auditors, or when you plan to combine the report with other analytics sources.
Automated debt management features in Finvalda
Automation in Finvalda is not just a set of separate buttons. It is a complete workflow that replaces manually drafting reconciliation statements and sending reminders with a systematic mechanism that runs continuously. Here is what it looks like in practice:
- Generating debt reconciliation statements – the system automatically produces reconciliation statements for selected customers or periods, with no need to copy data by hand from one report to another.
- Preparing and sending reminders – based on the filters you set, Finvalda automatically generates reminders and emails them to customers, taking into account how overdue the payment is or the size of the debt.
- Monitoring payment plans – the system lets you create payment plans for creditors, track whether the agreed schedule is being followed and automatically prepare reports on deviations.
- Integration with Teisininkas.pro – for companies where reminders do not produce results, Finvalda offers automated risk assessment and real-time monitoring, which reportedly can save up to 90% of the time spent on debt administration.
The practical result is that an accountant who used to prepare reminder letters by hand every week now spends that time on analysis rather than retyping documents. Errors fall not only because of the automation itself, but also because the system always uses the same pre-checked templates and conditions.
How to prepare your data so automation works correctly
Automation does exactly what you tell it to, so the weak point is usually not the Finvalda system itself but the data you feed into it. Before you start sending reminders, check a few things:
- Customer records in order – make sure email addresses, payment terms and contract conditions are entered in the same format in every record.
- Filter logic – define clearly which terms, customer groups or currencies are included in automatic sending, and which contracts must be exceptions (for example deferrals or individual payment schedules).
- Test period – first run the automation with a small group of customers, and only extend it to the whole customer base after a successful test.
- Checking email logs – after each test send, review the logs of the automatic emails to make sure the reminders reached the right recipients.
The most common mistake companies run into is leaving out contractual exceptions. If a customer has an individual payment schedule and the system does not know about it, they may receive a reminder about a debt that does not actually exist yet. That undermines trust in the automation faster than any technical hurdle.
Pro tip: Before activating mass reminder sending, set up at least three test scenarios with different contractual exceptions (a deferral, a part-payment schedule, a disputed amount) and check whether the system responds correctly in each case rather than applying the general rule.
Export and integrations: from Finvalda to Power BI
Finvalda reports can be exported to XLS, CSV and PDF, which opens up the option of moving the data into a broader analytics system. For bookkeeping, the standard report is usually enough, but for strategic decisions, where you need to see the links between debt, liquidity and sales, Power BI-type solutions provide more useful visualisation.
For exported data to integrate properly into an analytics system, it is worth defining the key fields in advance:
- a unique customer or account identifier;
- the debt date and payment due date;
- the amount and currency;
- the invoice number.
These identifiers let Finvalda records be matched precisely with bank transfer or CRM data in an analytics report, rather than relying on name matching alone, which often produces false matches. At this stage Analitika360 offers two levels of solution: the Basic package, covering the main debt and revenue metrics in a single report, and the PRO package, with broader segmentation and automatic refresh with no further intervention.
Action plan: from set-up to full automation
Moving from manual debt administration to an automated process usually takes one to two weeks, provided your data is already in order. The steps are as follows:
- Check data quality in customer records: email addresses, terms, contract conditions.
- Create a test group of 10–20 customers with different payment profiles.
- Configure the filters for reminders and reconciliation statements, separating standard cases from exceptions.
- Run a trial send and review the email logs and customer responses.
- Assess the results after a week, and only then switch on automation for the whole customer base.
If at this stage you notice that you need not only reminders but also broader debt analysis alongside other financial metrics, that is a signal to call in Analitika360 for a consultation on Power BI integration.
Configuration and data quality requirements for automation
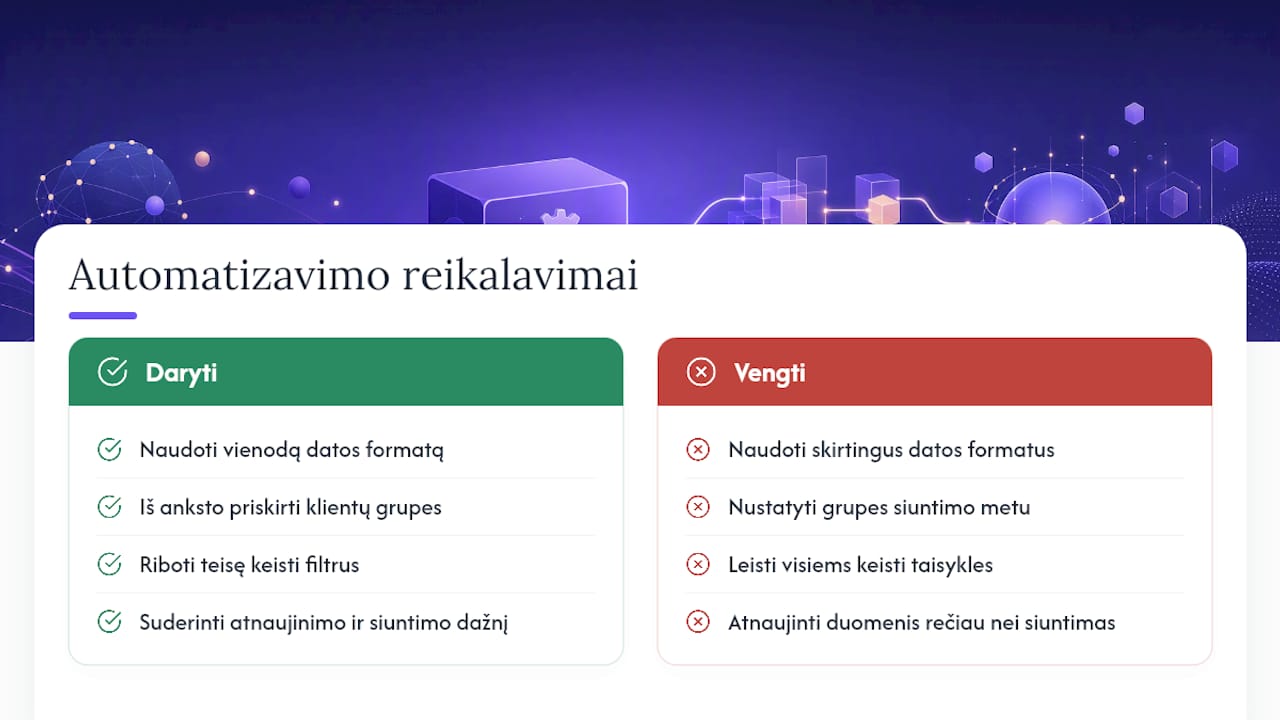
Automation in Finvalda relies on structured data, so any inconsistency in customer records directly affects the accuracy of the reminders sent. The first requirement is a consistent date format across all records, because the filters calculate the due date from the value recorded in the system, not from what the accountant ‘had in mind’.
The second requirement is clearly assigned customer groups. If different customer segments receive reminders at different intervals (for example weekly for wholesalers and monthly for retailers), the groups must be flagged in the system in advance rather than decided ad hoc at the time of sending. The third requirement concerns user permissions: it is advisable to allow only a limited number of staff to change filters and sending rules, because every ill-considered change can affect hundreds of letters already prepared.
The fourth, often forgotten, requirement is a regular data refresh frequency. If debt balances are updated in the system only once a week but reminders go out daily, the automation will start repeating the same reminders for invoices that have already been paid. Ideally, the data refresh and the reminder frequency coincide, or the refresh happens more often than the sending.
Analysing the latest period and comparing it with earlier periods
A debt report only becomes valuable when it is seen in the context of time, not as a single figure. In one month a large receivables balance may reflect a seasonal spike; in another, if the same amount recurs three months in a row, it signals a systemic problem with a particular customer or an entire segment.
In the Finvalda report tree you can select several periods at once and compare current debts with the previous quarter or the same period last year. This lets you tell an occasional delay apart from a recurring pattern of behaviour. A finance manager should record the debt turnover figure every month and watch whether it is rising, falling or standing still, because this metric reflects the real situation better than a one-off debt total.
When this kind of comparison has to be done for several periods and several business units at once, the standard Finvalda report becomes awkward, because each period has to be exported separately and combined by hand. That is the point at which it makes sense to think about a broader analytics system that shows period comparisons automatically, with no extra work in Excel.
The most common mistakes in debt reports and how to avoid them
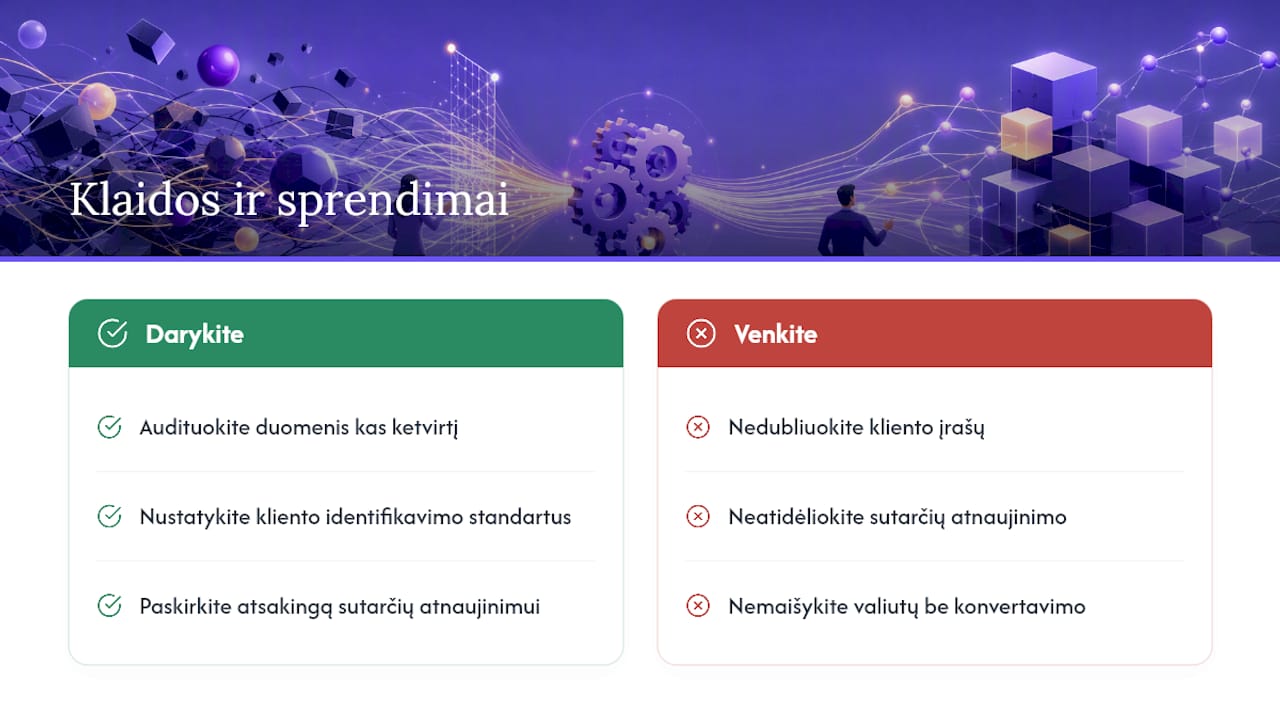
Most problems with debt reports stem not from the system’s limitations but from how it is used. The first common mistake is duplicate customer records, where the same customer appears in the system under two different names or codes. In that case the debt is split across two records and the report shows a lower total debt than there really is.
The second mistake is outdated contract terms that were not updated in the system after negotiations with the customer. If a customer was granted a longer payment term but this is not reflected in the system, an automatic reminder goes out unjustifiably early, which harms the customer relationship.
The third mistake is careless mixing of currencies, where international customers pay invoices in different currencies and the report adds them up as if they were the same. In such cases it is worth turning to specialised accounting guides on currency conversion, which explain how to record exchange rate changes on invoices correctly.
The solution in all three cases is similar: a regular data audit every quarter, clear customer identification standards and at least one person responsible for updating contract terms in the system immediately after negotiations, not a month later.
The Analitika360 view: when it is worth going a step further
Finvalda’s automation is usually enough for a company with a single business unit and a stable number of customers. But when you need to see debt data alongside sales, inventory or liquidity metrics, or when you run several business units at once, the standard reports become too narrow. That is when Power BI visualisation reveals causal links that simply do not show up in a table, such as how late payment by a particular customer correlates with how often they place orders. If you recognise your own situation here, it is worth talking about what more your data can show.
— Analitika360
Power BI report packages for Finvalda data
For companies that find Finvalda’s standard reports insufficient, Analitika360 builds a Power BI solution that works directly with your Finvalda database.
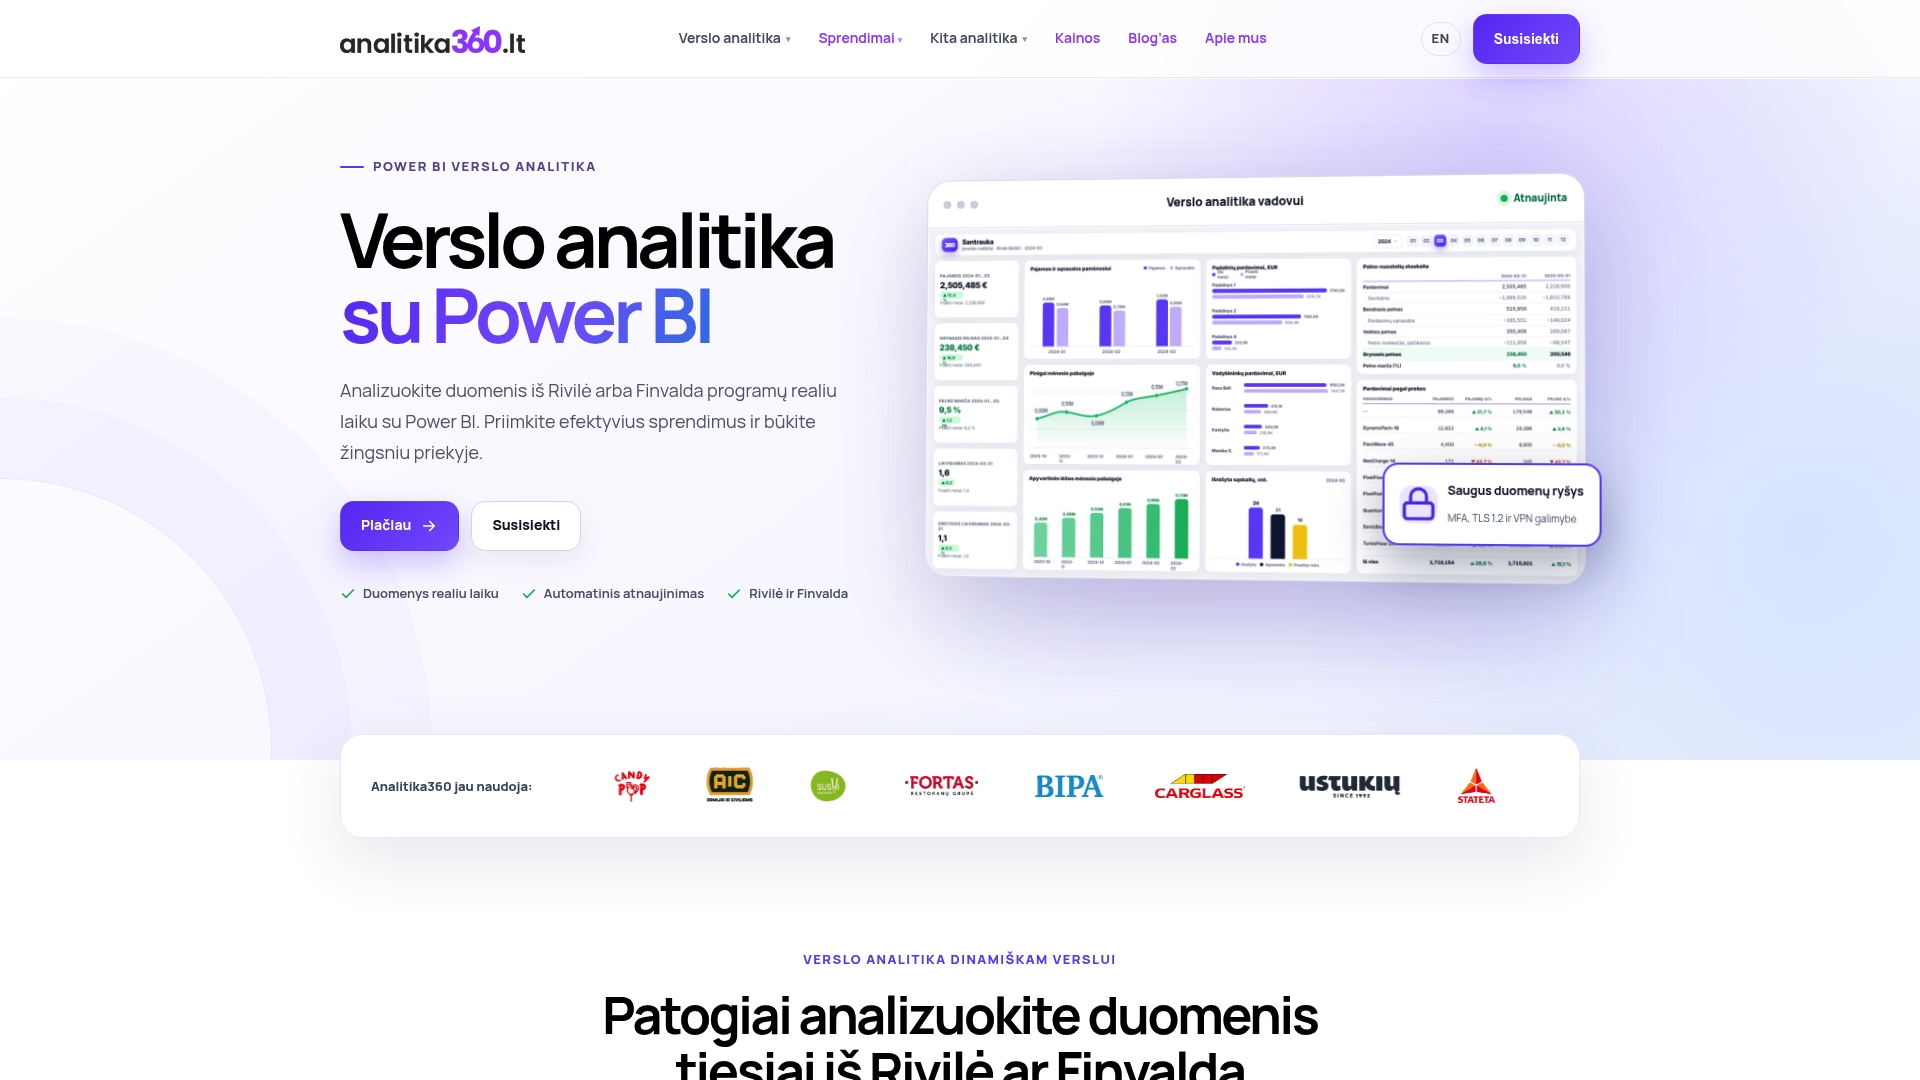
The Power BI Analytics for Finvalda Basic package gives you debt, revenue and expense metrics in a single, automatically refreshing report, with no need to export data by hand every month. For more complex company structures that need period comparisons and segmentation by customer group or business unit, the PRO package with Finvalda integration is the right fit, combining debt analytics with liquidity and sales data. If you would like to see what such a report looks like before deciding, the Power BI report examples show the actual structure, not just the concept. Get in touch to arrange a short demo, where you will see how your Finvalda data would look in an automated analytics system.
Sources
The Finvalda debt report features and automation options are confirmed by the Finvalda MAXI documentation and news items on automating reconciliation statements and reminder sending. You can see how Finvalda data looks in Power BI on the Analitika360 solutions page.
- Finvalda MAXI business management system | FINVALDA
- Automating debt reconciliation statements and debt reminders | Finvalda
- Finvalda integration with Teisininkas.pro | Finvalda