See more. Decide better.
 CRM and Power BI Integration: How to Turn Data into Analytics

Yes, Power BI is the best tool for analysing CRM data. A CRM system stores operational records, and Power BI turns them into interactive reports with real-time metrics. How you connect your CRM to Power BI depends on data volume and how often you need it refreshed:
- For small and medium-sized businesses, Import mode with the Dataverse connector is usually the right fit.
- When you need real-time data, DirectQuery is worth choosing, despite the performance trade-offs.
- For large data volumes, Azure Synapse Link for Dataverse is the best solution.
If you want to get going quickly without building the model yourself, a ready-built report package from Analitika360 lets you launch in a few days rather than weeks.
Key takeaways
Power BI only becomes an effective CRM analytics tool when the architecture (Import, DirectQuery or Synapse Link) matches your data volume and refresh requirements.
| Point | Details |
|---|---|
| Choosing a connection | Choose the Dataverse connector, ODBC/API or CSV export according to your CRM system and refresh needs. |
| Data model | Use a star schema with fact and dimension tables so that DAX measures run quickly. |
| Architecture decision | Import suits up to a million records, DirectQuery real-time needs, Synapse Link large volumes. |
| Report priorities | Start with sales funnel, sales rep performance and customer segmentation reports. |
| Quick start | Analitika360’s ready-built report packages with Rivilė and Finvalda integration let you launch the system in days. |
Contents
- What a CRM–Power BI connection gives you that standard reports do not
- How to connect your CRM to Power BI
- Preparing and modelling data in Power BI
- Import, DirectQuery or Azure Synapse Link: which architecture should you choose?
- Which CRM reports are worth building in Power BI
- How much time and money a Power BI rollout with CRM takes
- The Analitika360 solution: ready-built Power BI packages for CRM analytics
- Why most CRM and Power BI rollouts take longer than they need to
- How to get started without the risk of building the model yourself
- Sources
What a CRM–Power BI connection gives you that standard reports do not
A CRM is not a business analytics tool. It stores deals, contacts and activity records, but it rarely lets you compare that data with accounting figures in one place. Power BI brings the CRM, the accounting system and other sources together into a single analytical model and recalculates the metrics automatically whenever the data refreshes.
The difference becomes obvious in practice:
- The CRM shows how many deals are in the funnel today; Power BI shows how the funnel has changed over the past 12 months by sales rep, product or region.
- A CRM report rarely combines sales data with the actual margin from the accounting system; a Power BI model does this automatically.
- Visualisations (heat maps, trend lines, drill-down tables) are usually unavailable in CRM systems, or very limited.
When is it worth moving from Excel to Power BI? When you prepare reports by hand more than once a week, or when your data comes from more than one source. At that point Excel becomes an obstacle rather than a tool, and a Power BI model pays for itself within a single reporting cycle.
How to connect your CRM to Power BI
The choice of connection depends on which CRM system you use and how often you need updated data. There are four realistic options:
- Dataverse / Dynamics 365 connector. Microsoft recommends this connection as the single source of truth, allowing Power BI reports to be embedded directly in Dynamics 365 workspaces. The advantage is deep integration; the limitation is that it requires a Dataverse licence and a certain amount of technical preparation.
- Direct connectors or ODBC/API. Useful when the CRM (for example, the Rivilė CRM module) has its own API or ODBC bridge and you need frequent, but not necessarily second-by-second, refreshes.
- CSV/Excel export or an ETL solution. The quickest start when you want to see first results within a week rather than after a month-long rollout. Suitable for a pilot project before full integration.
- A ready-built data model with prepared Power Query transformations, when the data already comes from a known source such as Rivilė or Finvalda.
Your choice of authentication has a direct impact on security. The Power Query documentation explains that Dataverse and most business connectors support OAuth2, which is more secure than shared service usernames.
Pro tip: Do not use a shared administrator login for Power BI refreshes. Create a separate service account with limited permissions solely for this purpose, so that the audit trail stays transparent and access restrictions remain under control.
Preparing and modelling data in Power BI
Raw CRM tables are rarely suitable for direct analysis. Before you build visualisations, the data needs to go through Power Query:
- Remove unused columns at the import stage so the model stays lightweight.
- Filter out old, irrelevant records (for example, deals closed before a certain date) if they fall outside the analysis period.
- Align key fields across sources, such as the customer ID in the CRM and the account number in the accounting software.
Next comes modelling. The best practice for visualising CRM data is a star schema: a fact table of deals linked to dimension tables (customers, products, sales reps, time). This structure lets DAX measures run quickly even with tens of thousands of rows.
DAX measures, such as Konversijos rodiklis = DIVIDE([Uždaryti sandoriai], [Visi sandoriai]), need to handle context correctly so that filters by date or sales rep work consistently across all visualisations.
Pro tip: Do your calculations in DAX measures, not at the visualisation level. Every extra calculation in a report slows down refreshes as the data volume grows.
Import, DirectQuery or Azure Synapse Link: which architecture should you choose?
The choice of architecture determines both cost and performance. There are three main options:
- Import. Data is copied into the Power BI model and refreshed on a schedule. Fast and inexpensive, it suits up to roughly a million records. Technical sources recommend starting with Import mode for smaller companies.
- DirectQuery. Queries run directly against the CRM system in real time. Useful when you need to see data without any delay, but it carries risks: a heavy load on the CRM system and API request limits (throttling), which can slow down report response times.
- Azure Synapse Link for Dataverse. A solution for large volumes, where data analysis is separated from the operational CRM database. It reduces refresh times and the load on the system, but requires a larger up-front investment in infrastructure.
In practice, the decision often comes down to one question: will the CRM system cope with the extra load if reports query it directly every minute? If not, Import or Synapse Link is the safer route.
Which CRM reports are worth building in Power BI
Not every visualisation is worth the time invested. In practice, four types of report deliver the best return:
- Sales funnel tracking. The conversion rate at each stage, with the option to filter by sales rep, product or period.
- Sales rep performance. Quota attainment, average deal size and average time to close, compared across team members.
- Customer segmentation and CLV. Customer lifetime value, combined with accounting data on actual profitability, not just turnover.
- Cohort and win/loss analysis. Why deals are lost at a particular stage, and how the behaviour of new customer groups differs from month to month.
These four report types cover most of the decisions that sales managers and finance directors make every day.
How much time and money a Power BI rollout with CRM takes
The rollout follows a logical sequence, and skipping steps is not advisable:
- Gathering requirements. Which metrics matter most, who will use them and how often they need refreshing.
- Configuring connections. Building a CRM dashboard involves setting up connections with Rivilė, Finvalda or Dynamics 365.
- Data modelling. ETL processes, star schema, DAX measures.
- Building and testing visualisations. Report layouts, filters, mobile version.
- Deployment and maintenance. Refresh schedules, permission assignment, monitoring.
A ready-built report package lets you skip most of the modelling stage, so getting started takes days rather than weeks. A bespoke project with unique logic can take several weeks, depending on the number of sources. Costs have two components: Power BI licences and implementation services, and after launch it is worth budgeting for ongoing maintenance as data sources or business needs change.
Pro tip: Do not plan a rollout without a pilot stage. Testing a single report with real data exposes most modelling errors before they spread throughout the system.
The Analitika360 solution: ready-built Power BI packages for CRM analytics
Analitika360 offers ready-built Power BI report packages integrated with Rivilė, Finvalda, SharePoint, Excel and CRM systems. The business logic is already built in, so customisation is done through parameters rather than a model built from scratch.
What sets this solution apart from doing it yourself:
- Automatic refreshes with no further user intervention.
- Sector-specific packages: for restaurant chains, logistics and construction companies, and accounting firms.
- A data security policy covering user permission management and role-based access restrictions.
Clients such as restaurant chains and accounting firms use these packages to save the time they previously spent preparing reports by hand.
Why most CRM and Power BI rollouts take longer than they need to
Most managers planning a CRM and Power BI integration start with the wrong question: “Which architecture should we choose?” The right question is a different one: “What decision do we need to make within a week, not within a quarter?” Architecture debates about DirectQuery and Synapse Link are technically valid, but for most mid-sized companies they become an excuse to put off getting started.
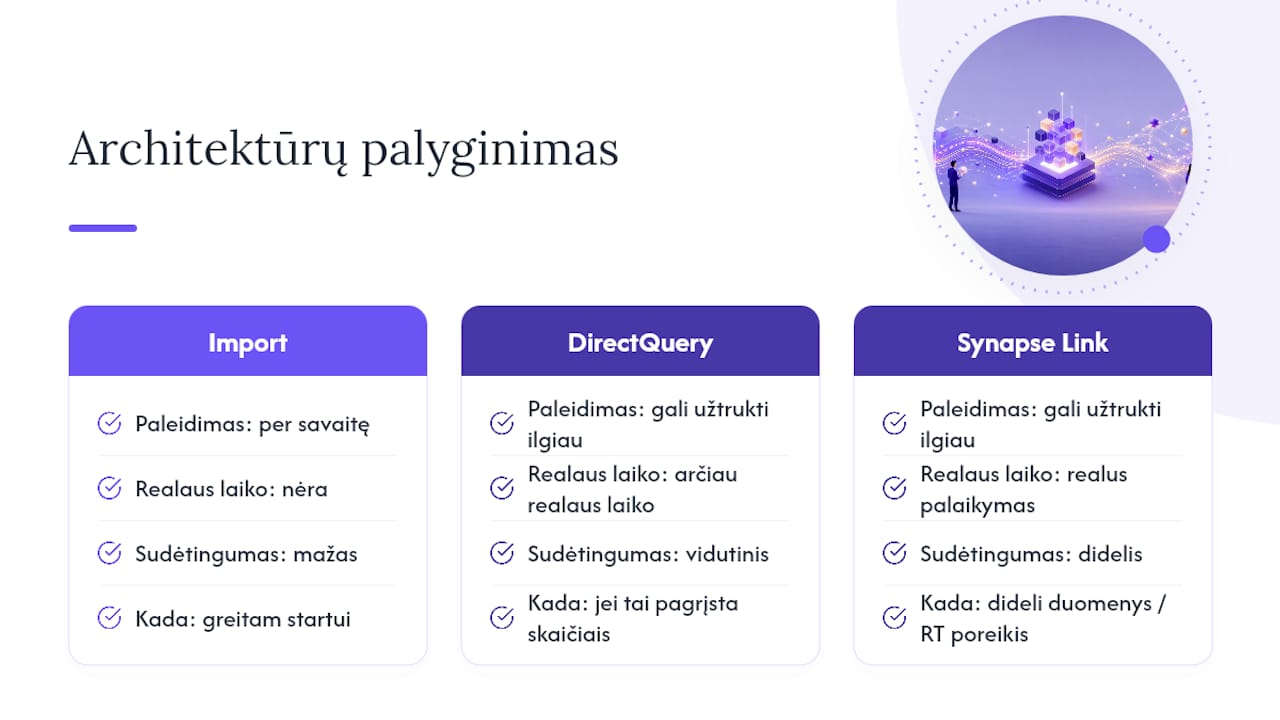
A complex architecture is only needed when data volume or real-time requirements justify it with numbers, not gut feeling.
The biggest mistake I see repeated is trying to build the “perfect” data model before seeing the first working report. A business does not have six months to wait for a flawless solution. It is better to launch a simple version within a week, get feedback from the sales manager or accountant, and then refine the model based on real use rather than theory.
How to get started without the risk of building the model yourself
The approaches to connecting a CRM to Power BI yourself described in this article take time: building Power Query logic, testing DAX measures, fine-tuning the architecture. Analitika360 offers a different route to the same goal.
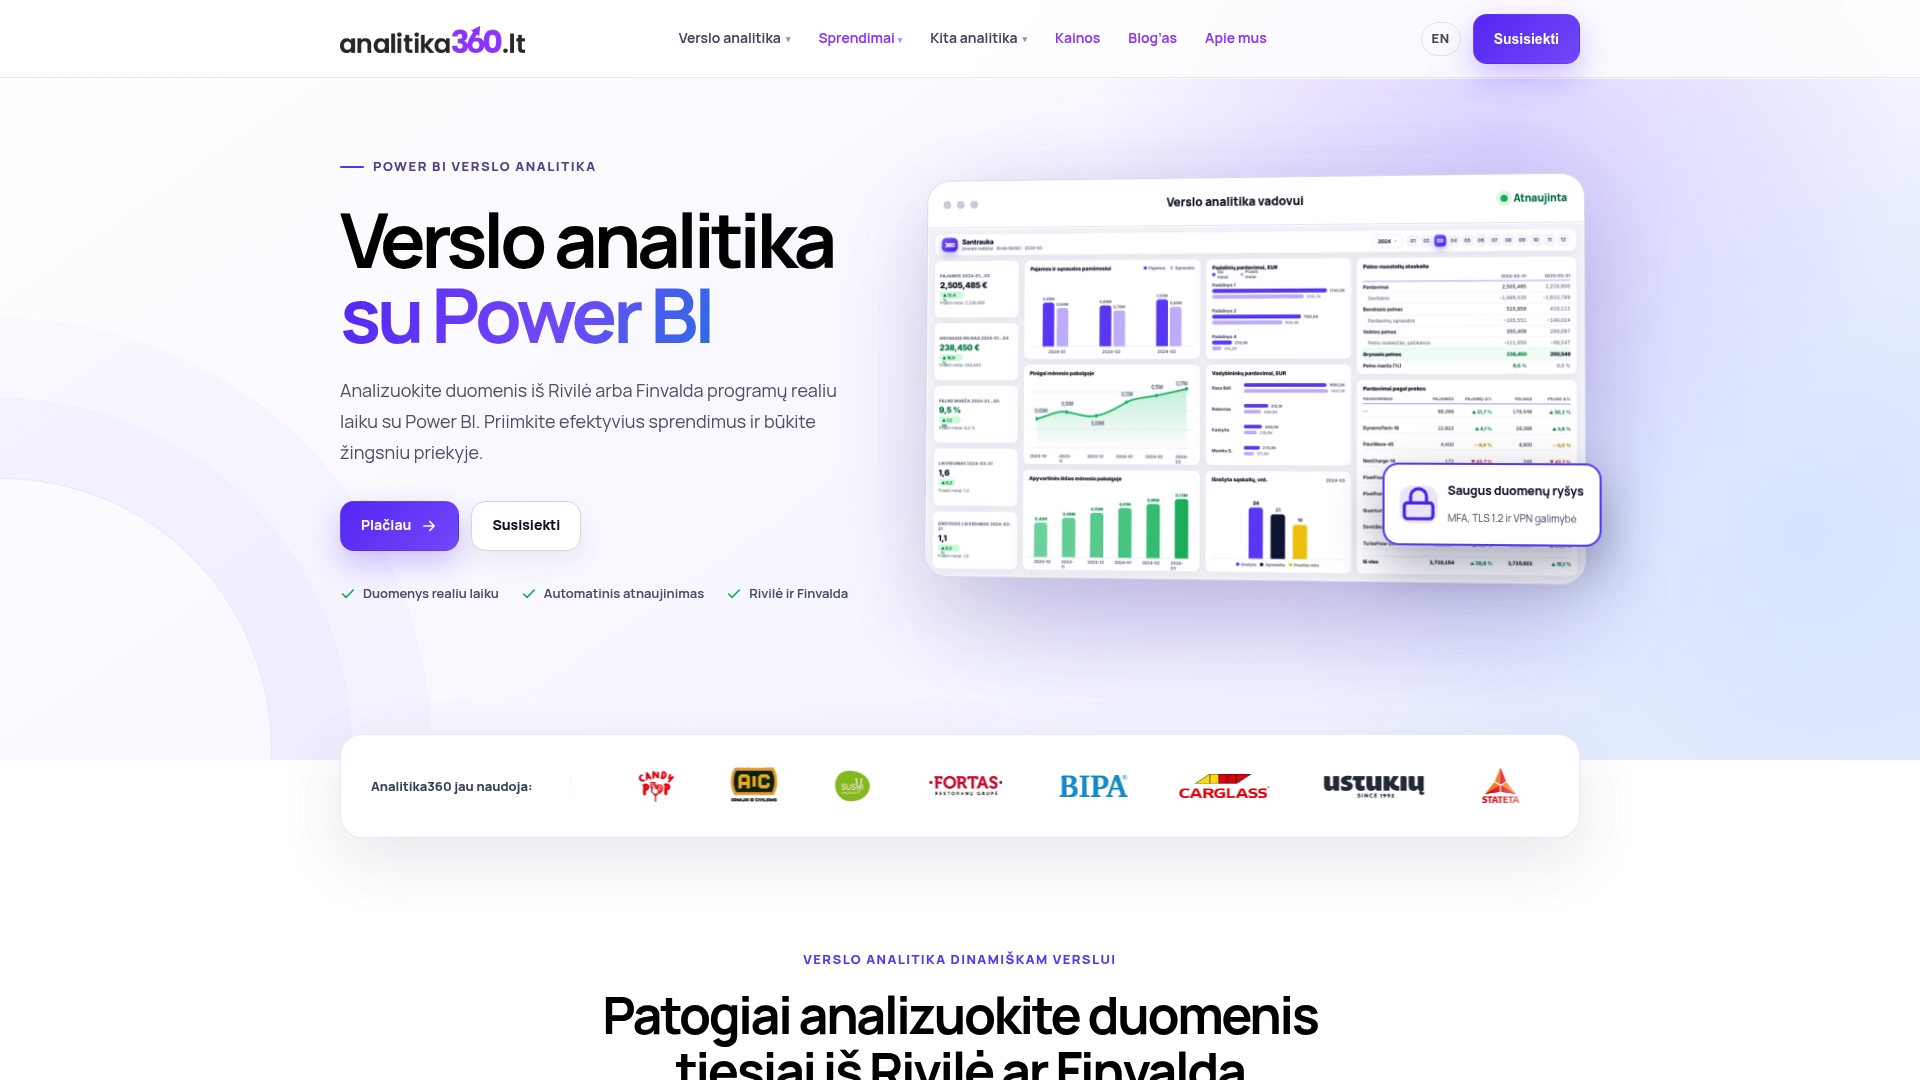
Rather than choosing connectors and building a model from scratch, you get a ready-built Power BI report package that is already integrated with Rivilė, Finvalda, SharePoint and CRM systems. It suits both companies just starting out on their analytics journey and those that have Excel reports and want to automate them without constant manual work. The reports refresh automatically, so finance managers and accountants see revenue, cost and profit figures in real time, with no extra intervention.
Browse business analytics solutions by sector and choose the package that fits your type of business, or get in touch about a Power BI implementation consultation to assess how long your case would take.
Sources
- Power Query connectors | Microsoft Learn