Your business in 360°
Power BI and Microsoft Teams integration: reports where your team works

Integrating Power BI with Microsoft Teams lets you add a report as a tab in a channel or chat, discuss the figures directly in a meeting and receive notifications without leaving Teams. But Teams only displays what is already in Power BI: if the report is updated by hand from Excel exports, the team will be discussing out-of-date figures in the channel. The integration is therefore only as valuable as the data model behind it. For Rivilė and Finvalda users, Analitika360 supplies ready-built Power BI report packages that refresh automatically, with no extra work from the user, and adding them to a Teams channel takes just a few clicks.
In brief
- You add a Power BI report to a Teams channel or chat via ”+” and the Power BI tab; the Power BI app itself is in the Teams “Apps” section.
- Adding a report does not automatically grant access: every viewer needs permissions in Power BI and the right licence.
- Creating and sharing reports requires a Power BI Pro or Premium Per User licence; users with a free licence can only see content in a Premium or Fabric F64+ capacity.
- Teams only shows what has been refreshed in Power BI, so the key is automatic data refresh from your accounting system.
- Analitika360 packages for Rivilė and Finvalda users start at €59 a month and refresh with no manual work.
Contents
- What Power BI and Teams integration offers in day-to-day work
- How to add a Power BI report to Teams: step by step
- Licences and permissions: who can see what
- Why the Teams report shows old figures
- Common problems and how to fix them
- What it looks like in practice
- Our view
- Ready-built packages for Rivilė and Finvalda users
- FAQ
- Sources
What Power BI and Teams integration offers in day-to-day work
Most companies communicate through Teams every day, while their financial indicators often live in separate Excel files or in the accounting system. The integration brings these two places together. According to Microsoft’s documentation on collaborating in Teams, you can:
- Add an interactive report as a tab in a channel or chat, so that all its members see the same view.
- Share links with a preview: when you paste a Power BI link into a chat, a report card is displayed.
- Start a conversation from the Power BI service when you spot an unusual figure.
- Receive Power BI notifications in the Teams activity feed.
As well as standard interactive reports, you can embed paginated reports, scorecards and organisational apps, according to Microsoft’s guide to embedding reports. An organisational app is a packaged set of reports that a workspace publishes to a wider audience.
Meetings are just as useful. Microsoft recommends attaching the report to the meeting invitation so participants can review the figures in advance, presenting it during the meeting and, afterwards, sending a summary with the key results and an action plan. That way the weekly management meeting starts with the facts rather than with the question of who will send round the latest Excel spreadsheet.
How to add a Power BI report to Teams: step by step
The steps below work equally well for a finance director and for a restaurant manager who wants shift managers to see sales.
1. Make sure the app is allowed
The Power BI app must be enabled in the Teams Admin center. If you cannot find the app, contact your IT administrator. Each user also needs to sign in to Power BI at least once, either through Teams or the Power BI service, to activate their licence.
2. Install the Power BI app
In the left-hand Teams bar, select “Apps”, type “Power BI” into the search box and install it. Sign in when you open it for the first time; right-clicking and choosing “Pin” will fix the app to the navigation bar, as described in the instructions for the Power BI app in Teams.
3. Prepare a report that refreshes itself
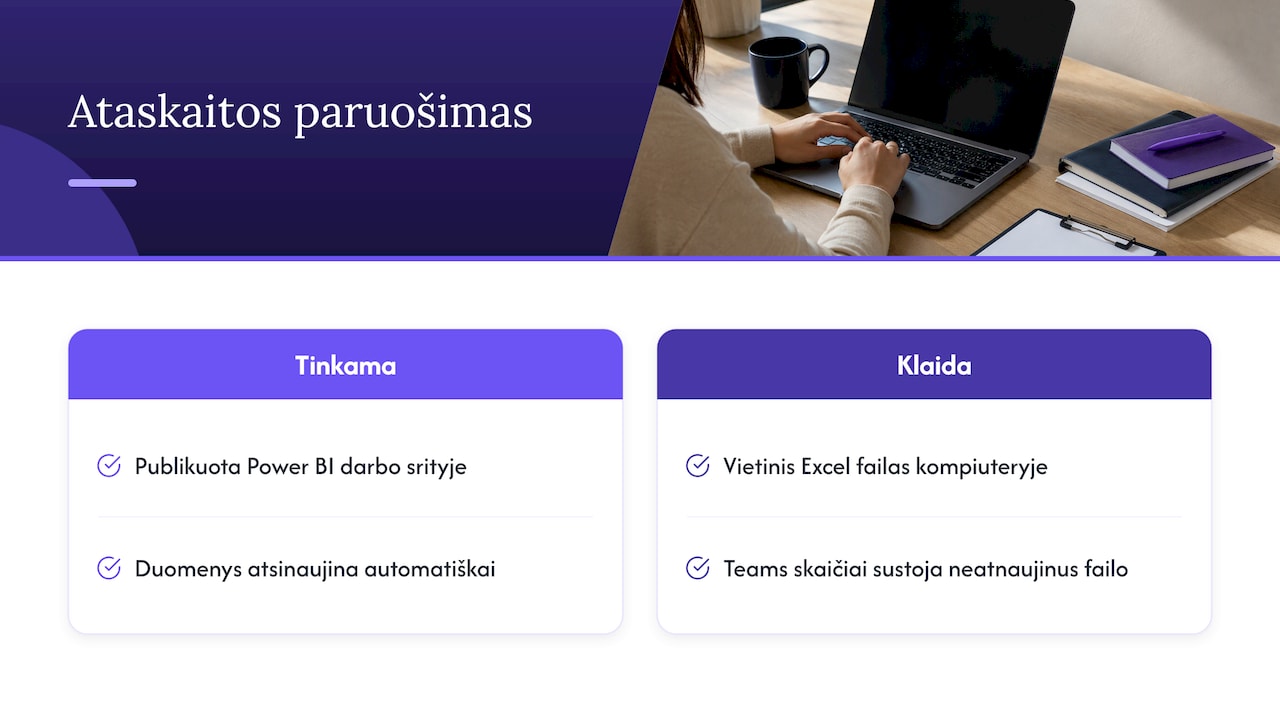
This is the step on which the whole value of the integration depends. The report must be published in a Power BI workspace and have a working data refresh. The most common mistake: the report is built from a local Excel file on someone’s computer, so the figures in the Teams tab freeze on the day nobody updates the file.
Analitika360 takes care of this step: the ready-built Rivilė and Finvalda report packages show revenue, expenses, profit, the balance sheet, sales, inventory and debts, and the reports refresh without any intervention from the user. All you need to do is add them to the channel you want.
4. Add the Power BI tab
Open the channel or chat, click ”+”, select Power BI and then “Save”. In the tab settings, paste the report link or find the report by browsing your workspaces. You can later find all the tabs used in channels in the “In Teams” section of the Power BI app: it shows the 20 most recently used tabs, though not tabs in chats or meetings.
5. Grant access to the report itself
A tab in a Teams channel is not a permission. Channel members need at least the “Viewer” role in the workspace or access to the organisational app. We explain in more detail how to choose between workspaces, apps and direct sharing in our article on sharing data in Power BI, and we cover roles and data security in our Power BI governance guide.
Licences and permissions: who can see what
Licensing is what most often halts an integration at the last minute. According to the comparison of Power BI features by licence type, the rules are as follows:
| Action | What you need |
|---|---|
| Create and share reports in a workspace | A Power BI Pro or Premium Per User (PPU) licence |
| View content shared by a Pro user | A Pro licence, or the content in a Premium (P) or Fabric F64+ capacity |
| View with a free licence | Only if the workspace is in a Premium or Fabric F64+ capacity |
| Share PPU content | With other PPU users, unless the content is in a Premium capacity |
| Add a tab in Teams | At least the “Viewer” role in the workspace |
| Show a report to an external user | An invitation to the organisation (Microsoft Entra B2B), permissions and a licence |
In practice, for a small or medium-sized company this means that everyone who will view reports in Teams will usually have a Pro licence. Analitika360 resells Microsoft Pro and Premium licences, so you can manage your licences and your report package in one place. Current terms are on our pricing page.
Why the Teams report shows old figures
When the team sees yesterday’s or last week’s data in a Teams tab, the problem almost always lies in the refresh, not in Teams itself.
- Excel files in a Teams or SharePoint folder. When a file is stored in OneDrive for Business or SharePoint, Power BI synchronises with it roughly every hour and, if the file has changed, updates the reports. Since Teams files are stored in SharePoint, this is a convenient route for supporting data such as budgets or plans.
- Local Excel files. Uploading local workbooks to Power BI and configuring refresh for them is no longer supported: the file must be imported from OneDrive or SharePoint, or the data model published as a semantic model.
- Accounting data. If Rivilė or Finvalda data reaches the report through a manual export, the Excel file still depends on the person who updates it. This is where automatic refresh, which our packages provide, works best.
You will find more on refresh frequency and limits in our guide to Power BI scheduled refresh, and we explain how to combine accounting and Excel data in our article on bringing Rivilė, Excel and Power BI together.
Common problems and how to fix them
Microsoft lists several known limitations that are worth knowing about in advance:
- The “Content isn’t available” message. The user has no licence or no access to the report. Fix: assign a role in the workspace or app and check the licence.
- Dashboards cannot be added to a tab. The Power BI tab in Teams supports reports, apps and scorecards, so it is worth preparing a report for the channel.
- No link preview is shown. Previews do not work in meeting chats or private channels; it is better to add the report there as a tab.
- URL filters do not work. The tab does not support filters in the link, so a view for an individual restaurant, for example, is better built within the report itself as a page or bookmark.
What it looks like in practice
A restaurant chain. In the managers’ “Sales” channel, a tab is added showing revenue, expenses and profit by restaurant. Before the weekly meeting, the report is attached to the invitation, and the meeting is spent discussing variances rather than hunting for figures.
An accounting firm. A debt report is kept in the team chat so that everyone sees the same overdue invoices. We describe how this saves time in our article on Rivilė debt reports for accountants. If you want to show the report to a client’s staff, they must be invited into the organisation and have a licence.
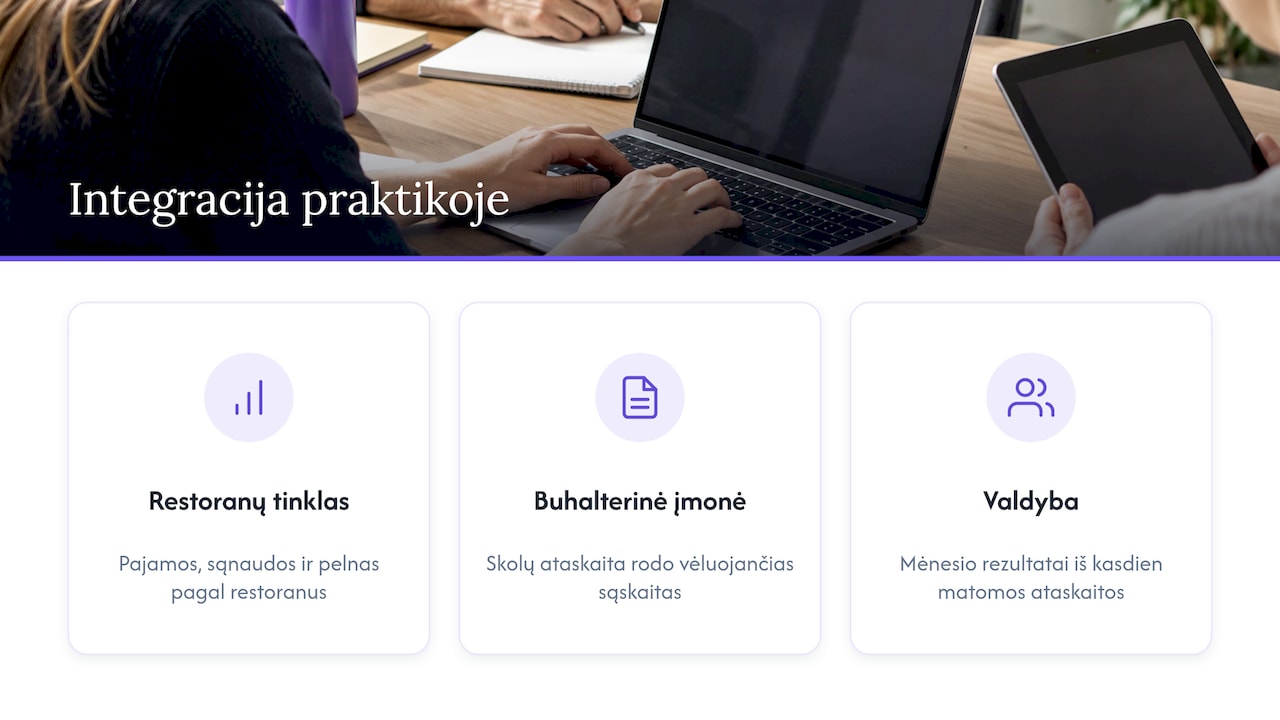
The board. Monthly results for the meeting are presented from the same report the team sees every day in Teams. We explain how to automate this process in our article on board reports.
Our view
Teams integration is the last step, not the first. The integration itself is simple: the app, the tab, the permissions. The hardest part is what happens beforehand: data from Rivilė or Finvalda has to reach the Power BI model and refresh without anyone having to step in.
That is why we build ready-made report sets for Rivilė and Finvalda users. Revenue, expenses, profit, the balance sheet, sales, inventory and debts sit in a single Power BI model, which can be extended with SharePoint, Excel, CRM or logistics data. Once such a model is in place, the Teams channel becomes the place where the team makes decisions, not the place where files are passed around.
For specific needs, we tailor solutions to the company’s processes and existing IT systems, so that the report in Teams reflects how your team actually works.
Analitika360
Ready-built packages for Rivilė and Finvalda users
If you want your Teams channel always to show up-to-date financial indicators, start with a ready-built package. The Rivilė Basic and Finvalda Basic plans cost €59 a month, and the Rivilė PRO and Finvalda PRO plans cost €89 a month. Custom projects, such as integrating additional sources or industry-specific reports, cost €70 an hour.
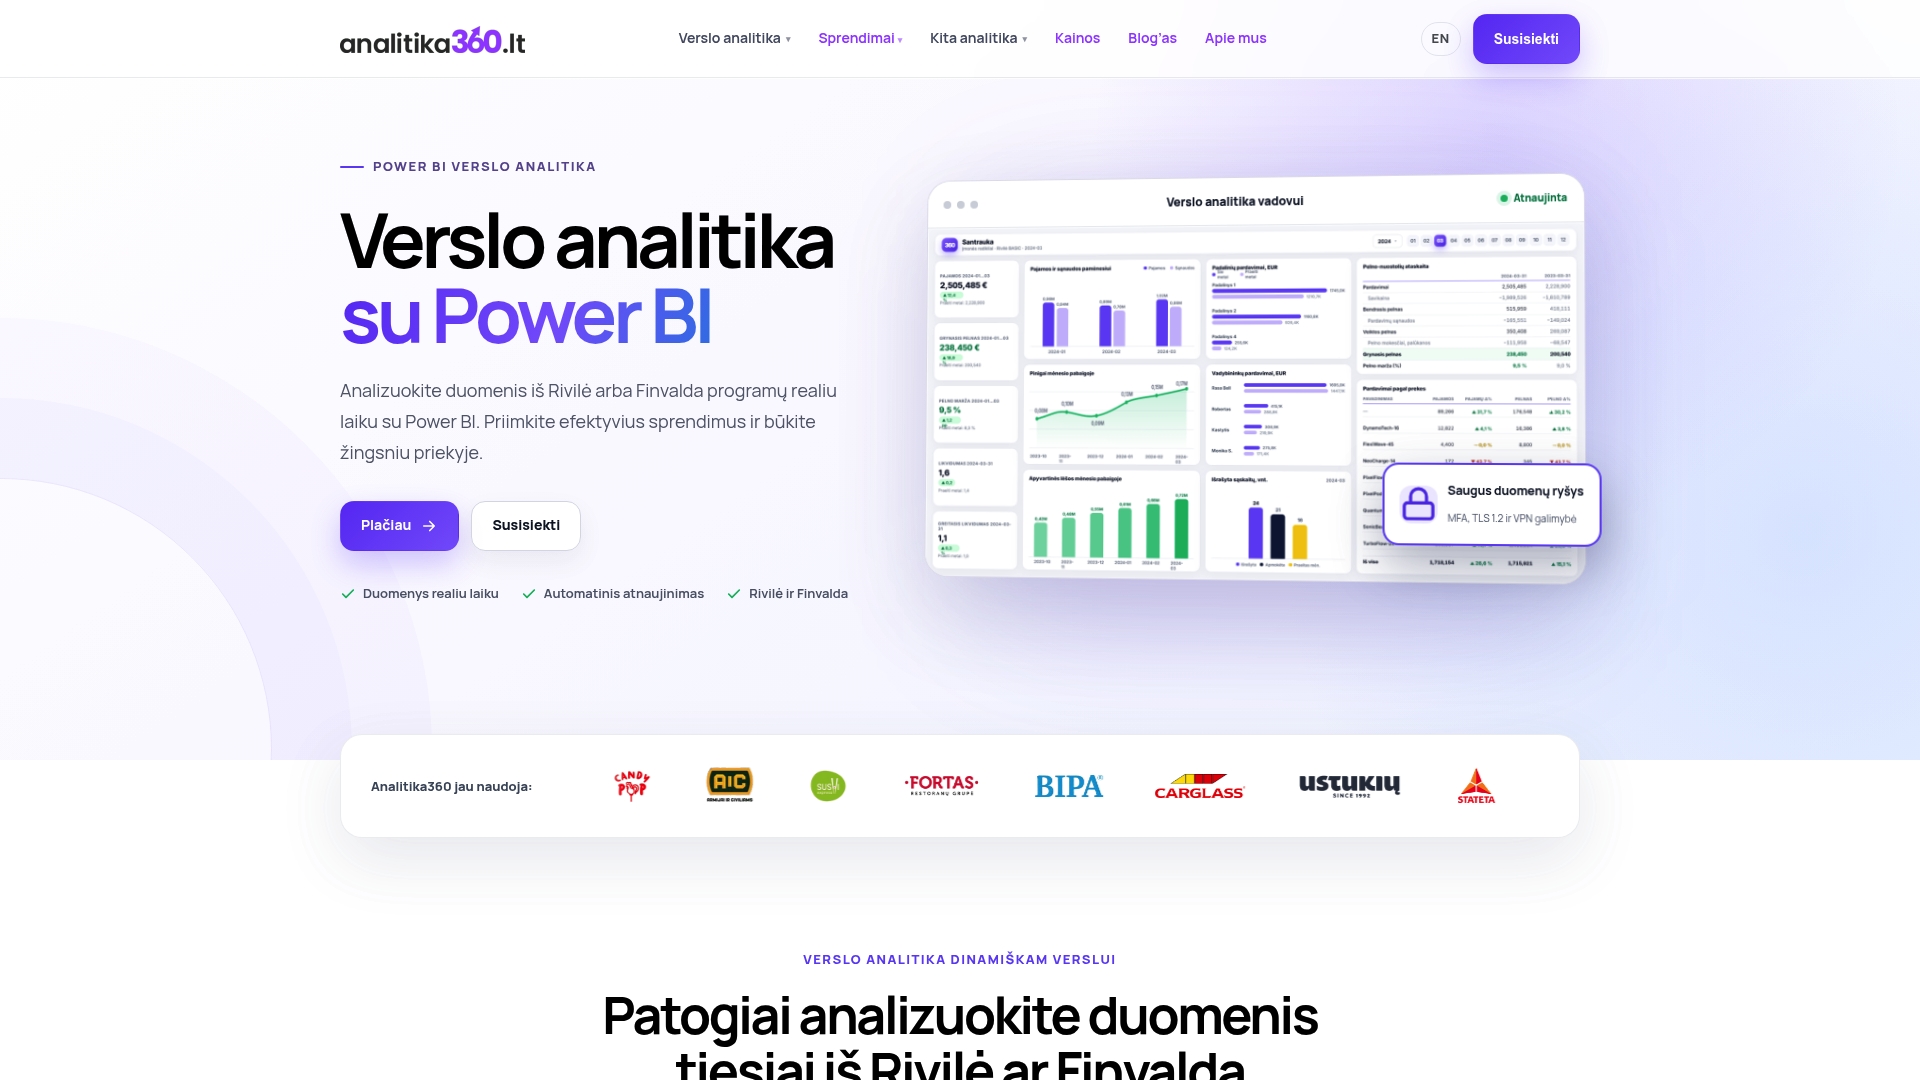
Compare the plans on our business analytics pricing page or take a look at the Rivilė Basic and Finvalda Basic packages.
FAQ
Do I need a separate licence to use Power BI in Teams?
No separate Teams licence is needed for Power BI, but the usual Power BI licensing applies. You can create and share content with a Pro or PPU licence, while users with a free licence can only see content when it is in a Premium or Fabric F64+ capacity.
Can I add a Power BI dashboard to Teams?
No, the Power BI tab in Teams does not support dashboards. You can add interactive and paginated reports, scorecards and organisational apps.
Why does my colleague see “Content isn’t available”?
Usually because they have no licence or no access to the report in Power BI. Adding a report to a channel does not grant access, so you need to assign them a role in the workspace or app.
How often does the report in a Teams tab refresh?
The tab shows the same data as the Power BI service, so it all depends on how the report is refreshed. Power BI checks Excel files in SharePoint or OneDrive roughly every hour, while Analitika360 packages refresh Rivilė and Finvalda data automatically.
Sources
- Collaborate with Power BI in Teams, Microsoft Learn
- Embed Power BI reports in Microsoft Teams, Microsoft Learn
- Add the Power BI app to Microsoft Teams, Microsoft Learn
- View all the Power BI tabs you use in Microsoft Teams, Microsoft Learn
- Use Data to Make Meetings Productive in Microsoft Teams, Microsoft Learn
- Power BI service features by license type, Microsoft Learn
- Refresh a semantic model created from an Excel workbook, Microsoft Learn
- Get data from Excel workbook files, Microsoft Learn