Your business in 360°
Connecting Finvalda and CRM: from data transfer to reporting

Finvalda is usually connected to a CRM system through the Finvalda web service (API): the CRM pulls customer record data, outstanding balances and sales from the accounting system, so sales managers see the same picture as the accounts team. For the managing director and the finance director, however, synchronised lists are not enough. They need a single view showing sales opportunities from the CRM alongside revenue and receivables from Finvalda, and they need it to refresh by itself. That view comes from combining both sources in one Power BI model. This is exactly what Analitika360 does: it builds Power BI report packages for Finvalda users and integrates them with other sources, CRM included, with reports that refresh without any extra effort.
In brief
- Finvalda has a web service (FVS) available over SOAP or REST, so data can be passed between Finvalda and a CRM automatically.
- The key to joining the two is the customer code or company registration number: without the same identifier in both systems, the reports will not reconcile.
- Operational integration (the CRM and Finvalda exchange records) and analytical integration (both sources in one Power BI model) solve different problems.
- For management reporting, the best route is a Power BI model with automatic refresh, not manual exports to Excel.
- Analitika360 Finvalda packages start from €59 a month, and CRM integration is delivered as a bespoke project.
Contents
- What connecting Finvalda and a CRM really means
- What data can be passed between the systems
- Two ways to connect: which suits you
- How to connect Finvalda and a CRM: step by step
- How to check the connection works
- What combined data gives you: example reports
- The Analitika360 solution for Finvalda users
- Our view
- FAQ
- Sources
What connecting Finvalda and a CRM really means
A CRM (customer relationship management system) is where sales managers record contacts, quotes and deals. Finvalda is an accounting and business management system that holds invoices, payments, stock and outstanding balances. When the two systems are not linked, the sales manager does not know a customer is paying late, and the accountant cannot see which deals are coming up.
Finvalda’s developer itself, on its business management systems page, lists FIN WEB SERVICE (API) as the interface to various CRM systems, such as SPINCRM, Hanna CRM and e-Zonus CRM. The same page describes CRM and analytics solutions as modules that plug into the system. And the Finvalda FAQ section draws a clear line between the roles: CRM is for sales management, Power BI is for management analytics.
In practice, then, connecting the two has two sides:
- Operational integration. The CRM and Finvalda exchange records: new customers, changes to customer records, invoice statuses.
- Analytical integration. Data from both systems is brought into a single Power BI model that calculates the metrics: revenue by sales manager, profitability by customer, receivables by account owner.
The first side makes day-to-day work easier; the second makes decision-making possible. It is the second that companies already running both Finvalda and a CRM most often lack.
What data can be passed between the systems
In the Finvalda web service guide (edition of 10 December 2025), the sample customer data includes the code, name, current balance, address, telephone, company registration and VAT numbers, email, and the dates the record was created and modified. That is already a sufficient basis for linking a customer in the CRM to its financial history in the accounts.
| Data | Where it comes from | What it is used for in reports |
|---|---|---|
| Customer code, company registration and VAT numbers | Finvalda | The key used to join the two sources |
| Current balance | Finvalda | Receivables control by sales manager and customer |
| Invoices, sales, cost of sales | Finvalda | Revenue, margin, profitability |
| Deals, quotes, stages | CRM | Sales plan and forecast |
| Responsible sales manager | CRM | Results by team member |
| Contacts, activities, meetings | CRM | Link between activity and results |
The more of these fields match across both systems, the more reliable the reports. We cover how CRM data becomes analytics in more detail in our CRM and Power BI integration guide.
Two ways to connect: which suits you
| Criterion | Operational integration | Analytical model in Power BI |
|---|---|---|
| Purpose | Consistent records in both systems | A single view of the figures for management |
| Who uses it | Sales managers, accountants | Directors, finance directors, consultants |
| Outcome | Up-to-date customer records in the CRM | Revenue, profit, receivables and sales reports |
| Additional sources | Usually just the two systems | Also Excel, SharePoint, logistics |
| Refresh | According to the integration logic | Automatic, on a schedule |
If your question is ‘why can’t the sales manager see the overdue balance?’, you need operational integration. If your question is ‘which customers and which sales managers actually make a profit?’, you need an analytical model. Most companies need both, but it is the second that determines the quality of decisions.
How to connect Finvalda and a CRM: step by step
1. Define what you want to see
Start with the 5 to 10 metrics you genuinely lack: for example, revenue and margin by sales manager, overdue receivables by customer, quote value against actual sales. The most common mistake is to bring across everything possible and then not know what to do with it. In the Analitika360 Finvalda packages, the revenue, cost, profit, sales and receivables metrics are already built, so all that remains is to define what the CRM adds.
2. Standardise the customer identifier
Every customer in the CRM must have the same customer code or company registration number as in Finvalda. Check for duplicates, customers with no registration number and names spelt differently. Matching on name is risky: to the system, ‘UAB Pavyzdys’ and ‘Pavyzdys, UAB’ are two different customers.
3. Open up access to the data
According to the FVS guide, the web service is available over SOAP or REST. REST requests are sent using the POST method and support XML or JSON, with the response returned in the same format. The standard SOAP address ends in ‘FvsService.asmx’ and the REST address in ‘FvsService.asmx/rest’, though your company’s specific addresses may differ. The alternative is to work directly with the database, which we discuss in our article on Finvalda SQL and Power BI. Data security matters at this step: access rights should be read-only and limited to the data actually needed.
4. Decide how often and what to refresh
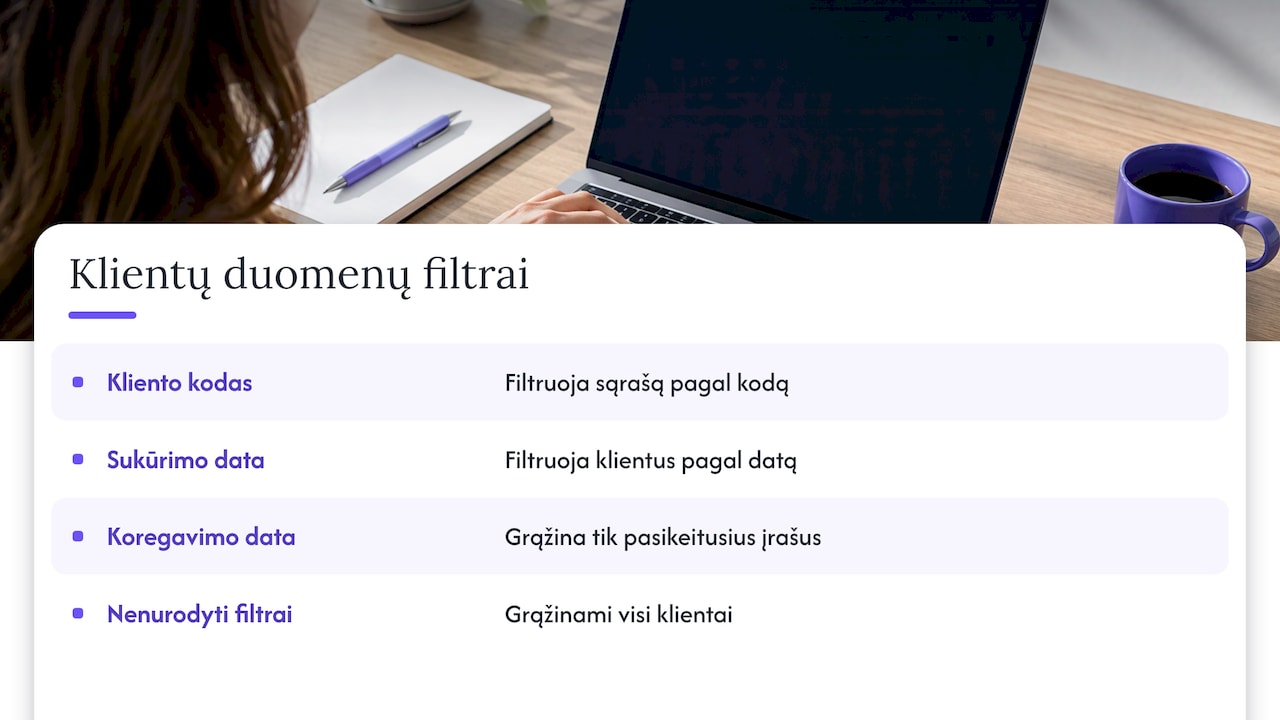
There is no need to pull the entire customer base every time. The ‘GetKlientusSet’ method described in the guide returns the customer list and lets you filter it by customer code, creation date or modification date; if no date or code is given, all customers are returned. Filtering by modification date lets you refresh only the records that have changed, so data moves faster. You will find more technical detail in our guide to the Finvalda API and Power BI.
5. Build a shared Power BI model
In the model, Finvalda customers, invoices and receivables are linked to CRM deals and sales managers through the shared key. Other information is brought together here too: budgets from Excel, documents from SharePoint, logistics data. Analitika360 does this work for you: it integrates the different sources into a single Power BI model and tailors the solution to your processes and existing IT systems.
6. Switch on automatic refresh
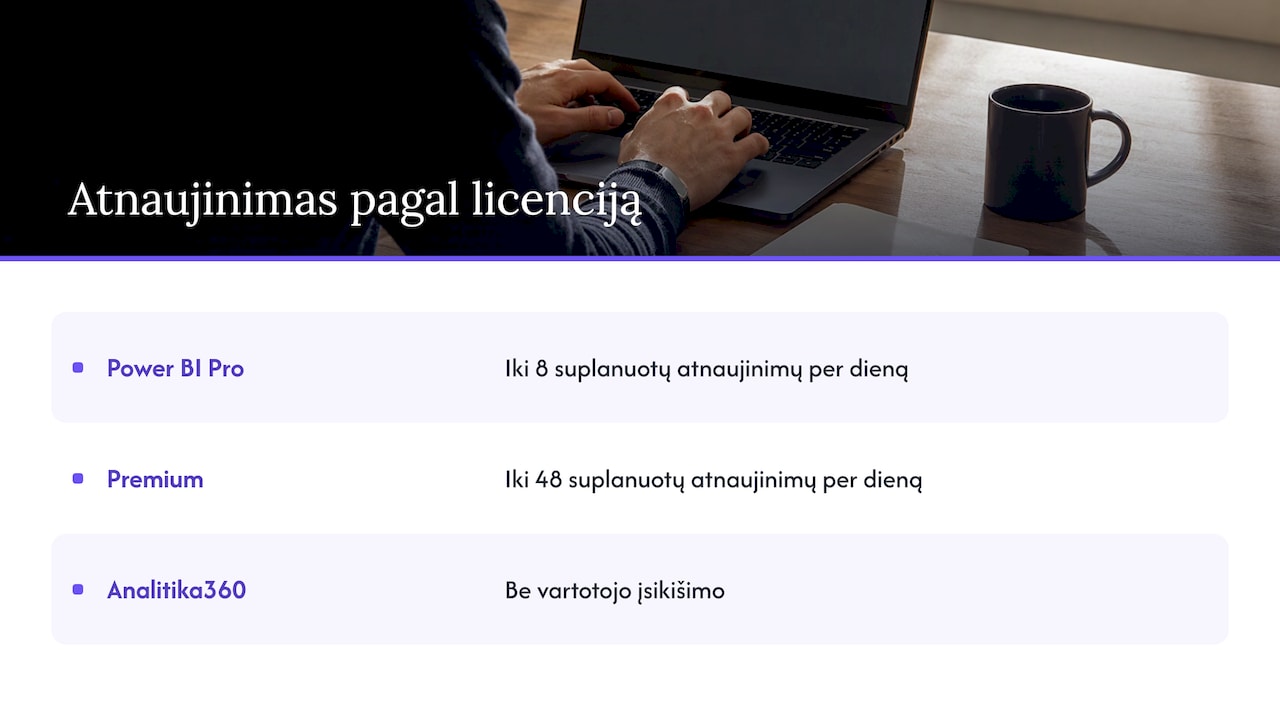
In the Power BI service, refreshes run on a schedule. Microsoft’s documentation states that a Power BI Pro licence allows up to 8 scheduled refreshes a day, while Premium Per User or Premium capacity allows up to 48. For most companies, a few refreshes a day is entirely sufficient. In Analitika360 solutions, reports refresh without any user intervention, and Microsoft Pro and Premium licences can be purchased through us.
How to check the connection works
After the first run, it is worth carrying out a quick check. It takes an hour and saves a great deal of confusion later.
- Reconcile the totals. The monthly sales total in the report must match the Finvalda sales journal for the same period.
- Unmatched customers. List separately the CRM customers that are not in Finvalda, and vice versa. A long list means the key has not been fully standardised.
- Compare balances. For a few customers, the current balance in the report must match the balance on the customer record in Finvalda.
- Dates and periods. Check that invoices are assigned to the right month and that dates display correctly.
- Refresh history. Power BI shows the status of every refresh: a failed refresh usually means a changed password, address or access rights.
If an error keeps recurring, check access to the web service and its address first, as these are what most often change after a server or software update.
What combined data gives you: example reports
Once Finvalda and the CRM are combined in one model, you can answer questions that previously took several days of work in Excel:
- Revenue and margin by sales manager. Not just how much was sold, but how much was earned, taking into account cost of sales from Finvalda.
- Receivables by account owner. Sales managers see their customers’ overdue amounts and can act before closing a new deal. We describe how to automate this part in our article on Finvalda receivables reports.
- Plan versus actual. The value of CRM quotes is compared with invoices actually issued, giving a clearer picture of how much is really being closed.
- Customer segments. Customers are grouped by revenue, profitability and payment discipline. We cover this in more depth in our guide to B2B customer segmentation.
For example, a wholesale company might notice that its top-selling sales manager works with the lowest-margin, slowest-paying customers. This is invisible in the separate systems, but in a combined model it is visible on a single page. You will find more on sales metrics in our Finvalda sales analysis guide.
The Analitika360 solution for Finvalda users
Analitika360 offers ready-built Power BI report packages for Finvalda data: Finvalda Basic at €59 a month and Finvalda PRO at €89 a month. They show revenue, cost, profit, balance sheet, sales, inventory and receivables metrics, and the reports refresh automatically.
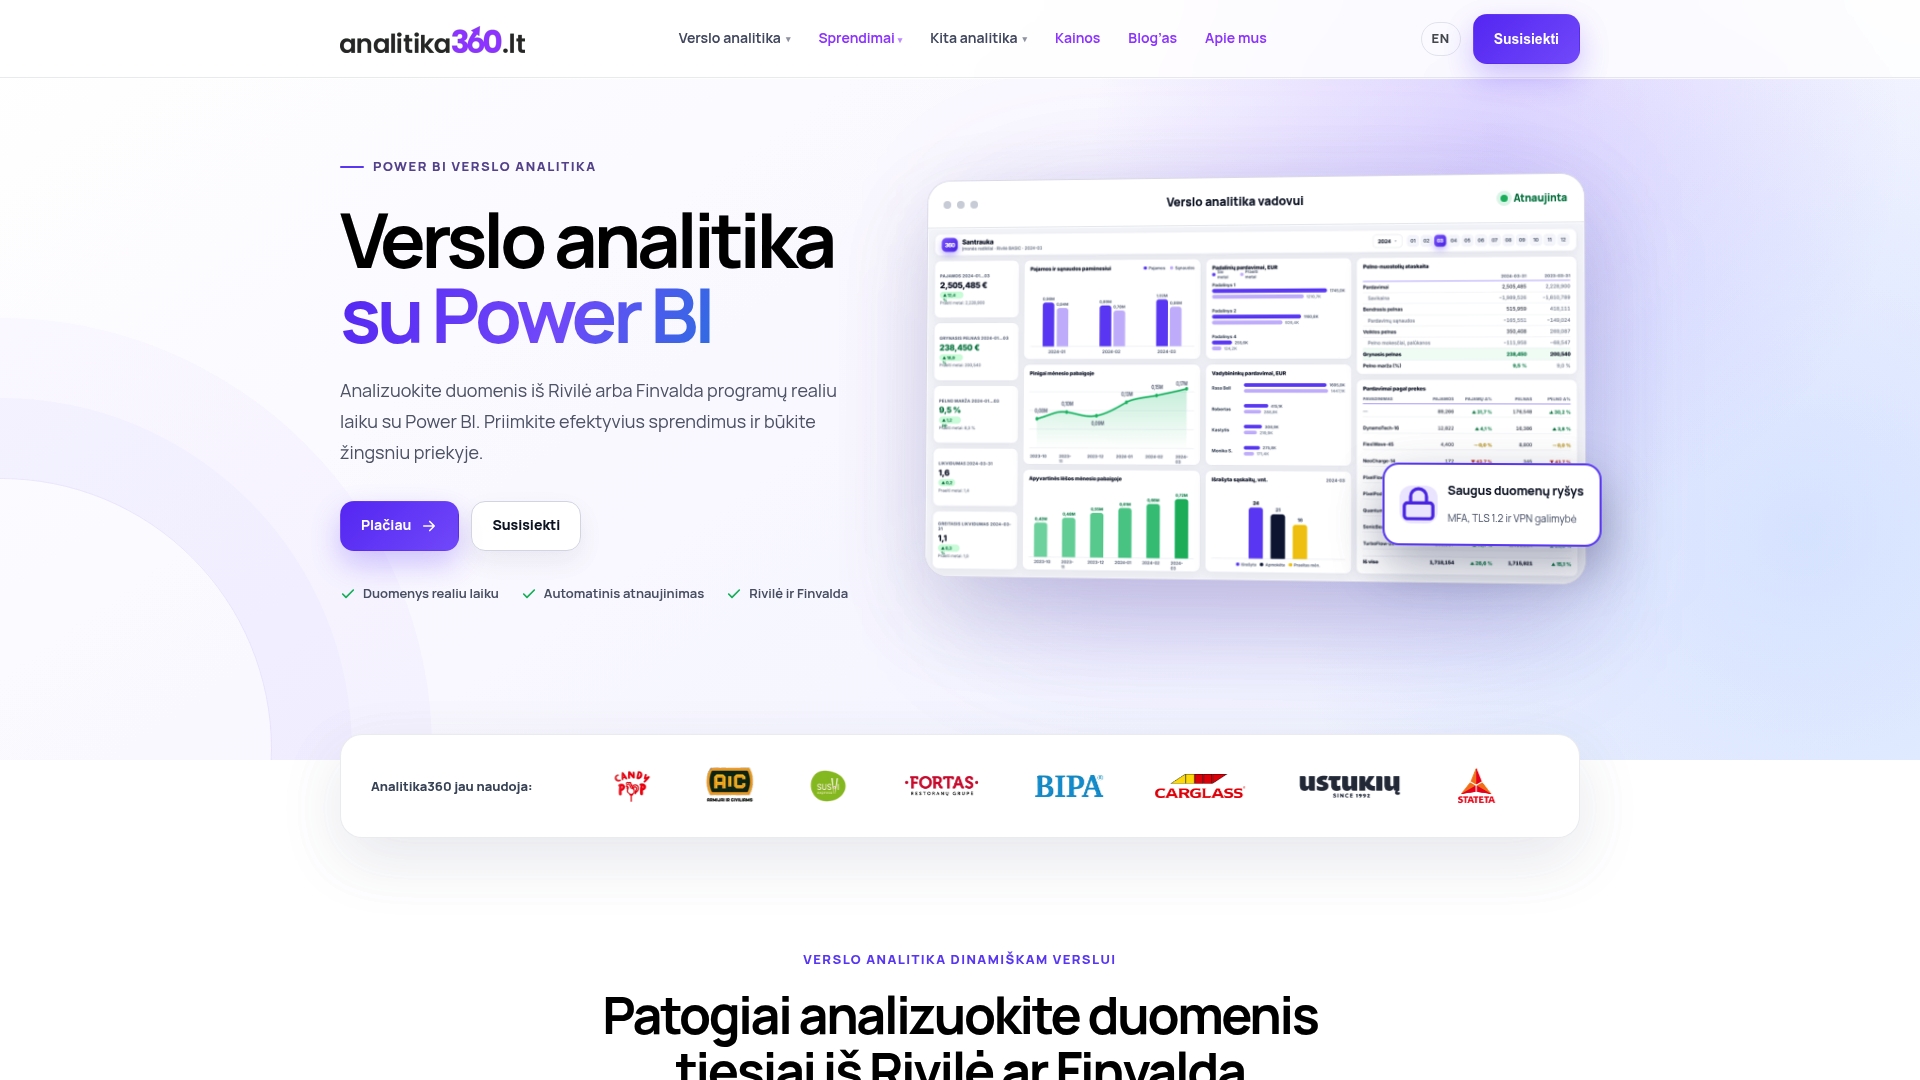
Integrating CRM, Excel, SharePoint or logistics data into the same model is carried out as a bespoke project at €70 an hour. You will find all prices on our business analytics pricing page.
Our view
Connecting Finvalda and a CRM is often seen as a technical task: moving customer records from one system to another. That is useful, but the value comes when accounting and sales data start answering management’s questions.
That is why we start with the metrics, not the fields. For Finvalda users we have pre-built report sets that refresh automatically, and we integrate the CRM and other sources into the same Power BI model in line with each company’s processes and existing IT systems.
The result is simple: one reliable view in which the managing director, the finance director and the sales managers see the same figures, and the accounts team no longer has to prepare the same spreadsheets by hand every month.
Analitika360
FAQ
Can Finvalda be connected to any CRM system?
The Finvalda web service supports the SOAP and REST protocols and the XML and JSON formats, so most modern CRM systems can connect to it. The developer itself lists integrations with several CRMs used in Lithuania. For the analytical model, CRM data can also be taken via that CRM’s own interface or an export.
How many times a day do the reports refresh?
That depends on the Power BI licence. A Pro licence allows up to 8 scheduled refreshes a day, and Premium-type licences up to 48. Analitika360 reports refresh automatically on a set schedule.
Do we need a developer to connect Finvalda and the CRM?
Operational integration usually requires a technical person familiar with APIs. For the Power BI analytical model, Analitika360 sets up everything: it connects the Finvalda data, integrates the CRM and configures automatic refresh, leaving your team simply to use the reports.
Is the data still secure once it is combined?
Security depends on how access is granted: read-only rights, limited to the data needed, are enough. Analitika360 ensures data security in its solutions, and reports are visible only to the people you give access to.
Sources
Web service methods guide (FVS), Finvalda
Business management systems, Finvalda
Frequently asked questions, Finvalda
Configure scheduled refresh, Microsoft Learn