
Finvalda profit and loss statement: how to prepare and read it correctly
A Finvalda profit and loss statement reflects exactly what the accountant has defined for it. The system does not group income and expenses according to the Lithuanian Business Accounting Standards (VAS) on its own. If the figures do not match expectations, check the report layout and the account mappings first, not the turnover data itself. Work from the Finvalda WEB user guide, check your Finvalda Finance PRO settings and compare the lines against the VAS profit and loss statement template. The first step is always the same: open the report tree and review which account numbers are assigned to each line.
In brief:
- The Finvalda profit and loss statement depends on how specific accounts are mapped and on the structure of the report tree, so errors often stem from inaccurate mapping.
- When building the statement, you need to check that every line has the correct account ranges and that cost objects are used consistently throughout.
- If the figures still do not match, review the account mappings, make sure all transactions are captured and check filters and structure carefully.
- Automated Power BI reports significantly cut the time involved and the likelihood of errors, provided the data mapping has been done correctly and consistently.
- Where errors are frequent or the number of divisions is growing, a professional system with automatic data refresh is recommended.
Contents
- How Finvalda links the chart of accounts to the profit and loss layout
- Reconciling with VAS and the State Tax Inspectorate (VMI): how to make sure your P&L matches your tax returns
- How to interpret the main P&L lines in Finvalda
- Common Finvalda errors and troubleshooting
- Analitika360: automated Power BI reports from Finvalda data
- Editor’s note: when to move from manual fixes to automation
- Analitika360 Power BI packages for Finvalda users
- Sources
- Frequently asked questions
How Finvalda links the chart of accounts to the profit and loss layout
Finvalda has no single “factory” P&L layout that you simply run. The system allows a customised chart of accounts, so the profit and loss statement looks exactly as the user has defined it using their own account numbers, according to the Finvalda user guide. This is the most common reason why, in a newly implemented system, the statement shows empty or distorted lines.
In Finvalda, the statement is built on what is known as the report tree, in which every line (revenue, expenses, financial activities and so on) must be linked to specific ranges in the chart of accounts.
In practice, the set-up sequence looks like this:
- Open the report tree configuration and find the profit and loss statement template.
- Assign the relevant account numbers or ranges to each line (for example, class 5 accounts for revenue).
- Check that every account in use from the chart of accounts has been included in at least one line.
- Run a test report for the previous month and compare the total with the trial balance.
Assigning cost centres (objects) at this stage matters just as much as classifying the accounts themselves. If you want to see profitability by division, project or individual restaurant in a chain, every transaction must have an object assigned; otherwise the line will simply have no breakdown in Power BI or Finance PRO views.
Recommended order:
- First define the report layout and the account mappings.
- Then check that objects are used consistently across all journals.
- Finally, run a control report filtered by object to confirm the breakdown is accurate.
Pro tip: before running the final report, create a test object with a few dummy transactions and check whether it appears in the P&L view. This exposes mapping errors in a matter of minutes rather than after month-end.
Reconciling with VAS and the State Tax Inspectorate (VMI): how to make sure your P&L matches your tax returns
The Business Accounting Standards (VAS) allow the profit and loss statement to be prepared in two ways: by nature of expense or by function. In Lithuanian practice, the function method with cost of sales is the usual choice, as it better reflects gross profit and is easier to reconcile with the VAS profit and loss statement template.
Choosing the function method makes it easier to reconcile the P&L with the corporate income tax return, because the lines naturally align with the tax expense groups rather than just the accounting classification.
To make sure the Finvalda lines match the annual return, check the following before submitting your statements:
- Does the cost of sales line include all costs related to the products sold, not just raw materials?
- Are operating expenses (administrative and selling) not duplicated across several lines?
- Are finance income and finance costs kept separate from the operating result?
- Does net profit in the P&L match the change in retained earnings on the balance sheet?
- Does the corporate income tax figure correspond to the calculated taxable result, rather than simply to accounting profit before tax?
In the VAS template, the “cost of sales” line is typically made up of direct materials, direct labour and the share of production overheads allocated to the products sold during the period. In Finvalda, this line usually needs its own account range, kept separate from general administrative expenses; otherwise gross profit will be overstated or understated.
The deadlines and format for submitting annual financial statements are set by the Centre of Registers (Registrų centras), so the P&L structure in Finvalda should follow the same template used when preparing the explanatory notes. This reduces the risk of having to redo the account grouping during an audit after the return has already been filed.
How to interpret the main P&L lines in Finvalda
The figures in a Finvalda report only mean something when you read them as ratios rather than absolute amounts. Three indicators matter most to a finance professional every month:
- Gross margin — (revenue minus cost of sales) divided by revenue. It shows how much is left after the direct production or goods costs.
- Operating profit margin — operating profit divided by revenue. It reflects how efficiently administrative and selling expenses are managed.
- EBITDA approximation — operating profit plus depreciation and amortisation from the VAS lines. This is not a precise EBITDA under international standards, but for a medium-sized Lithuanian company it is a close enough benchmark for management.
When a company has several divisions or product lines, the aggregated P&L line often hides a problem. If the overall operating profit margin is falling but no single account looks unusual, the cause usually lies at cost-centre level rather than in the general ledger account.
A quick example: if revenue is €500,000 and cost of sales is €320,000, gross margin is 36%. If it was 41% last quarter, five percentage points in a single period is already a signal to review supplier prices or the product mix, not statistical noise.
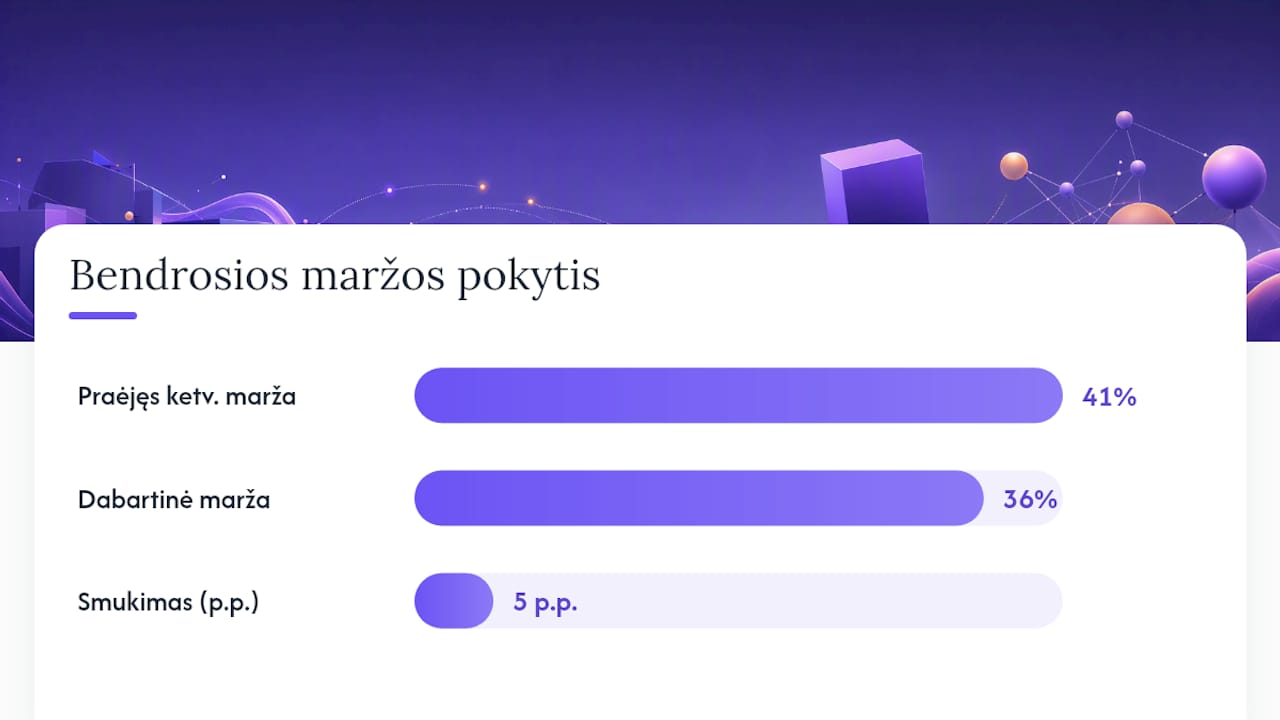
Pro tip: track the change in margin in percentage points, not as a percentage of the previous figure. A three-percentage-point drop in a single month already merits a separate conversation with management, even if total profit in euros looks similar.
Common Finvalda errors and troubleshooting
When the P&L shows implausible figures, the cause can almost always be found with four checks.
- Check whether the report line has been defined in the report tree at all, rather than left empty since implementation.
- Check whether every account in use from the chart of accounts is assigned to at least one line, or whether some are “dangling” without a group.
- Check whether cost centres have been assigned to transactions, especially when the report is filtered by object.
- Check that no date range from a previous period or division restriction has been left in the report filter.
A typical symptom is a line showing zero even though the trial balance clearly has an amount. The most common cause: the account was created after the report layout was defined, so it was left outside the grouping. Another frequent case is when P&L net profit does not match the change in retained earnings on the balance sheet, which means an account has ended up in two lines at once or in none at all.
A quick fix can be made yourself by adding the missing account to the group and re-running the report. However, if the problem recurs for several months in a row or relates to the structure of the report tree, it is worth calling in a Finvalda implementation specialist rather than trying to rebuild the whole scheme yourself.
Pro tip: record every mapping change in a separate document with the date and the reason. Six months later, when someone asks why last September’s P&L differs from this one, you will have the answer in minutes rather than hours.
Analitika360: automated Power BI reports from Finvalda data
Checking mappings manually works as long as the company has one division and one accountant. Once there are several objects, several divisions or a need to see profit daily rather than once a month, the manual model starts breaking down more often than it delivers value.
The solution connects to the data and turns it into Power BI reports that refresh automatically, with no further input from the user. It is built on the same official Finvalda Power BI integration, simply tailored to the specific chart of accounts and cost-centre structure.
In practice, this means:
- A data audit and mapping carried out once no longer needs to be redone manually every month.
- Revenue, expense and profit indicators are visible in real time, with data combined from various sources.
- The risk of errors falls, because the account grouping is defined once, centrally, rather than afresh in every version of the report.
Automated Power BI reports integrated with Finvalda significantly reduce the time spent preparing reports, especially when profit has to be broken down by object or division.
Implementation typically covers a data audit, aligning the account mapping with the existing Finvalda structure, tailoring the report package to the specific company, and ongoing support when the chart of accounts changes or new divisions are added.
Editor’s note: when to move from manual fixes to automation
Manual P&L checking in Finvalda works reliably as long as the company has one legal entity, a few dozen accounts and one person responsible for the mapping. Once a second division, several tills or restaurants in a chain come along, the manual model can no longer cope with the load, even if the accountant’s work is flawless.
The decision is best made on three criteria: how many divisions or objects need to be tracked separately, how often management needs to see profit (once a month or daily), and how much time manual reconciliation with the balance sheet currently takes. If the answer to the last question exceeds a few hours a month, automation pays for itself quickly.
Risk is reduced not by an abrupt switch but by a pilot project for a single division with clearly documented mapping. Once the pilot confirms that the account grouping is correct, the solution can be extended to other divisions without additional risk to the rest of the company. This is exactly how Analitika360 works with Finvalda users who need real-time reports without daily manual reconciliation.
— Analitika360
Analitika360 Power BI packages for Finvalda users
If your account mapping is already in order but you still have to assemble the P&L manually in Excel spreadsheets every month, the problem no longer lies in the accounting but in the report refresh process.
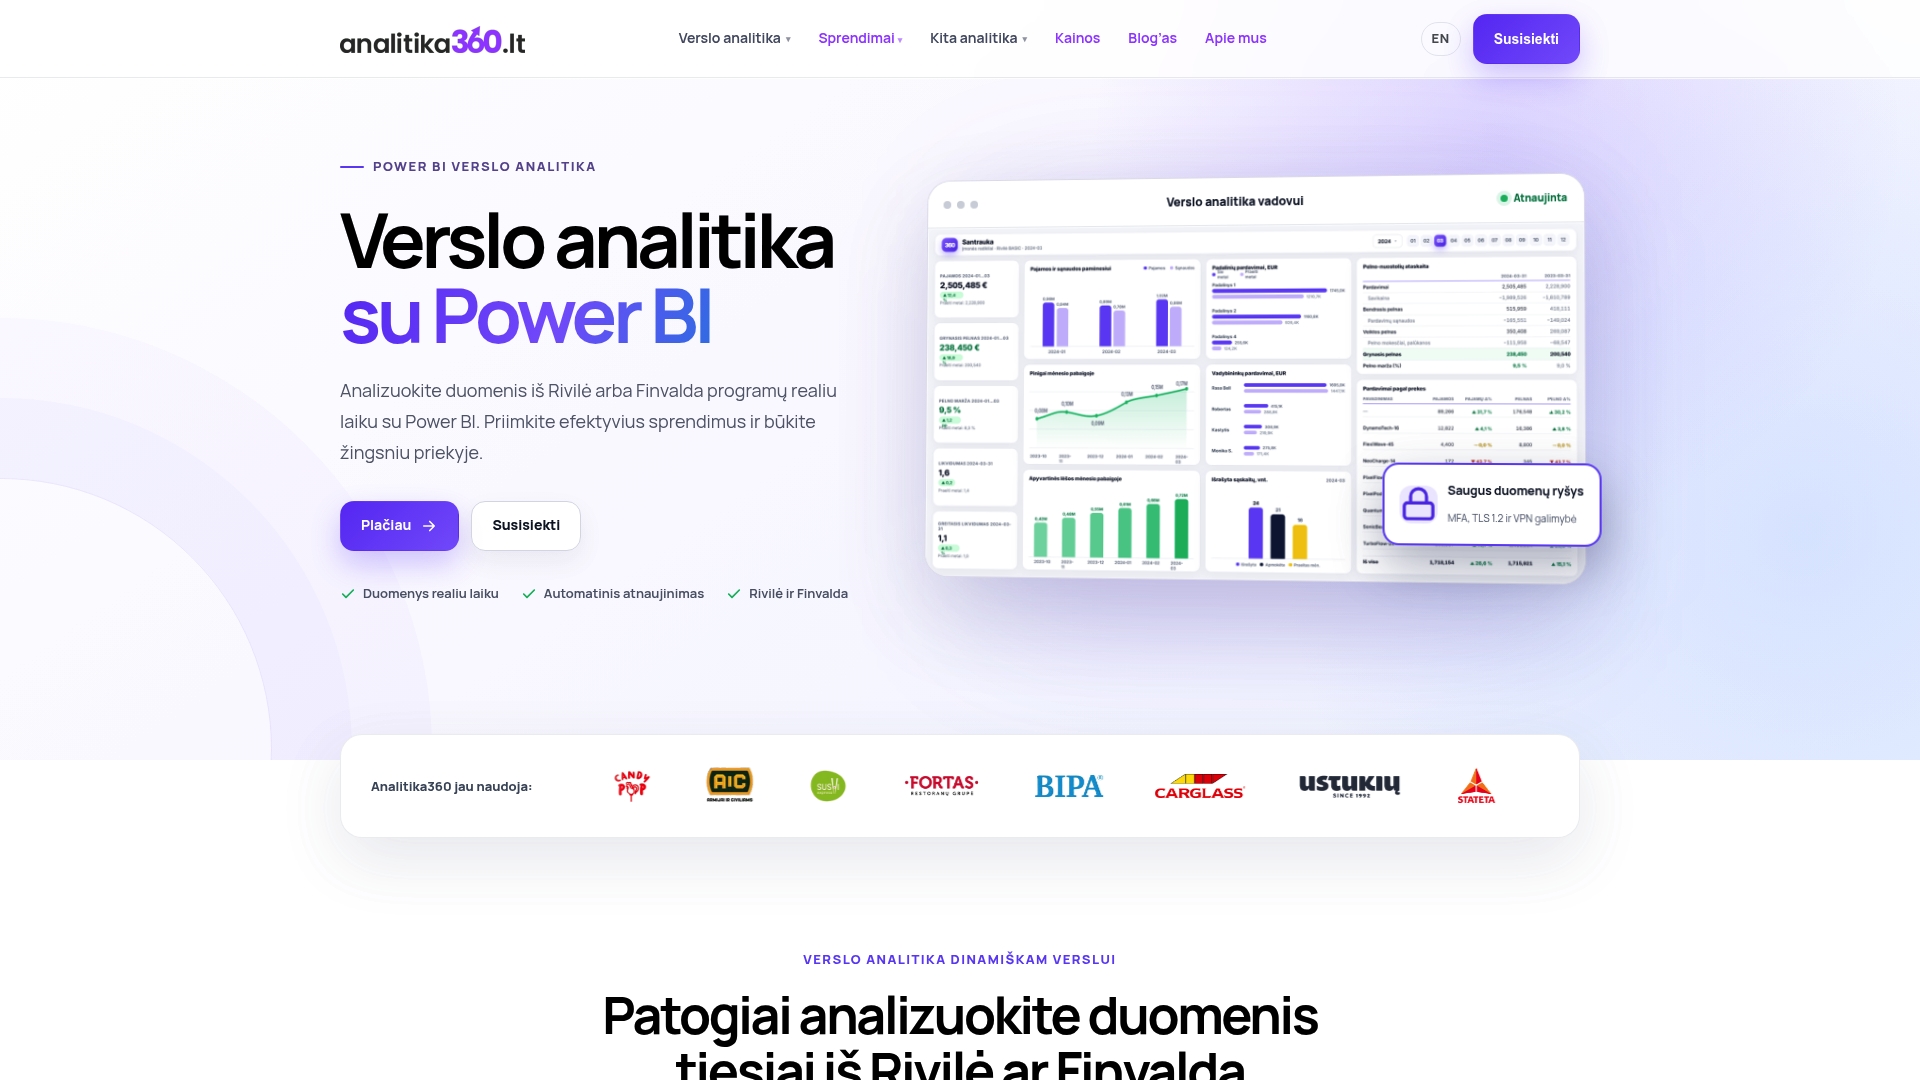
Ready-built and customised Power BI report packages are available. A package includes an initial data audit, alignment of the chart of accounts and cost-centre mapping, tailoring of the report set to the company’s specifics, and ongoing support when the account structure changes. Profit, expense and revenue indicators refresh automatically, and management sees them in real time.
If you would like to see how such a package would look with your Finvalda data, take a look at the Finvalda and Power BI reporting solution and order an initial audit to assess how much time you would save each month.
Frequently asked questions
Why does the Finvalda profit and loss statement show incorrect figures?
The most common reason is that account numbers have not been assigned to report lines, or a new account has been left outside the grouping. Check the report tree before looking for the error in the journals themselves.
How do I assign accounts to profit and loss lines in Finvalda?
In the report tree configuration, specific account numbers or ranges are assigned to each line (revenue, cost of sales, expenses), following the Finvalda user guide.
Does the Finvalda P&L automatically comply with VAS requirements?
Not automatically. The system allows the statement to be prepared using the function method with cost of sales, but the line mappings have to be aligned with the VAS template structure manually.
What are cost centres for in the Finvalda profit and loss statement?
Cost centres let you see profitability by division, project or object, but they only work when they are assigned consistently to every transaction.
How can I get a real-time Finvalda profit and loss statement?
The Finvalda Finance PRO and WEB modules let you see daily indicators, while Analitika360 Power BI packages additionally automate the refresh and combine the data with other sources without manual work.
When should I call in an implementation specialist about P&L errors?
If the error recurs for several months in a row or relates to the structure of the report tree itself rather than the mapping of a single account, it is worth contacting a Finvalda implementation specialist.