
For Finance and IT Leaders in Lithuania: 5 Practical Steps to Implementing POS and Power BI

Yes, it is worth connecting your POS system to Power BI if you want to see sales, inventory and profit in one place in real time. The best results come from an automated ETL process or a direct SQL/API connection with scheduled automatic refresh. Before you start, you need to plan three things: the technical connection, the migration of historical data and long-term support. Analitika360 helps deliver the whole process, from the first prototype to ongoing operation.
In brief:
- The direct SQL access model is fast, but it can put load on the sales database and be inefficient for larger companies.
- The ETL model is the most reliable if you plan to connect several shops or POS vendors, because it protects the system from overload and lets you centralise your data.
- Historical data and the right access permissions need to be thought through in advance, and security covers proper authentication and data encryption.
- Configuring the Power BI Gateway and automating data refresh are essential for a continuous, reliable flow of data.
- Implementation usually runs in five stages, and the better the data preparation is planned, the lower the likely additional costs later on.
Contents
- How POS and Power BI integration works: architecture and options
- What technical infrastructure the implementation requires
- Which POS data and KPIs are worth tracking
- How long implementation takes and the most common mistakes
- What experience Analitika360 has in delivering these integrations
- How to get started with POS and Power BI integration with Analitika360
- Sources
How POS and Power BI integration works: architecture and options
POS and Power BI integration is achieved in three main ways, and the choice depends on data volumes, security requirements and how quickly you want to see changes.
A direct SQL connection suits cases where the POS system stores its data in a local or cloud database and Power BI can connect to it directly in DirectQuery mode. This model gives a near real-time view, but it loads the production database with queries.
An API or dedicated connector is a common route when the POS vendor provides a ready-made interface. For example, LithosPOS offers its own Power BI custom connector, which lets you load sales data straight into reports without building an additional data store.
ETL with an intermediate data store is the most robust option for larger businesses: data from the POS, Rivilė or Finvalda is periodically extracted, cleaned and loaded into a separate database from which Power BI reads its reports. This model protects the production system from overload and allows several sources to be combined in a single model.
- Direct SQL: fast, but risks overloading the till system.
- API/connector: the simplest to implement, where the vendor supports it.
- ETL/data store: the most reliable for long-term use and multiple data sources.
From a security point of view, the most important thing is to define access permissions correctly: who can see which shop’s data, how login credentials are stored and how the connection between the POS database and Power BI is encrypted. These questions are addressed when setting up the Power BI Gateway, covered in more detail in the next section.
Pro tip: If you plan to connect several shops or several POS vendors at once, choose the ETL model from the outset. Moving from direct SQL to a data store later costs considerably more than designing it properly in the first phase.
What technical infrastructure the implementation requires
The technical implementation starts with the connection between the POS data source and the Power BI environment. Microsoft’s documentation describes Power BI Gateway configuration as an essential intermediate layer when data is held on a local server and reports are viewed in the cloud.
- Installing the gateway. The application is installed on a local server, a virtual machine or in an Azure environment, and then linked to the organisation’s Power BI account.
- Choosing the connection type. If the POS vendor provides a ready-made connector, as in the case of LithosPOS, implementation is limited to setting up authentication. If not, a custom SQL or API connection is built.
- Preparing the ETL logic. This stage defines how data is cleaned, how historical records are loaded and how unit costs are synchronised.
- Setting up automatic refresh. Reports are configured to refresh on a schedule, usually several times a day, or in real time if the infrastructure allows it.
This sequence was applied in an automated Power BI intelligence dashboard project for a Lithuanian bakery chain, where the technical connection, the import of historical data and automated refreshes were put in place one after another so that the reports worked from day one.
The accounting programs used in Lithuania also have their own interfaces: Rivilė’s POS module and Finvalda’s sales module allow sales data to be exported or linked directly to other systems, which reduces the need for additional coding. A practical example of how to connect Power BI to Rivilė shows that most standard connections can be set up without complex custom development.
- A custom connector is suitable when the vendor officially supports it.
- ETL tools (e.g. Power Query, Azure Data Factory) are needed when data comes from several systems.
- A test environment is essential before moving the solution into production.
Which POS data and KPIs are worth tracking
The data model determines how much value you get from your reports. The minimum recommended set of tables covers transactions, items, shops, prices, unit costs, discounts and refunds. Without these seven tables it is hard to bring the sales and profitability picture together.
- Transactions — the date, time, shop, cashier and amount of each transaction.
- Items — products sold, quantities, SKU codes.
- Stores — a list of shops with region and type.
- Prices and costs — the selling price and unit cost of each product.
- Discounts and refunds — discounts and returns, without which margin is calculated inaccurately.
The key KPIs a finance director should see every day are sales value, gross margin, net profit, stock write-offs, inventory levels and the share of each sales channel. Practical projects show that by combining POS SQL data with regularly updated unit cost figures, you can track margins and losses by channel more accurately than in separate Excel spreadsheets.
KPIs and profitability: when POS transactions are linked to accounting data through common fields (e.g. the product code or invoice number from Rivilė or Finvalda), you get a complete profitability analysis from sale to cost of sales, without the need for additional manual reconciliation.
This kind of link allows an analytics platform such as Analitika360 to calculate automatically not only sales volume but also the real profit for each shop or product group.
How long implementation takes and the most common mistakes
Implementation usually runs in five stages: analysis, prototype, building the ETL or data store, setting up automation, and support.
- Analysis (a week or two) — the data sources, the POS vendor’s capabilities and the required KPIs are assessed.
- Prototype — a first version of the reports is built with a limited amount of data so the team can sign off the model.
- ETL / data store — the full data synchronisation logic is put in place, including historical records.
- Automation — regular refresh is set up with no manual intervention.
- Support — the reports are maintained and adapted as the business grows.
Costs are driven mainly by the number of data sources, whether a custom connector is needed and how much historical data has to be migrated. The larger part of a project is often not the Power BI licence itself but the work of cleaning and combining the data.
The most common mistakes are SKU codes that do not match between the POS and the accounting system, historical data that is messy or not migrated at all, and poorly configured access permissions that later make it harder to add new users.
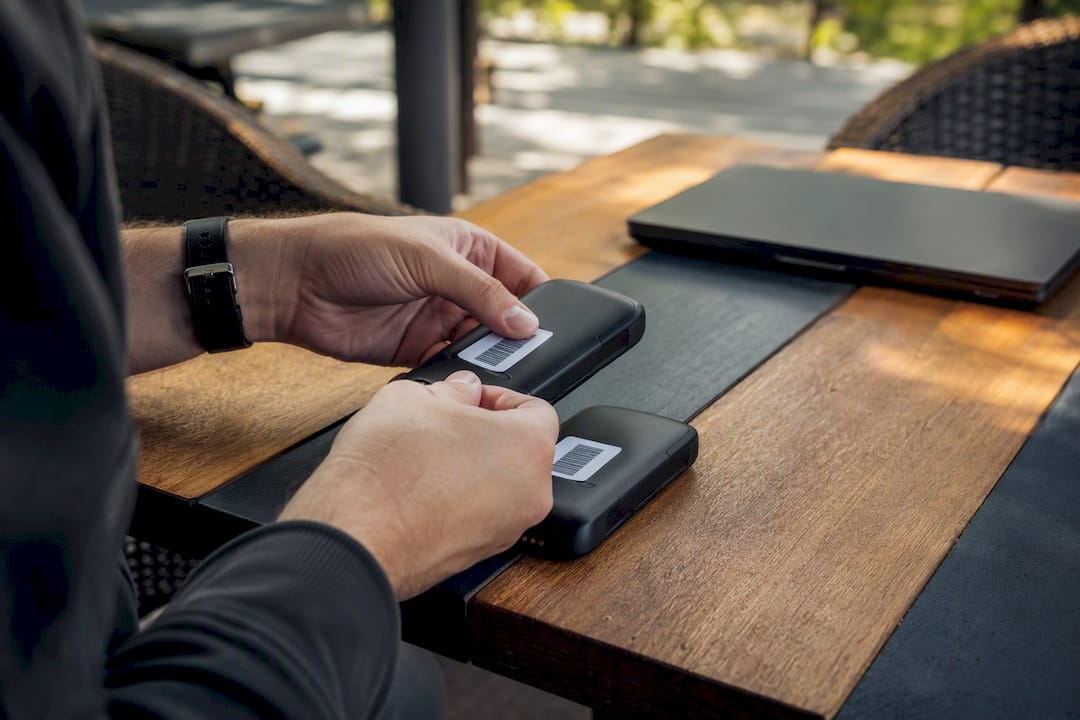
Pro tip: Before signing an implementation contract, ask the vendor to show you how SKU matching between the POS and the accounting program works in a real example, not in a theoretical diagram. This one detail usually decides whether the project will take the planned time or drag on for twice as long.
What experience Analitika360 has in delivering these integrations
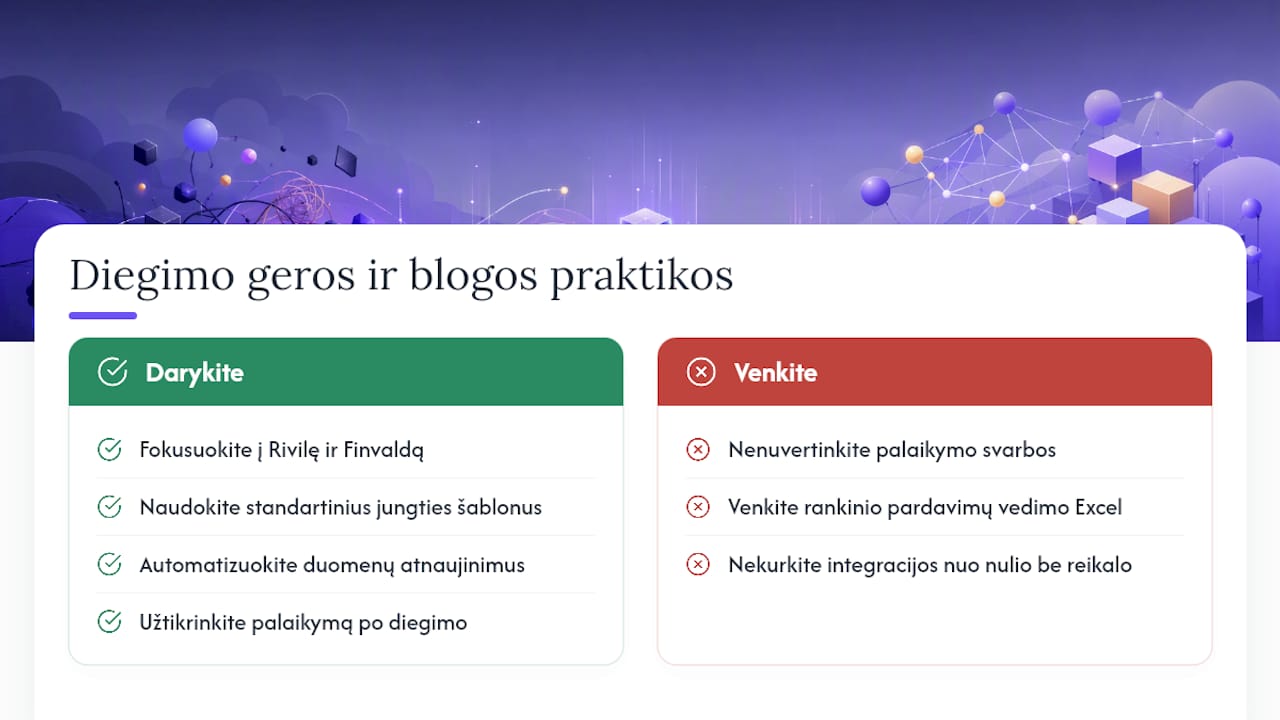
Analitika360 delivers POS and Power BI solutions focused specifically on Rivilė and Finvalda, as these are the accounting systems most widely used by Lithuanian businesses. This focus makes it possible to prepare standard connection templates that can be adapted faster than building an integration from scratch.
Clients gain the most not from the connection itself but from what happens after it: automated refreshes mean that an accountant or the manager of a restaurant chain no longer has to key sales into Excel by hand. Post-implementation support is the part that is often underestimated, but without it reports become out of date within a year as the business adds new shops or product lines.
— Analitika360
How to get started with POS and Power BI integration with Analitika360
There is no need to start from a blank page. Analitika360 has ready-built report packages, such as CockpitSHOPS retail analytics, designed specifically for retail with POS data, and you can also commission a bespoke project if your business structure is more complex.
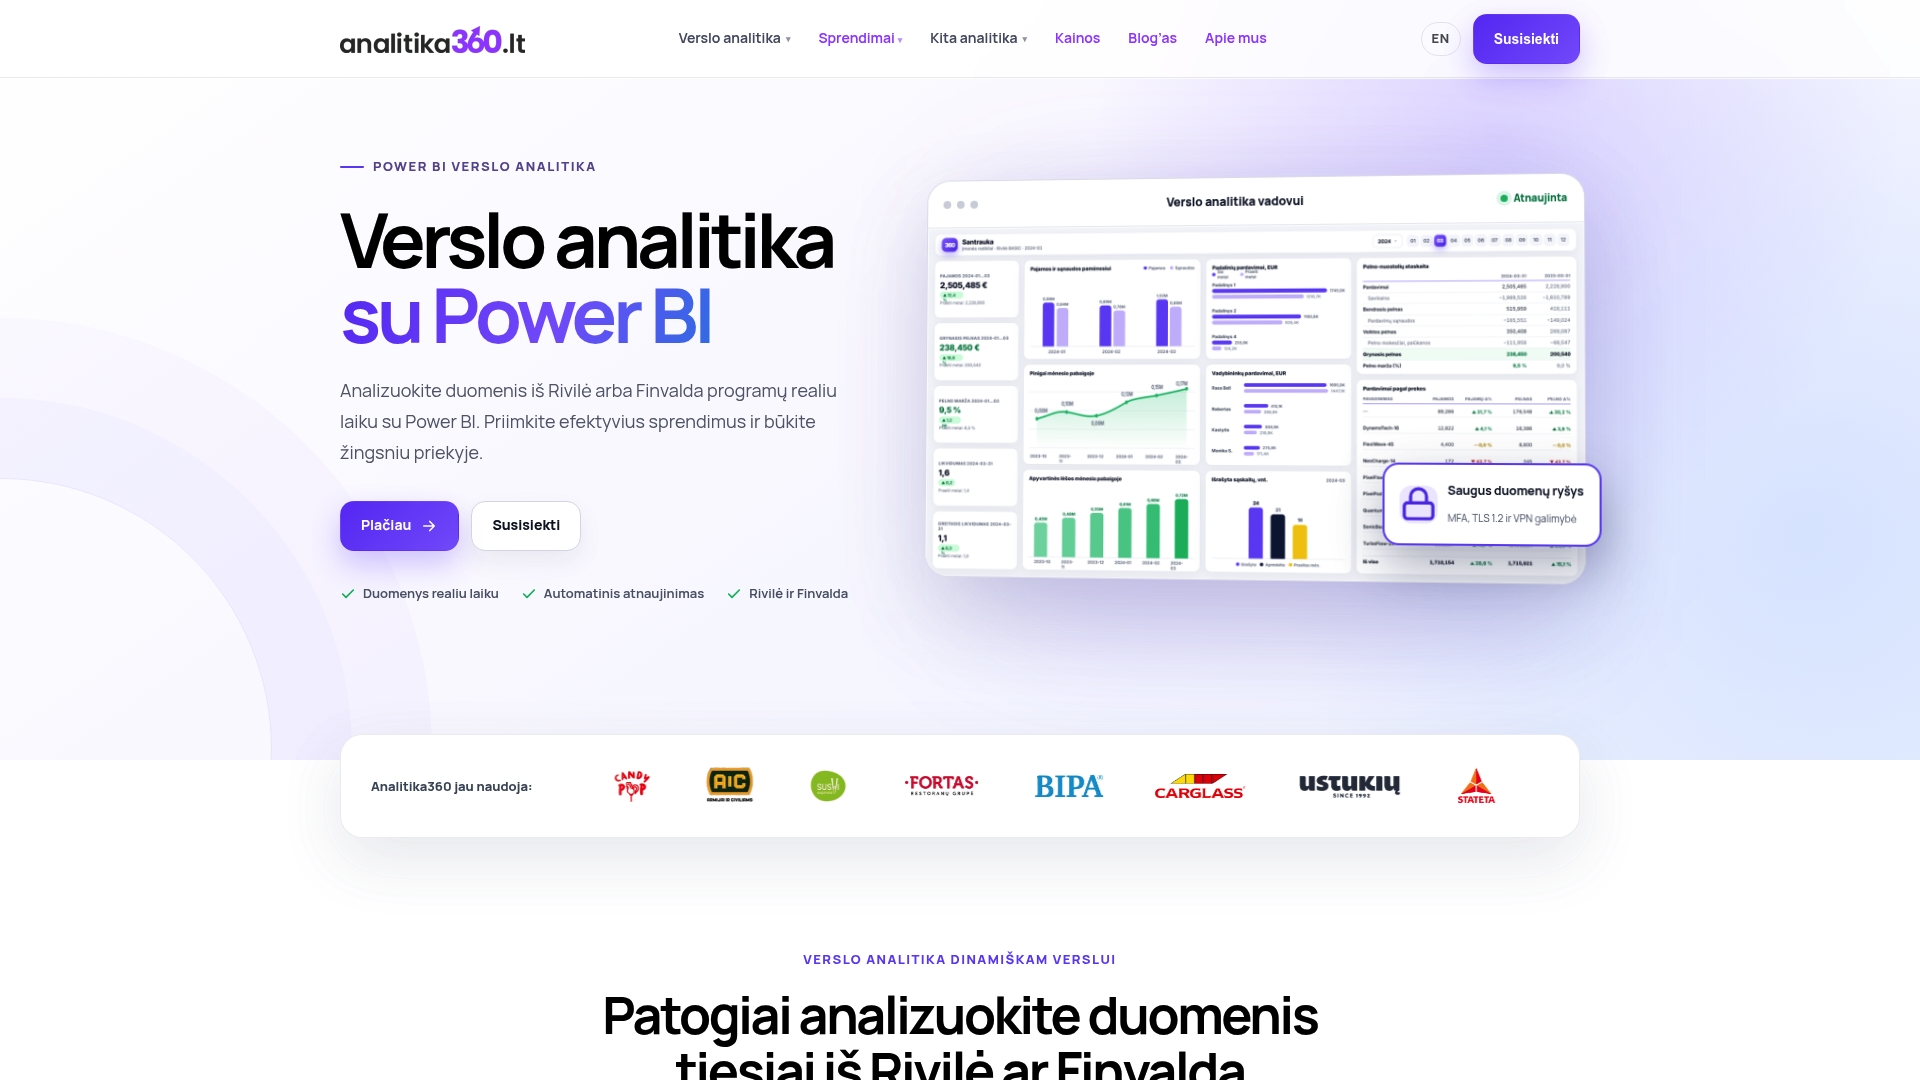
The first steps usually look like this: a quick prototype with a limited amount of data within a few weeks, followed by the import of historical data and finally the set-up of automatic refresh so that the reports run without further intervention. Unlike a generic Power BI implementation from scratch, a ready-built package lets you see the first results sooner, because the data model and KPI structure have already been designed around the specifics of POS and accounting data.
If you would like to see first what such reports look like in practice, take a look at our Power BI report examples or browse the full list of business analytics solutions by industry, and get in touch to arrange a demo tailored to your POS and accounting system.
Sources
- Building an automated Power BI intelligence dashboard for a Lithuanian bakery chain — Civitta
- Set up Power BI integration — Microsoft Learn
- Power BI Custom Connector for LithosPOS — LithosPOS Help