Your business in 360°
 Route analysis: how to cut time, costs and emissions

Route analysis compares several route scenarios by capacity, time windows and cost, and picks the best one for the network as a whole. The LogisticsBrain project promises double-digit savings in costs, CO2 and tyre wear. A study by Fraunhofer ISI and Einride shows a total cost of ownership (TCO) 8–13% lower.
In brief:
- In the Fraunhofer ISI and Einride study, route and charging planning reduced total cost of ownership by 8–13%, whereas simply replacing diesel lorries with electric ones yielded about 3%.
- Integrated route and charging planning allowed up to 85% of loads to be delivered by electric lorries, compared with 57% when vehicles were swapped on a 1:1 basis.
- Heuristic algorithms suit a small number of orders and simple constraints; for a complex network, choose mathematical models or artificial intelligence.
- Start the pilot in a single area and spend a few weeks comparing distance, time and cost per order against a baseline period; incorrect addresses distort the results.
Contents
- How does route optimisation logic work?
- What data does route analysis need?
- Which KPIs should you track and how should you calculate them?
- From heuristics to AI: which method should you choose?
- How can you carry out the analysis in a few weeks?
- What benefits do research and practice show?
- What integrations and reports are needed for day-to-day operations?
- Why does data integration speed up decisions?
- How do our solutions complement route analysis?
- FAQ
- Sources
How does route optimisation logic work?
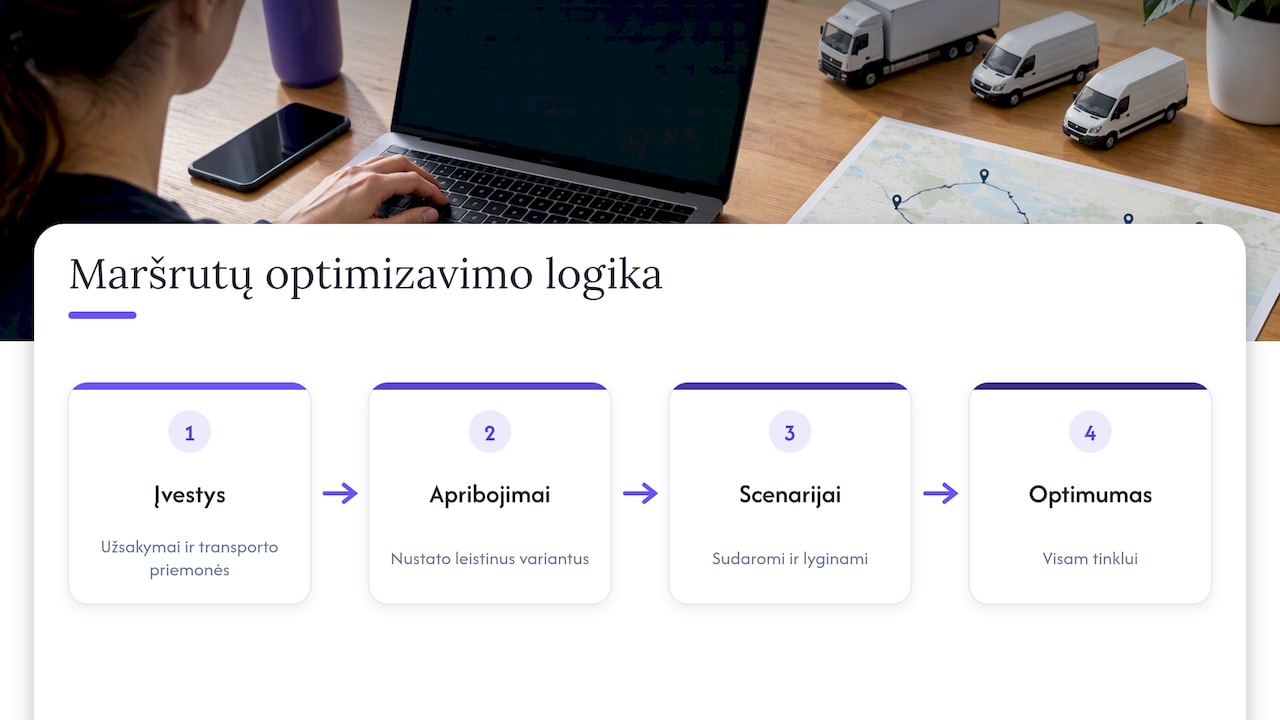
A route model consists of orders, vehicles, time windows and constraints. An order has a location, a load weight and a permitted delivery window. A vehicle has a capacity, working hours and running costs. Constraints, such as drivers’ rest periods or charging requirements, determine which options are feasible at all.
The analysis does not generate a single route; it builds many scenarios and compares them. One scenario may shorten the distance but exceed a driver’s working hours. Another may fit within working hours but require an additional vehicle. The aim is a global optimum for the whole network rather than the best version of each individual route. This is exactly the kind of problem addressed in the academic literature by MCVRPTW-type models, which simultaneously take into account load weight, working hours, traffic conditions and the charging needs of electric vehicles.
A practical example: if permitted working hours are shortened, the last deliveries may pass to another driver and zone boundaries may shift. That is why the analysis is worth repeating every time the constraints change.
What data does route analysis need?
Accuracy depends on the quality of the input, so start with static data:
- addresses and coordinates with verified geocoding;
- delivery time windows for each order;
- load dimensions and weight;
- vehicle capacity, fuel or energy consumption and working-hour limits.
Add dynamic data to these: traffic information, weather, telemetry and events during the route. Updating the travel-time matrix in real time and testing with large volumes of data are a standard part of such projects, as can also be seen in the descriptions of public funding applications.
Quality control involves checking geocoding results, correcting incorrect addresses and comparing planned distance with actual distance. Where data are missing, flag them as an assumption rather than quietly filling the gaps with averages.
Pro tip: Before the first modelling run, review the most problematic addresses by hand: this can reveal geocoding errors.
Which KPIs should you track and how should you calculate them?
KPIs should be simple and calculable from the same data. The main indicators are:
- total distance: the sum of all route lengths over the period;
- driving time: actual time spent driving, excluding stops;
- variance between planned and actual distance: (actual − planned) / planned;
- cost per order: total route costs divided by the number of orders fulfilled;
- change in CO2 and change in TCO compared with the baseline period.
An example from the research: systematic AI optimisation reduced TCO by 8–13%, so a change of that size is best treated as a benchmark rather than a guarantee for your own network.
Set the monitoring interval to match the rhythm of your operations: track execution daily and costs weekly. If the variance between planned and actual distance in one zone is consistently higher than in others, that is a signal to review how that zone is assigned. We explain how to link these indicators to the financials in our guide to transport cost analysis.
From heuristics to AI: which method should you choose?
Heuristic algorithms such as 2-opt, tabu search or simulated annealing quickly improve existing routes. They are suitable when there are few orders and the constraints are simple. The drawback is that the solution can get stuck in a local optimum, so the result depends on the initial plan.
When there are many constraints (time windows, capacity, working hours, charging), it makes sense to use the mathematical models and metaheuristics described in the MCVRPTW literature. They calculate more slowly but deliver a more stable result at network level.
For lorries, eco-routing also matters. The module described in the COMPANION D5.1 document uses A* search, incorporates traffic and infrastructure data, supports ‘short’, ‘fast’ and ‘economic’ criteria, and aims to calculate a 1,000 km route in under 15 seconds.
The advantage of AI solutions lies in scenario analysis and adapting to real-world data. In the Fraunhofer ISI and Einride study, integrated route and charging planning enabled up to 85% of loads to be delivered by electric lorries, whereas a simple 1:1 replacement reached 57%. The rule of thumb is simple: start with heuristics and move to AI once manual fine-tuning can no longer cope with the constraints.
How can you carry out the analysis in a few weeks?
It is worth limiting the pilot to one area, a set number of orders and a handful of drivers. The steps are:
- Prepare the data: addresses, time windows and vehicle parameters.
- Model the routes and compare them with the existing ones.
- Run the pilot in the chosen area.
- Assess the KPIs against the baseline period.
- Repeat with adjusted constraints.
Choose checkpoints according to how the pilot progresses: first check data accuracy, then compare distance, time and cost per order. The main risks are data errors and operational obstacles, such as drivers’ reluctance to change their usual sequence.
Pro tip: Discuss the first modelled routes with drivers before the pilot: they often spot constraints that are not in the data.
A plan for rolling out real-time reporting is useful for displaying the results day by day.
What benefits do research and practice show?
The LogisticsBrain project description states that a self-learning AI system can deliver double-digit savings in planning time, costs, CO2 and tyre wear, and that scenarios can be optimised in parallel.
An 8–13% reduction in TCO with AI optimisation, compared with about 3% from simply replacing diesel with electric on a 1:1 basis (Fraunhofer ISI and Einride, 2025). The difference shows that most of the benefit comes from planning, not merely from replacing vehicles.
What this means for a medium-sized network:
- expect a greater effect where routes have been planned manually and there are many constraints;
- expect a smaller one where the network is small or already well tuned;
- data quality directly affects the outcome: incorrect addresses or time windows reduce the real benefit.
These figures are benchmarks from a research context; only a pilot will show the result for your own network.
What integrations and reports are needed for day-to-day operations?
A typical architecture connects a transport management system (TMS), telematics and a reporting layer, such as Power BI, with automatic data refresh. Include:
- a KPI dashboard showing distance, time, cost per order and CO2;
- execution analysis: plan versus actual by zone and driver;
- anomaly detection when a route deviates significantly from the plan;
- synchronisation via API with a clearly defined refresh frequency.
When choosing a reporting package, check whether it includes automation, ready-made templates and integration with Rivilė or Finvalda. We describe data structure and standards in our guide to the finance data model.
Why does data integration speed up decisions?
In our view, what slows decisions down is not a lack of analysis but scattered data. When route, cost and accounting figures are visible in one place, a manager sees a deviation the same day rather than at the end of the month. We recommend starting with a small pilot project and measuring results from day one.
— Analitika360
How do our solutions complement route analysis?
Route analysis produces figures, but a manager needs a quick view of them alongside the financials. This is where we help:
- ready-built Power BI report packages that combine data from Rivilė and Finvalda;
- automated reports that refresh without manual work;
- bespoke projects when you need to connect a TMS, Excel or other sources.
This suits managers and finance professionals who need to see KPIs quickly. We offer the Rivilė Basic package for €59 a month and bespoke projects at €70 an hour; you will find our prices on our pricing page. Write to us and let’s arrange a demonstration or a pilot using your data.
FAQ
What is route analysis and what is it used for?
It is the comparison of route scenarios by distance, time, capacity and cost. Planners and managers use it to select the most efficient route network.
What data do you need to start route analysis?
You need addresses or coordinates, delivery time windows, load weight and dimensions, and vehicle parameters. Traffic and telemetry data improve accuracy further.
Which KPIs should you track to assess route efficiency?
The most important are total distance, driving time, the variance between planned and actual distance, cost per order and CO2. The change in TCO completes the financial picture.
How long does a route analysis pilot take?
Plan for a few weeks for the pilot, and set checkpoints according to data preparation and the size of the pilot area. The duration depends on data preparation and the size of the pilot area.