Your business in 360°
 Phased Roll-out of Real-Time Reporting and Its Return on Investment

Yes, real-time reporting is usually a worthwhile investment: it cuts the delay in decision-making and gives genuine visibility of cash flow. A manager who sees income, costs and debts on the same day, rather than after the month-end close, reacts faster than a competitor still waiting for the accountant’s report. Success depends on choosing the right KPIs and on automated integration with the systems already in place, and Analitika360 already builds packages of this kind.
In short:
- Without clear data standardisation, real-time reports can show incorrect figures and undermine trust in the system.
- Automated data import and the ability to reconcile several sources are needed for reports to be accurate and continuously up to date.
- First, appoint one person responsible for data quality and integrate in phases, rather than rolling everything out in one go.
- Power BI is an important tool, but it will only work effectively once the data sources have been cleaned and standardised beforehand.
- Real-time reporting is not just a technology investment but a matter of data discipline, which has to be developed consistently.
Contents
- How real-time reporting creates value for a business
- Which features and technical capabilities are essential
- How to bring several data sources into one system
- How the roll-out works step by step
- Which KPIs to show the manager first
- How to avoid unreliable automated reports
- How Analitika360 tackles these challenges in practice
- What to know before you start the roll-out
- How to start rolling out real-time reporting in your company
- Sources
How real-time reporting creates value for a business
Managers with automated financial visibility spot risks sooner and make cash-flow decisions not a week later but on the same day the situation changes. This changes the whole rhythm of work: the accountant no longer has to prepare a report by hand every Monday, and the manager of a restaurant chain sees each outlet’s daily takings by the evening, not on the fifth day of the following month.
The benefits show up at several concrete levels, particularly given the impact of financial technology on small businesses and their currency exchange habits, which you can read more about at valiutos keitykla:
- Time savings. Automated accounting systems reduce the amount of manual work and the number of errors, because data no longer has to be moved between Excel files by hand.
- Better cash-flow management. An aged receivables report refreshed daily lets you call a late payer sooner.
- Project profitability control. A construction or logistics company can see which project is already over budget while there is still time to change course, rather than after the work is finished.
- Fewer errors through bank connections. Automated data import eliminates the transcription errors that often creep in when amounts are transferred by hand.
A word on costs: the cheapest solution on the market is not always the cheapest over three years. A poorly designed report that has to be corrected by hand every month ends up costing more in the long run than a better-thought-out, if more expensive, model.
Which features and technical capabilities are essential
When choosing a real-time reporting solution, it pays to insist on a concrete technical specification rather than general promises of ‘modern analytics’. Six features separate a working solution from a pretty presentation:
- Automated data import from bank accounts, accounting software and point-of-sale (POS) systems without manual exports.
- OCR document scanning and categorisation, which recognises invoices and automatically assigns them to the correct cost category.
- Scheduled automatic report refresh, not just a manual refresh at the press of a button.
- Cloud access with user roles and an audit trail showing who changed data and when.
- Power BI visualisations with filtering by business unit, period or product line.
Components like these, including RPA and OCR technologies, are already used by companies looking to automate report generation from CRM, accounting and analytics data.
Expert tip: Before signing a contract, ask the supplier to show you a real dashboard with data from your sector, not a generic demo version. The difference between ‘looks good’ and ‘works for your business’ usually becomes clear right here.
How to bring several data sources into one system
The ‘single source of truth’ principle means that every department works from the same figures, not from five different Excel files in different versions. The usual order of priority is:
- The accounting system (for example, Rivilė or Finvalda) as the foundation for financial data.
- Bank connections, giving a real-time view of cash balances and payments.
- CRM and sales systems, filling out the picture with customer and order information.
- Warehouse and POS data, especially relevant for retail and hospitality businesses.
- Excel and SharePoint as a supplementary source where automated integration is not yet in place.
Before the sources are joined up, the data needs to be cleaned and standardised: charts of accounts, currencies and date formats must be aligned. Then you choose the technical method: API connections are the fastest and most stable, ETL processes suit periodic transfers of larger volumes of data, and RPA is useful where a system has no open API but a repetitive task still needs automating.
How the roll-out works step by step
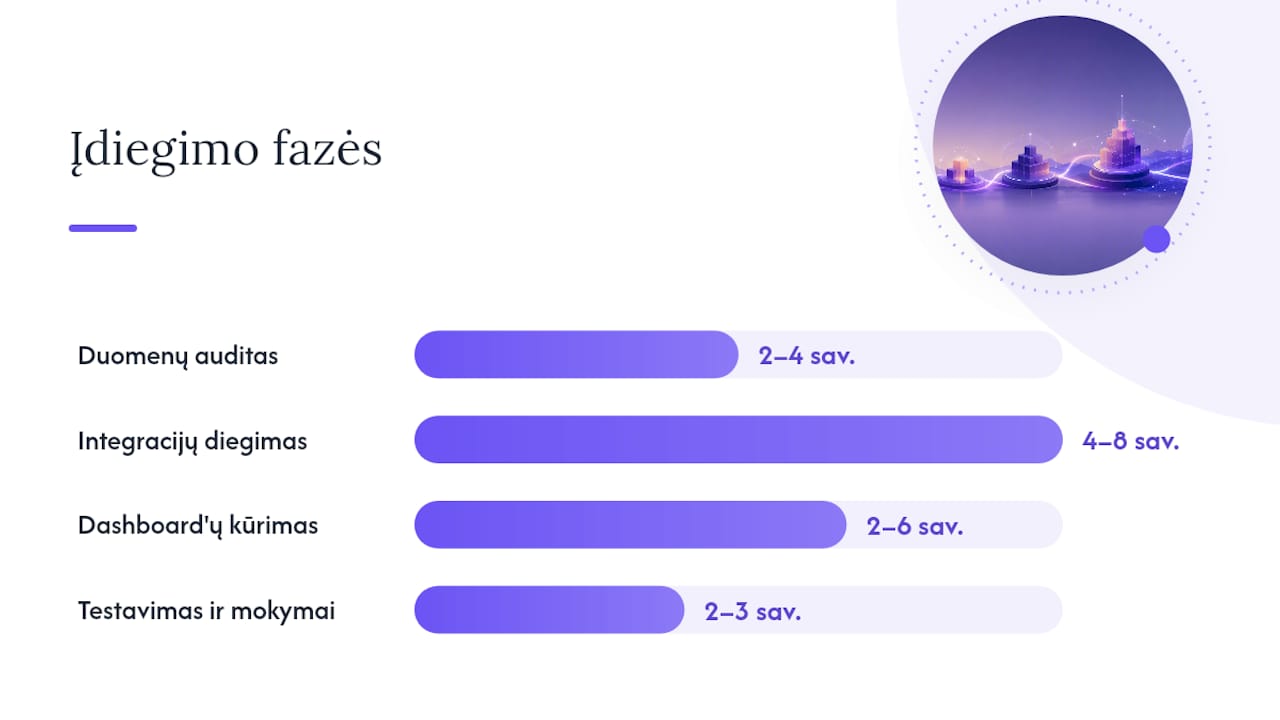
The recommended sequence is standardisation, then integrations, then report building and finally testing with training. Trying to roll out everything at once usually ends in chaos and distrust of the data.
- Data audit (2 to 4 weeks). Existing sources are assessed, and gaps and duplications identified.
- Integration roll-out (4 to 8 weeks). The accounting, banking and CRM systems are connected to the reporting platform.
- Dashboard building (2 to 6 weeks, depending on complexity). The visual elements and KPI hierarchy are designed.
- Testing and training (2 to 3 weeks). The team learns to interpret the data, not just look at it.
Every phase needs an appointed data owner who is responsible for the accuracy of the sources. Without one, automation will grind to a halt at the first discrepancy.
Expert tip: Don’t rush to automate everything at once. First stabilise the core data flows, then gradually add more sophisticated analysis and forecasting.
Which KPIs to show the manager first
Leading indicators show what is happening now and allow you to influence the outcome, while lagging indicators show what has already happened. Cash balance, the flow of new orders and average invoice value are leading indicators, because you can still change course in response to them. Monthly profit or annual turnover are lagging, as they merely confirm past results.
Specific KPIs worth placing at the top of the dashboard:
- Cash balance and projected cash flow 30 days ahead.
- Number of orders from new customers per week.
- Average invoice value by business unit or product line.
- Receivables broken down by days overdue.
Managers who see these indicators in real time spot risks earlier than those relying on a month-end report. A good dashboard has a single BLUF element at the top that answers the question ‘is everything all right today?’ within seconds, with the detail available further down. In visualisation, less is more: three colours to mark the level of risk (green, amber, red) work better than ten different shades that nobody remembers.
How to avoid unreliable automated reports
Automation saves time, but without clear rules it becomes a risk. If messy data goes into the system, the report will be nicely formatted but wrong.
- Standardise data formats before automating them, not afterwards.
- Decide which actions happen automatically and which require human approval (for example, large transfers).
- Insist on an audit trail for every figure on the dashboard, so that its source can be traced if questions arise.
- Carry out periodic data health checks, not just during the roll-out.
When automating accounting and reporting processes, an audit trail and explainability must be maintained so that AI solutions do not become an inexplicable ‘black box’ in the event of an audit.
This is particularly relevant for finance teams that have to answer for every figure at a board meeting.
How Analitika360 tackles these challenges in practice
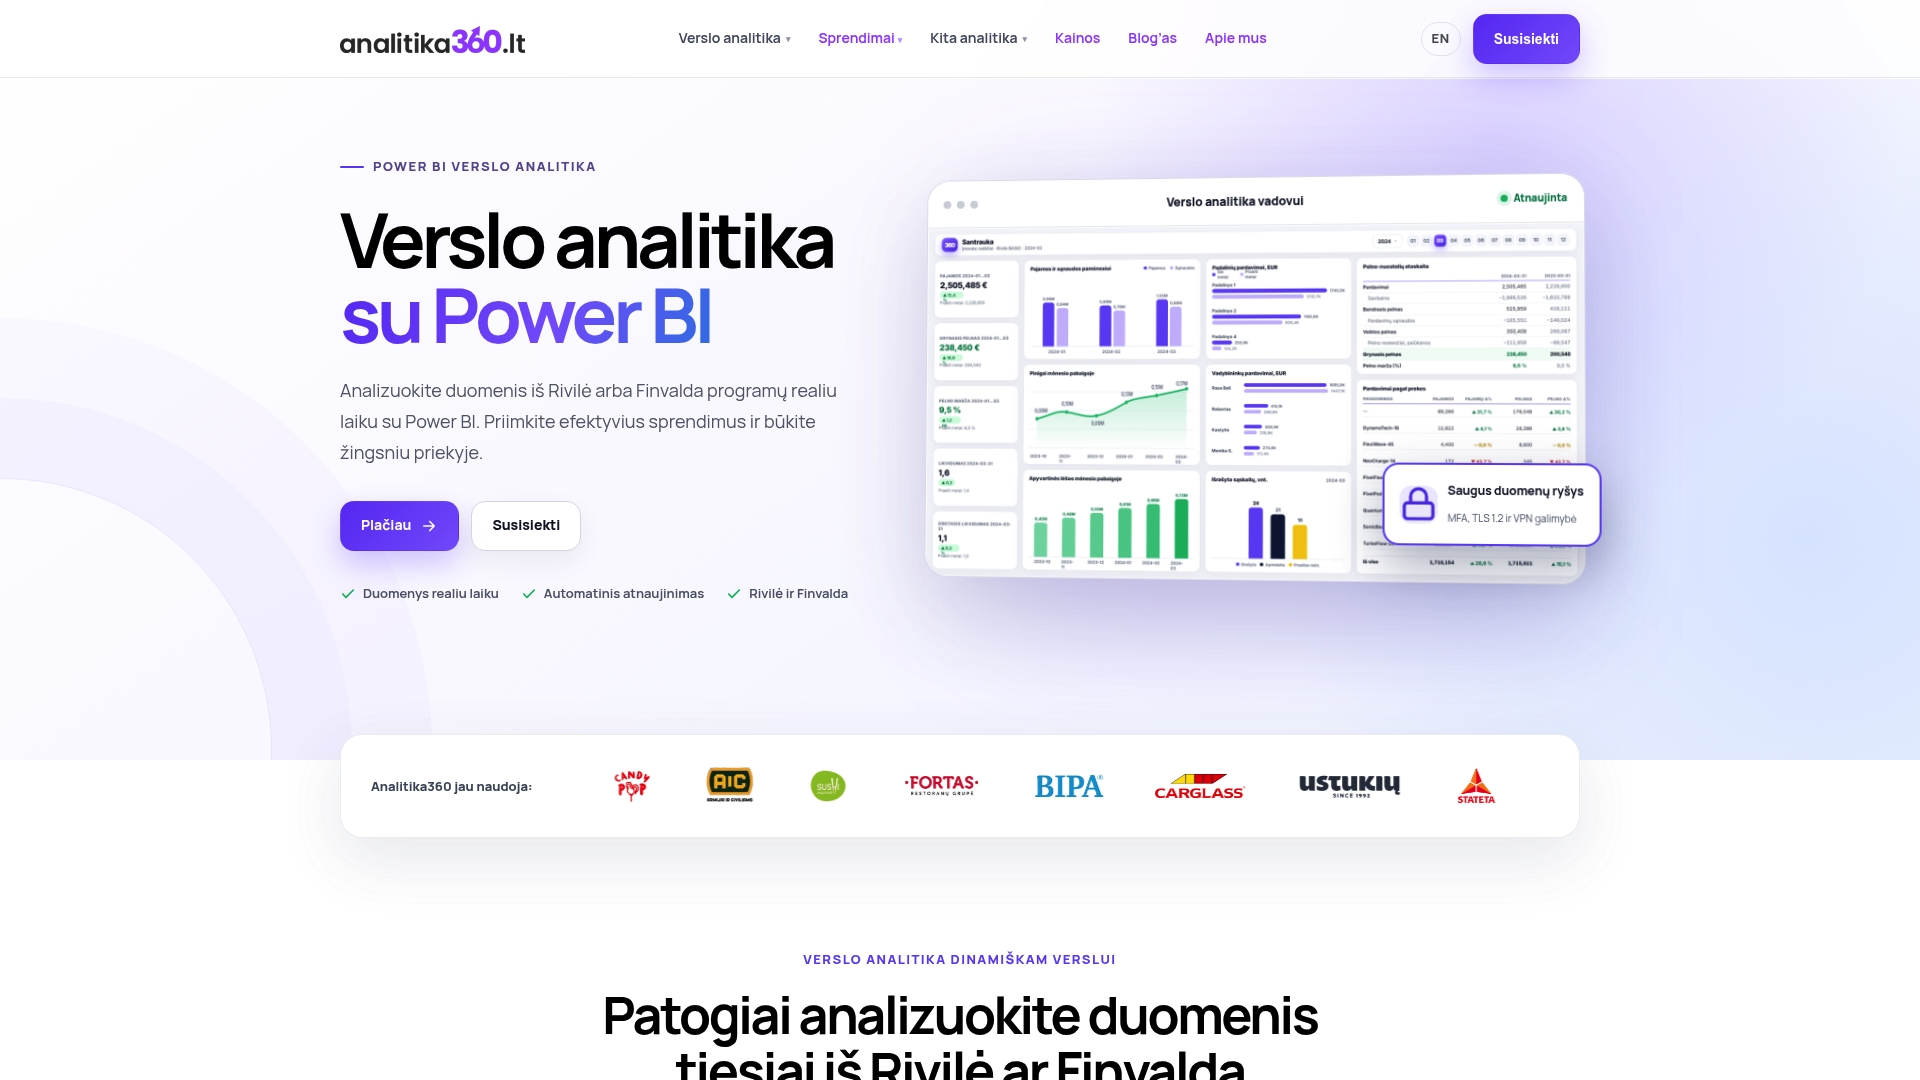
Analitika360 builds ready-made and customised Power BI report packages integrated with the Rivilė and Finvalda accounting systems, as well as with SharePoint, Excel and CRM systems. The reports refresh automatically without any further input from the user, and restaurant chains and accounting firms use them to track income, costs and profit in real time. It is worth looking at concrete examples of a ready-made management report summary before choosing a solution for your own company.

What to know before you start the roll-out
Most managers mistakenly think that real-time reporting is a technology purchase. In reality, it is first and foremost a matter of data discipline. Even the most powerful Power BI dashboard will not solve the problem if the chart of accounts changes every quarter or if three departments calculate the same margin differently.

The usual market advice goes like this: buy a platform, connect everything and look at the results. This shortcut skips the most important stage, standardisation before integration. Companies that skip this step end up with attractive but misleading reports, and trust in the data disappears faster than it can be rebuilt.
What a manager really needs to do: first appoint one person responsible for data quality, then opt for phased integration rather than turning the whole system upside down in a week. A solution built on Power BI, such as the one Analitika360 offers, only works well once the underlying data flows are already in order. Technology here is the outcome, not the starting point.
— Analitika360
How to start rolling out real-time reporting in your company
Unlike general analytics platforms that you have to spend months configuring yourself, Analitika360 offers ready-made Power BI report packages that work with Rivilė and Finvalda data without a lengthy roll-out.
If you are still compiling reports by hand from Excel files, the first step is not buying new software but a short assessment of your data flows. Analitika360 helps companies move from month-end reports to day-to-day visibility, tailoring the solution to your sector, whether that is a restaurant chain, logistics or construction. Browse our solutions by sector and get in touch about an initial data audit or a demo using your real figures.
Sources
- Automation: what it is, how it works and how it helps businesses save time and money and achieve 200–400% ROI
- Real-time business visibility
- Finance teams and artificial intelligence: how to avoid burnout when automating accounting and reporting