
Finvalda Balance Sheet Analysis: A Practical Guide for Accountants

Finvalda balance sheet analysis means applying vertical and horizontal analysis to Finvalda reports, so that a company’s liquidity, level of indebtedness and capital structure can be established in a few clear steps. The result is not just a line-by-line comparison but concrete ratios (liquidity, leverage, turnover) that can be presented to management. In this article you will find worked calculations, a list of common errors and a route to automating the data in Power BI with the Analitika360 solution.
In brief:
- A Finvalda balance sheet is made up of assets, liabilities and equity, each grouped as non-current or current.
- Ratios such as the current ratio and the debt-to-equity ratio are calculated from balance sheet data and help assess a company’s financial position.
- Vertical and horizontal analysis make it possible to assess structural changes and trends, especially when automated Power BI solutions are used.
- Data errors often arise from incorrect data exports, failing to separate out intermediate accounts, or valuing intangible assets without taking amortisation into account.
Contents
- How Finvalda provides balance sheet data: structure and practical parameters
- Key ratios and how to calculate them from Finvalda data
- Vertical and horizontal balance sheet analysis: steps and a worked interpretation
- Using Finvalda data with Power BI: integration and automated reports
- Step by step: Finvalda balance sheet analysis from export to interpretation
- Common errors, risk indicators and checks before presenting your analysis
- Looking ahead: when to extend balance sheet analysis or ask for additional reports
- What Analitika360 offers: how our Power BI solutions speed up Finvalda balance sheet analysis
- Sources
- FAQ
How Finvalda provides balance sheet data: structure and practical parameters
Finvalda produces the balance sheet according to the standard Lithuanian accounting format: assets, liabilities and equity on separate lines, grouped as non-current or current. The system generates these reports both in the desktop version and through the Finvalda WEB environment, where the balance sheet, the profit and loss statement and the related working tables can be viewed in one place.
Before starting the analysis, it is worth knowing exactly where to look for the data:
- Assets are shown in two groups: non-current (intangible, tangible and financial) and current (inventory, receivables and cash).
- Liabilities are divided into non-current (loans, finance leases) and current (payables, accrued expenses).
- Equity comprises share capital, reserves and retained earnings or accumulated losses.
The PARAMETRAI (Parameters) and APRAŠYMAI (Descriptions) sections of the Finvalda documentation describe how to configure the export fields so that balance sheet lines follow the standard statutory reporting format rather than the internal chart of accounts. This matters because different companies sometimes use different account-coding principles in Finvalda, and without proper mapping an exported table may not match the official balance sheet structure, as noted in the Finvalda WEB user guide.
In practice, preparing the data for analysis involves three steps. First, check the reporting period: Finvalda lets you choose a specific date or a period, and an incorrectly set period distorts the comparison with the previous year. Second, check that the export does not include intermediate accounts, which would double-count amounts. Third, compare total assets with total liabilities plus equity: if the difference is not zero, there is an error in the data that must be corrected before any further calculations.
Pro tip: Before every quarterly analysis, export the balance sheet twice, once with subtotals and once without. Within a few minutes this shows whether Finvalda has grouped the lines correctly.
Key ratios and how to calculate them from Finvalda data
Balance sheet analysis without ratios is just a list of lines. Ratios turn those lines into management decisions, and most of them can be calculated directly from data exported from Finvalda, without any additional systems.
Three ratios should be front of mind for every finance professional:
- Current ratio = current assets / current liabilities. Shows whether the company can cover debts falling due within the next 12 months from its current assets.
- Quick ratio = (current assets – inventory) / current liabilities. A more conservative measure that excludes inventory, which is often the hardest asset to convert into cash quickly.
- Debt-to-equity ratio (D/E) = total liabilities / equity. Shows how far the company’s financing depends on borrowed capital compared with its own funds.
Worked example. Suppose the Finvalda balance sheet shows current assets of €180,000, of which inventory is €60,000, current liabilities of €120,000, and total debt of €250,000 with equity of €200,000. Current ratio = 180,000 / 120,000 = 1.5. Quick ratio = (180,000 – 60,000) / 120,000 = 1.0. D/E ratio = 250,000 / 200,000 = 1.25.
What do these figures mean in practice? A current ratio above 1.0 is generally considered acceptable, but anything below 1.2 deserves closer attention if the company’s sales are seasonal. A quick ratio of exactly 1.0 shows that, without selling inventory, the company can only just cover its short-term debts: not a critical situation, but one to keep an eye on.
When presenting this kind of interpretation to management, it is worth not only quoting the figures but also comparing them with the values for earlier periods. A ratio without context (last quarter, last year) says nothing about the trend, and the trend is often more important than the absolute value.
Vertical and horizontal balance sheet analysis: steps and a worked interpretation
In Lithuanian practice, balance sheet analysis rests on two complementary methods: vertical and horizontal analysis. The two methods answer different questions, and a strong finance professional uses them together, not in isolation.
Vertical analysis shows each balance sheet line as a percentage of total assets (or of total liabilities and equity). The steps are simple:
- Divide each line by total assets and multiply by 100.
- Do the same on the liabilities and equity side.
- Compare the resulting percentages with the structure in previous years or with the industry average, if one is known.
The interpretation often reveals things that the absolute figures do not. If inventory makes up 45% of total assets, that is already a warning sign: possibly excessive stockpiling or slow-moving goods. If current liabilities exceed 60% of total liabilities and equity, this indicates reliance on short-term financing, which is riskier than long-term loans.
Horizontal analysis looks at things from a different angle: how each line has changed over time. The calculation is: (current period amount – previous period amount) / previous period amount × 100. Lithuanian financial analysis practice recommends applying this method over a period of at least three to five years, so that short-term fluctuations can be distinguished from structural changes.
In practice, a significant change is usually taken to be a double-digit percentage jump in a single line within one year, especially if it is out of step with overall sales growth. Before sounding the alarm, it is worth asking yourself a few questions:
- Is the change linked to a seasonal cycle (for example, the December–January inventory spikes in retail businesses)?
- Is it a one-off event (an asset sale, a major investment) rather than a trend?
- If the company has several divisions, does the exported data cover the same group structure in both periods?
When the answer to these questions is no, the change calls for further investigation, not just a mention in the report.
Using Finvalda data with Power BI: integration and automated reports
Manually exporting the balance sheet from Finvalda to Excel every month works as long as the company has one division and one analyst. Once you need to compare several legal entities or track ratios weekly, the manual approach becomes a waste of time and a source of errors.
There are several ways to get data from Finvalda into Power BI:
- CSV export: suitable for one-off analysis, but needs to be refreshed manually every time.
- Finvalda WEB interface: lets you view reports in a browser and export structured data for analysis.
- Automated integration: data is transferred directly, without day-to-day human intervention.
When building a Power BI model, the most important task is to standardise the balance sheet line names. Different Finvalda configurations may use different account numbers for the same economic category, so before modelling you need to create a line map that assigns all these variations to a single standard category. The second key element is the time dimension: balance sheet data must be linked to a specific date so that Power BI can automatically calculate horizontal analysis changes for each new period.
Analitika360 puts this integration into practice: Finvalda data is connected to Power BI, and reports refresh automatically, with no extra action from the user. This means that the liquidity and D/E ratios you calculated by hand in the previous section can update themselves every time a new entry is posted in Finvalda. That means less time spent on data entry and more time for interpretation.
Pro tip: If you work with several legal entities, create a shared line map before running the Power BI model for the first time; it will save you hours when you need to consolidate the balance sheets later.
Step by step: Finvalda balance sheet analysis from export to interpretation
Balance sheet analysis only becomes reliable when the process is repeated the same way every time. Below is a list of steps you can use as a checklist template for every reporting period.
- Set the export parameters in Finvalda. Select the exact reporting period, check that you are not including intermediate accounts, and export the balance sheet in the standard format.
- Run five quality checks. Check: (a) that assets equal liabilities plus equity, (b) that there are no negative values that logically should not exist (for example, negative inventory), (c) that all lines are in the same currency, (d) that the period dates match those of the previous export for comparison, (e) that there are no duplicate entries from repeated exports.
- Calculate the key ratios. Use the formulas described in the previous section: the current and quick ratios and the D/E ratio, as well as turnover ratios (for example, inventory turnover = cost of sales / average inventory).
- Carry out vertical and horizontal analysis. Compare the structure across periods and flag lines whose change is more than double the overall sales growth.
- Prepare a summary for management. Three or four sentences that answer: is liquidity improving or deteriorating, is the level of debt under control, and what has changed significantly over the period.
- Automate the process if the analysis is repeated more often than once a quarter. Power BI integrated with Finvalda lets you monitor ratios in real time rather than recalculating them by hand every month.
Pro tip: Save each period’s export file with the date in its name. When, a few months later, you need to work out why the figures do not match an earlier report, you will have the exact source to check against.
Repeated consistently, this process becomes quicker than the first time within a few cycles: most of the time is spent on the initial export and mapping stage, which, as mentioned, can be automated with a Power BI solution.
Common errors, risk indicators and checks before presenting your analysis
What most often undermines the reliability of balance sheet analysis is not an error in a formula but carelessness in preparing the data. Before presenting a report to management, check the following.
Amortisation and intangible assets are the most common interpretation trap. If a company holds a large proportion of intangible assets (licences, trademarks, software), their carrying amount can differ sharply from their real market value, and this can distort the interpretation of the balance sheet if the analysis is carried out mechanically, without regard to the amortisation method. Similarly, non-current liabilities with variable interest rates need a separate comment, not just a figure on a line.
Checklist before presenting:
- Do total assets exactly match total liabilities plus equity?
- Does the comparison period reflect the same group structure in both years?
- Have you checked for one-off events that distort the results of the horizontal analysis?
- Is the share of intangible assets explained separately if it exceeds 15–20% of total assets?
- Have the liquidity ratios been compared with the values for at least two previous periods?
- Are the ratios assessed together with the profit and loss statement, not in isolation?
The last point is particularly important: balance sheet data alone rarely reveals the full picture of profitability or cash flow problems, so assessing it in isolation is a risky practice.
Looking ahead: when to extend balance sheet analysis or ask for additional reports
A single company’s balance sheet often does not show everything needed to make a decision. When you manage several legal entities or divisions, the standard balance sheet is no longer enough: you need a consolidated report that combines the group’s data without double-counting intra-group transactions.
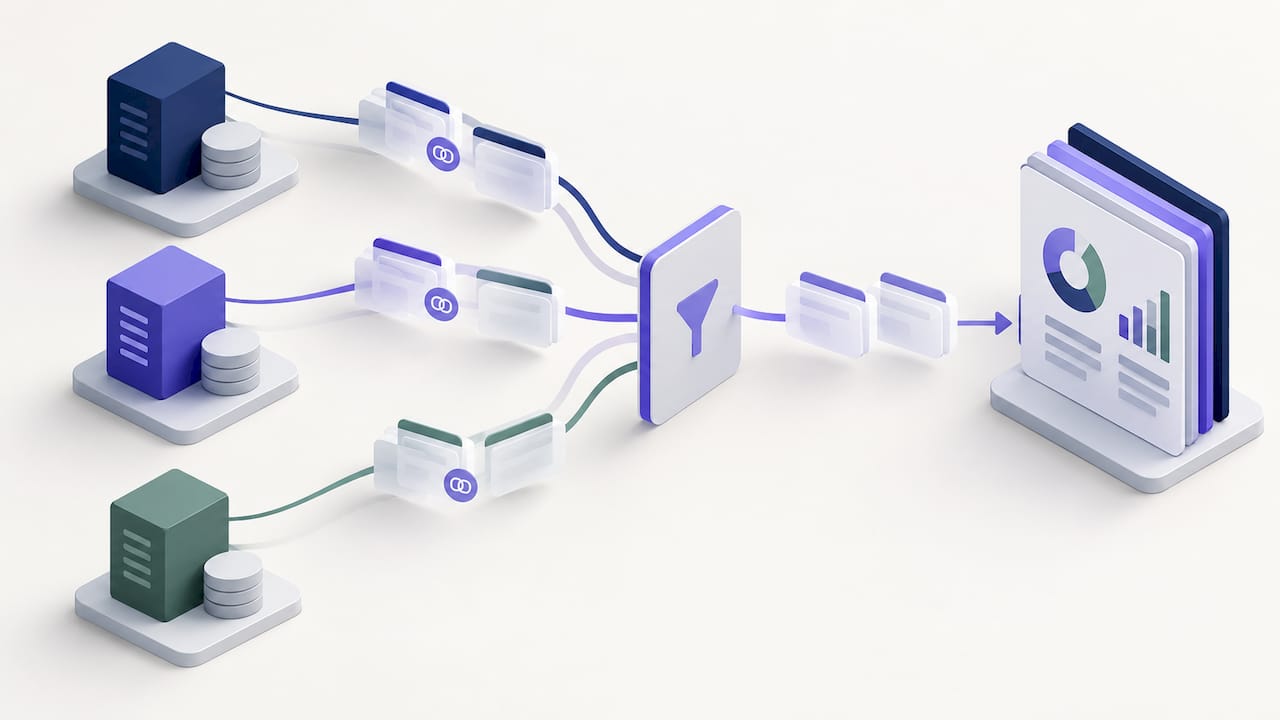
In practice, the additional reports most often requested are revenue segmentation by product or site, and separate reports by division, where a single balance sheet masks differing profitability between locations. This is particularly relevant for restaurant chains and retail businesses, as one site can offset another’s losses in the combined report.
Once analysis reaches this level, manual work in Excel is no longer efficient. At that point it makes sense to see balance sheet analytics with Power BI as the natural next step, not an optional luxury.
— Analitika360
What Analitika360 offers: how our Power BI solutions speed up Finvalda balance sheet analysis
Analitika360 replaces manual balance sheet exports and monthly data entry with an automated Power BI report that refreshes itself, without any recalculation on your part.
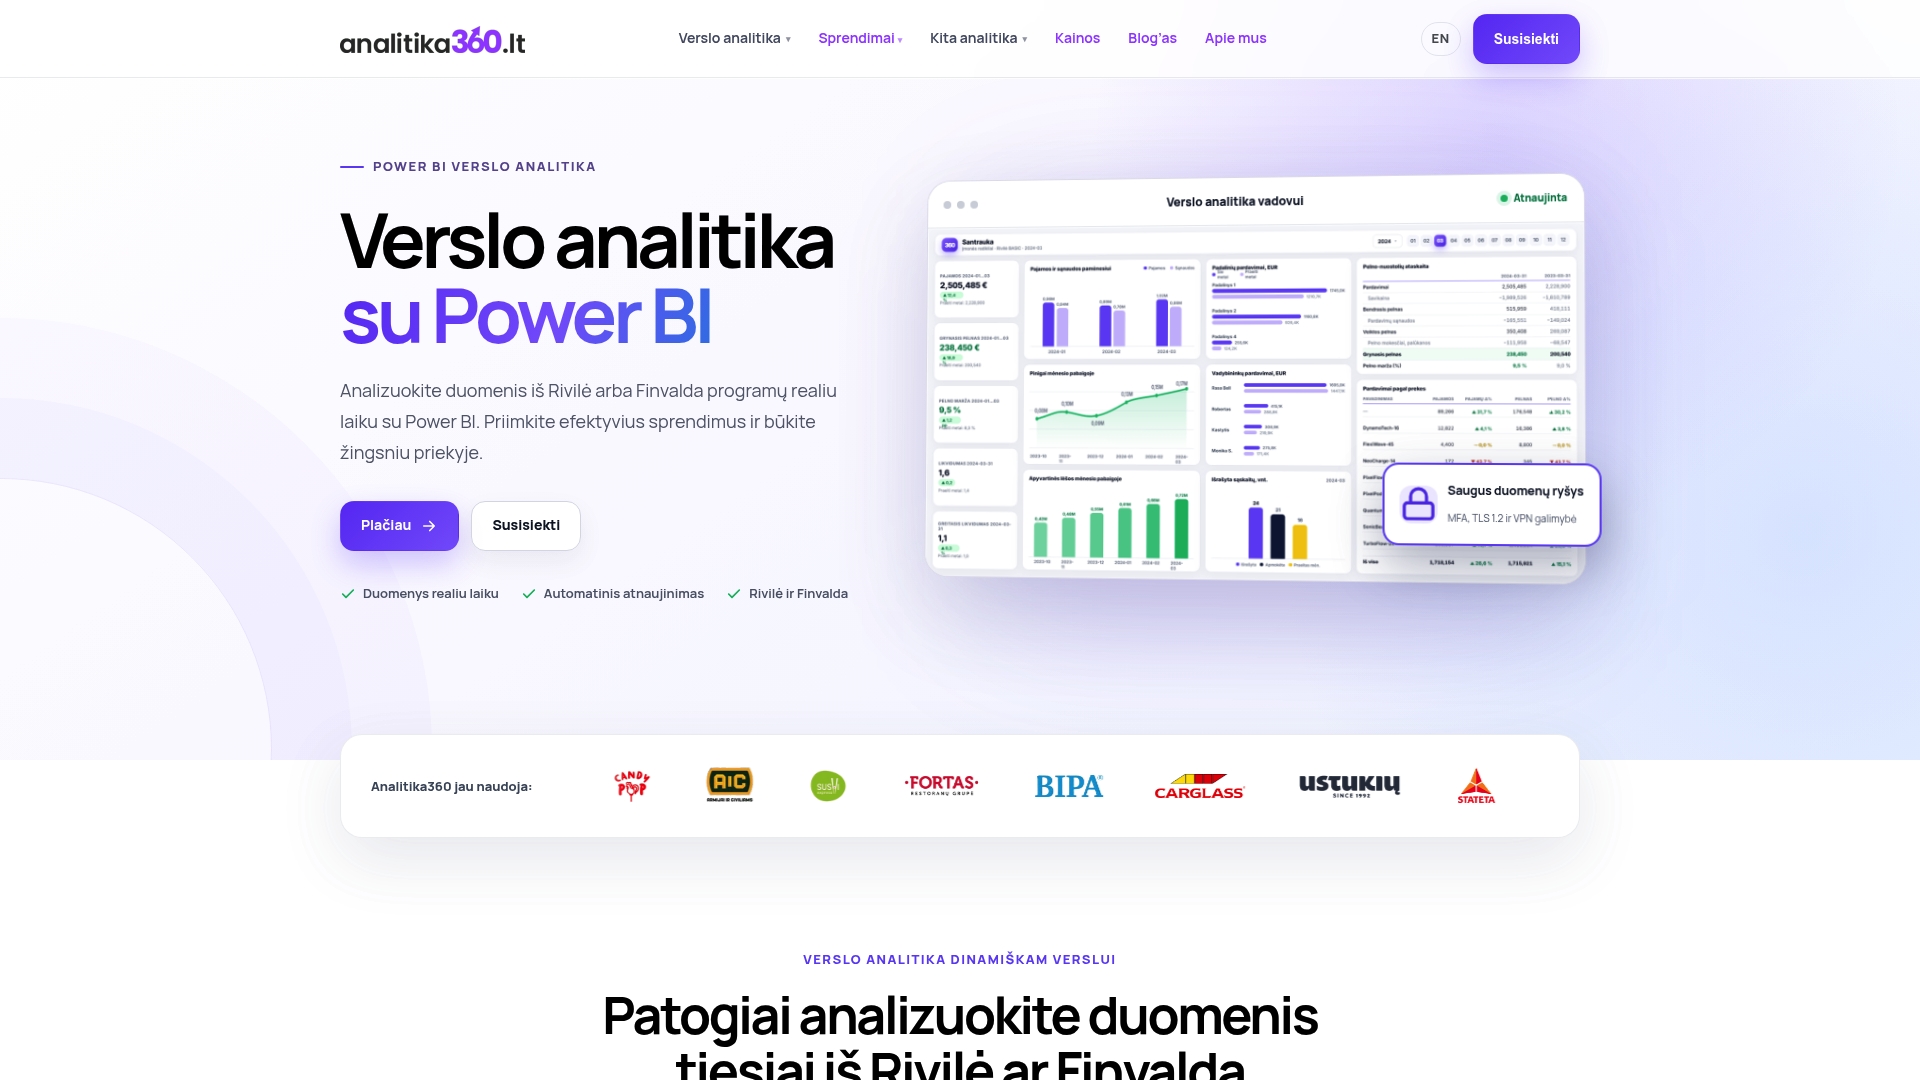
The Finvalda Basic and Finvalda PRO report packages bring analysis of the balance sheet, the profit and loss statement and other financial data together in a single visual environment. The Basic package gives you the core liquidity, leverage and profitability ratios, updated automatically from Finvalda data. The PRO package extends these with operational data tailored to a specific line of business, such as restaurant chains or logistics companies. Transparency here means something simple: at any moment you can open the report and see an accurate balance sheet position updated to today, not figures entered a month ago.
If your company uses Finvalda and you want to move from calculating the balance sheet by hand to automated analysis, take a look at our business analytics solutions by sector and choose the package that fits your company’s structure.
Sources
Before starting balance sheet analysis in Finvalda, it is worth keeping these sources close to hand:
This article is general information, not a substitute for advice from a qualified financial advisor. Consult a qualified financial professional about your own circumstances before acting on anything here.
FAQ
What is Finvalda balance sheet analysis and why is it needed?
It is the application of vertical and horizontal analysis to balance sheet data exported from Finvalda, making it possible to assess liquidity, capital structure and the level of indebtedness for a given period.
How do I calculate the current ratio from a Finvalda balance sheet?
Divide current assets by current liabilities, taking both figures from the balance sheet exported from Finvalda as at the same reporting date.
What is the difference between vertical and horizontal balance sheet analysis?
Vertical analysis shows each line as a percentage of the total at a single point in time, whereas horizontal analysis compares how the same line changes over several periods.
Can Finvalda balance sheet analysis be automated with Power BI?
Yes. Analitika360 connects Finvalda data to Power BI, and reports, including balance sheet ratios, refresh automatically without manual data entry.
What are the most common mistakes when analysing a Finvalda balance sheet?
The most common are choosing the wrong export period, failing to separate out intermediate accounts, and interpreting the value of intangible assets without taking amortisation into account.