See more. Decide better.
 Late payments: who owes you money and how many days overdue

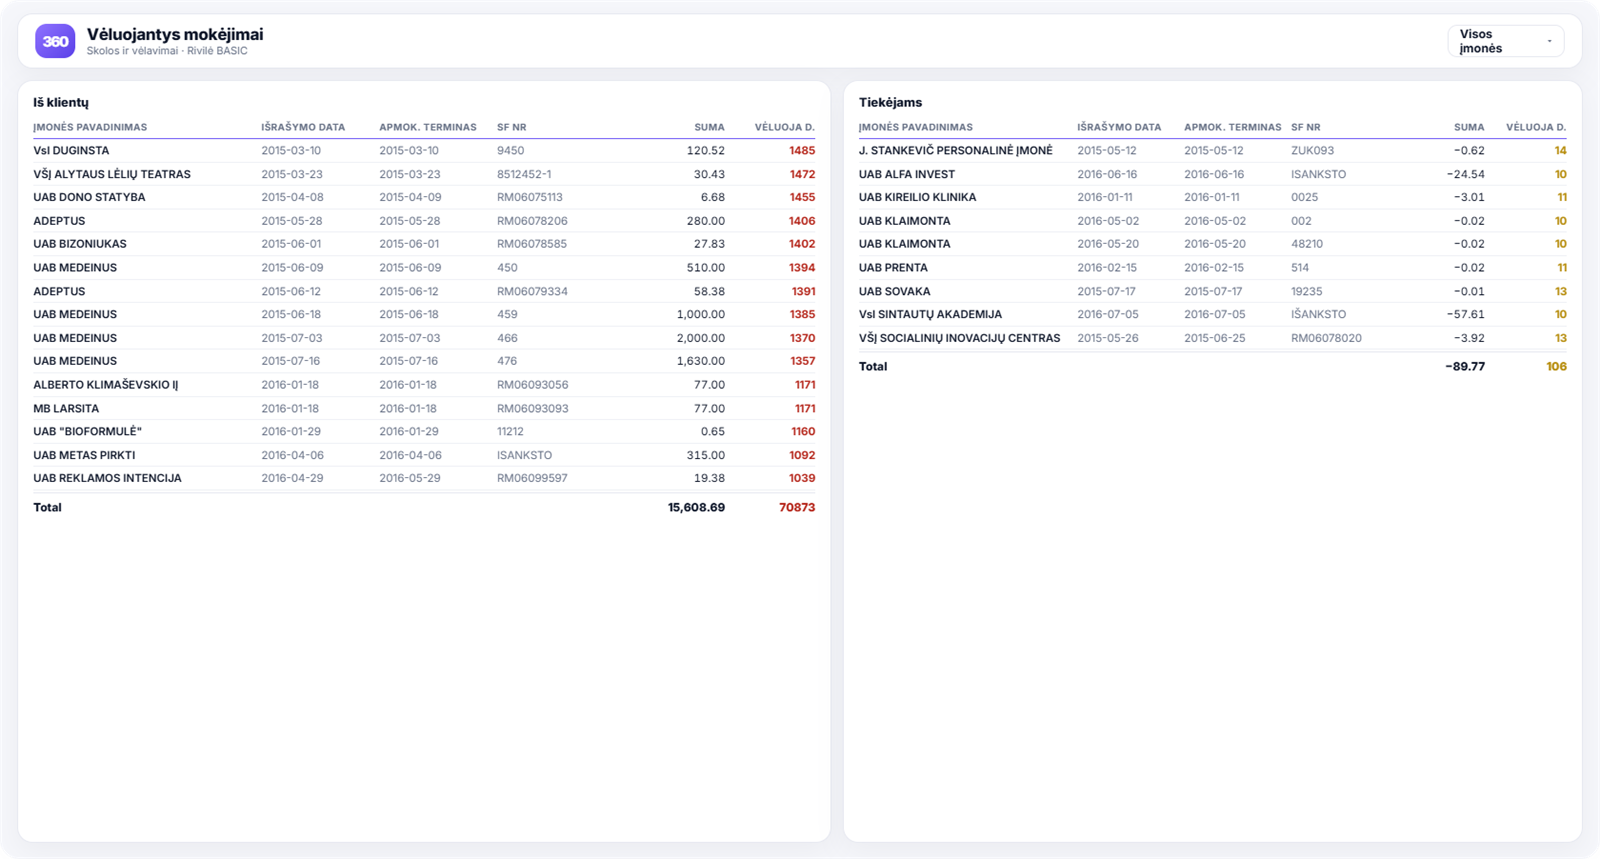
Cash flow usually stalls not because sales are lacking, but because issued invoices are not paid on time. This report shows, in one place, late payments from your customers and your own late payments to suppliers.
What decisions it helps you make
- Who to call today. The list is sorted by days overdue and amount, so it is clear where to start.
- When to stop offering credit terms. A customer who pays late as a matter of habit stands out straight away, not once the debt has become a problem.
- How to plan cash flow. Seeing both sides — how much you will receive and how much you have to pay — makes it easier to plan the week.
- Whether collection is working. The average number of days overdue over time shows whether the process is improving.
What you see in the report
- a list of overdue customer invoices: company, invoice number, date, due date, amount;
- days overdue for each invoice;
- overdue payments to suppliers;
- sorting by invoice date, due date or amount;
- total overdue amounts.
How to read this report
Start by looking not at the largest amount, but at the combination of amount and days overdue. A large amount that is 10 days late is often just a technicality. A mid-sized amount that is 300 days late is already a candidate for bad debt.
For deeper analysis by ageing bucket (up to 30, 31–60, 61–90, over 90 days), see the receivables analysis report.
Why speed matters more than firmness
In debt collection, timing counts for more than tone. An invoice chased on the seventh day overdue is paid far more often than one followed up with a phone call two months later.
The reason is simple: while the delay is fresh, it is usually a matter of forgetfulness or a lost document — a problem the customer sorts out within a day. After two months, it has become a question of the customer’s own cash flow, and you are queuing up alongside their other suppliers.
That is why the practical value of this report lies not in a monthly review but in a weekly one. Five minutes on a Monday morning achieves more than a quarterly debt analysis.
A simple weekly process
What works at most companies:
- On Monday, review the list sorted by days overdue.
- Up to 14 days — a friendly reminder by email; this is usually enough.
- 15–45 days — a phone call, not an email. Find out the reason.
- Over 45 days — stop offering new credit terms until the matter is resolved.
The fourth step is the one most often skipped, and it is precisely the one that costs the most: a customer who keeps being sold to on credit terms only grows their debt.
And the other side — your payments to suppliers
The report also shows your own late payments. This is not just a matter of reputation: suppliers you pay on time are more likely to agree to discounts and better terms.
With both sides in view together, you can plan cash flow a week ahead: how much you will actually receive and how much you are obliged to pay. For the overall picture of how much cash is tied up in receivables, see receivables analysis.
How to get this report
The late payments report is included in the ready-built Rivilė and Finvalda packages. You can see what it looks like in the report examples.