See more. Decide better.
 Business analytics summary: the manager's report on a single screen

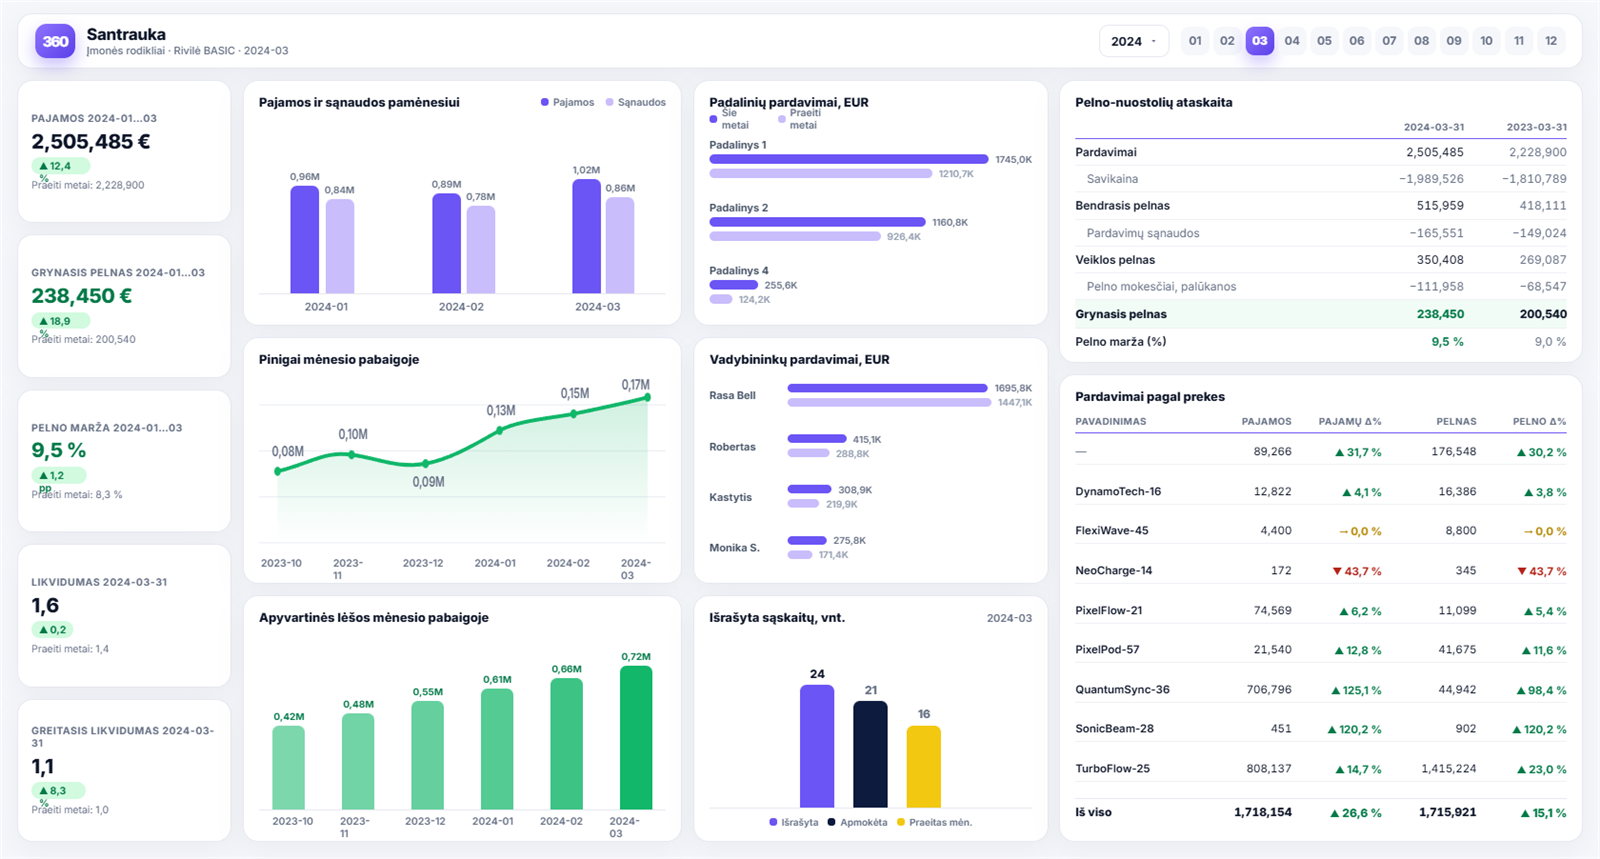
A manager rarely needs ten reports. What they need is one that shows the whole picture in half a minute. That is exactly what the summary report does: it brings revenue, costs, profit, margin and liquidity ratios together on a single screen, alongside a comparison with the previous year.
The decisions it helps you make
- Is everything going to plan? A single glance tells you whether you need to dig deeper or not.
- Where to look first. Every figure is a gateway to a more detailed report.
- How the company stands today. The current ratio and quick ratio show its ability to meet its obligations.
- What to show the owners or the board. One screen with comparisons often replaces an entire presentation.
What you see in the report
- revenue and its change against the previous period;
- net profit (amount and percentage);
- profit margin;
- current ratio and quick ratio;
- month-by-month trends in revenue and costs;
- sales by department and by sales manager;
- a profit and loss summary and sales by product.
Who benefits most from this report
First and foremost, managers and financial analysts who need to assess the company’s financial position quickly and keep track of trends and comparisons with earlier periods.
In practice, this is the report people open most often: the week starts here, and when more detail is needed, they move on to the revenue, costs or sales reports.
How to read it in half a minute
The summary works when reviewing it is a routine rather than a search. In practice, four steps are enough, always in the same order:
- Profit margin, not the amount. The amount grows with turnover; the margin shows whether the business is becoming more efficient.
- Comparison with last year: are we moving forward, or just going round in circles?
- Liquidity: will there be enough cash for the obligations coming up?
- Departments: is everyone contributing, or is one department’s result masking another’s problems?
If all four look in order, you can close the report. That is precisely the point of the summary: not to show everything, but to let you decide quickly that there is no need to dig deeper.
Where to start digging
Every figure in the summary is a door into a more detailed report, and the route is almost always the same:
- margin has fallen → profit analysis and product profitability;
- costs have risen → cost analytics and the variance report;
- liquidity is deteriorating → debts and slow-moving stock;
- departments diverge → sales analysis.
The whole journey from a headline figure down to a specific invoice takes a few seconds, because the reports are built on the same data model.
Why one screen often replaces a meeting
Much of the time in management meetings goes on reconciling whose figures are right. When everyone is looking at the same screen, refreshed automatically this morning, that stage disappears.
The second benefit is a practical one: the summary works on a phone. For a manager who is not sitting at a computer, this is often the only way to see the figures every week rather than every quarter. We have written separately about the five figures worth reviewing at that pace.
How to get this report
The summary is the first page in every ready-built package, for both Rivilė and Finvalda users. There is also the separate CockpitCEO solution, designed specifically for managers.