
Reporting without the manual work: Rivilė, Finvalda and Power BI packages

Yes, Power BI can analyse Rivilė and Finvalda data automatically. With a ready-made Power BI report package, managers get real-time financial indicators, drill-down detail and reports that refresh themselves, with no extra work. In the Lithuanian market these solutions are implemented by local providers, Analitika360 among them, who adapt standard packages to each company’s specific accounting structure.
In brief:
- A single-user Power BI licence costs around €10 a month, while full implementation services usually start from €300 a month.
- Once Power BI is integrated with Rivilė and Finvalda, data refreshes automatically within a few hours, cutting down the need for manual work.
- A data inventory is carried out in the first week, while a full company-wide rollout often takes 2–3 months, depending on how clean the data is.
- Security measures include MFA, TLS encryption and role-based permissions, so that data cannot be intercepted and is properly controlled for every user.
- Ready-made packages usually suit standard company accounting, while a bespoke solution is needed for more complex or unusual business models to get the full picture.
Contents
- What a Power BI solution for Rivilė and Finvalda includes
- Which reports are included in the Basic and PRO packages
- How to connect Power BI to Rivilė and Finvalda technically
- How much a Power BI implementation with Rivilė or Finvalda data costs
- How to protect data when integrating Rivilė and Finvalda with Power BI
- How long implementation takes and when you will see the first benefits
- When to choose a ready-made package and when a bespoke solution
- How to get started with Power BI on Rivilė or Finvalda data
- Sources
What a Power BI solution for Rivilė and Finvalda includes
Integrating Power BI with Rivilė and Finvalda changes how a manager works: instead of waiting for the accounts team to prepare a report, the figures are on screen whenever they are needed. The solution combines accounting data with business logic and turns it into clear charts and tables.
The core elements a company receives when implementing such a solution and using currency market analysis are particularly important for managing income and expense reporting.
- revenue, cost and profitability indicators broken down by department, product or period;
- automatic data refresh, with new entries from Rivilė or Finvalda reaching the report within a few hours without anyone stepping in;
- drill-down functionality that lets you go from the overall profit figure down to a specific account or stock item;
- the option to add data from Excel, CRM systems or SharePoint to the accounting data, so that the report covers the whole business picture, not just the finances.
Primend notes that once Power BI brings together data from several systems, managers make decisions faster, and ETL processes that previously required manual work become automatic.
Expert tip: Before ordering a package, write down the three questions management asks most often in meetings. If the report cannot answer them within two clicks, the package needs to be customised.
Which reports are included in the Basic and PRO packages
The packages on the market differ in scope, not in principle. Rivilė describes a set of up to 19 reports with dynamic filtering and automatic refresh, while smaller packages are limited to the key financial indicators.
A typical report structure looks like this:
- Management overview – a summary dashboard showing revenue, costs and profit at a glance.
- Profit and loss comparison – analysis by period and department, with variances highlighted.
- Balance sheet – movements in assets, liabilities and equity.
- Stock levels – inventory turnover and the value of unsold stock.
- Debt reports – receivables and payables with due dates flagged.
The packages differ in scope: the smaller set covers around ten reports with the key indicators, while the broader set includes more reports with more detailed segmentation. For restaurant chains, stock and margin analytics are often the priority; for manufacturers, the structure of unit costs; for leasing companies, portfolio and debt analysis.
How to connect Power BI to Rivilė and Finvalda technically
The technical integration depends on how much automation the company wants from the outset. There are three main routes.
- Direct export or CSV catalogues – the simplest method, suitable for small companies for whom daily or weekly refreshes are enough.
- API connections – allow data to be retrieved more often and more precisely, but require technical set-up with the system administrator.
- Intermediate data stores (Azure, SharePoint) – used when data from several sources has to be standardised before being loaded into the Power BI model.
The Rivile Cloud documentation describes how to prepare analytics solutions before connecting them to Power BI, and a bank data connection, such as SEB Baltic Gateway, can also serve as an additional source.
The most common mistake: the data model is built without clear relationships between tables, so DAX formulas calculate incorrectly when a user filters by department or period. The solution is to design a star schema from day one rather than copying the accounting table structure straight into Power BI.
How much a Power BI implementation with Rivilė or Finvalda data costs
Pricing is made up of three components, and it is worth costing them separately, as providers often roll them into a single figure.
- Monthly service subscription – covers package support, updates and consultations.
- One-off configuration – preparing the data model, setting up the connections and building the first reports.
- Power BI licence – Microsoft charges a separate fee for each user.
Finvalda states that a Power BI licence costs around €10 or more a month per user, while a service package with support and consultations starts from €300 or more a month. Interestingly, the first three months of consultations on the structure of the bookkeeping are often provided free of charge, which lets the company get its data ready before the full rollout.
How to protect data when integrating Rivilė and Finvalda with Power BI
Financial data is a company’s most sensitive information, so security should never be an afterthought. Power BI Service allows access to be controlled through a multi-level system.
- Two-factor authentication (MFA) – mandatory for anyone connecting to reports remotely.
- TLS encryption – ensures that data cannot be intercepted in transit between Rivilė, Finvalda and the Power BI server.
- VPN access – recommended when the data is accessed from the company’s internal network while working remotely.
- Role-based permissions – the manager sees everything, a department head sees only their own department’s figures, and the accountant sees only the accounting module.
Expert tip: If you are building a report that more than one person from different departments will see, apply data masking rules to salary or customer contact fields at model level, not at visualisation level.
How long implementation takes and when you will see the first benefits
How long implementation takes depends more on how tidy the data in Rivilė or Finvalda is than on the complexity of Power BI.
- Data inventory (1 week) – checking which fields and catalogues are in use and where there are inconsistencies.
- Pilot implementation (2–4 weeks) – the first reports are built for one department or one area of the business.
- Full company-wide rollout (2–3 months) – reports are extended to all departments and additional data sources are added.
- Support and adjustments – an ongoing stage in which reports are refined based on management feedback.
The first financial benefits usually show by the end of the pilot stage: the accountant’s or analyst’s hours previously spent preparing reports by hand become a clear figure that can be set against the monthly subscription.
When to choose a ready-made package and when a bespoke solution
A ready-made package covers most needs when the company’s accounts are kept in a standard way and the manager needs only the classic indicators: profit, costs and stock levels. Restaurant chains and accounting firms working with several clients often stick with this kind of solution and within a few weeks get a full picture that used to take days of manual work.
A bespoke solution pays off when the business model is unusual, for example when a leasing company needs portfolio risk analysis, or when data comes from three or more different systems at once. In that case the standard package does only part of the job, and the rest has to be designed from scratch.
Do not choose a package on price if it does not reflect how often you actually use your reports. A company that needs daily stock monitoring loses more by saving on the licence than it would by investing in a broader package from the start.
— Analitika360
How to get started with Power BI on Rivilė or Finvalda data
Ready-made Basic and PRO Power BI packages are available for both Rivilė and Finvalda users, with no need to negotiate each report separately. Unlike general IT consultancy, you get a report structure that has already been built and only needs to be adapted to your data, so the first results arrive within weeks, not months.
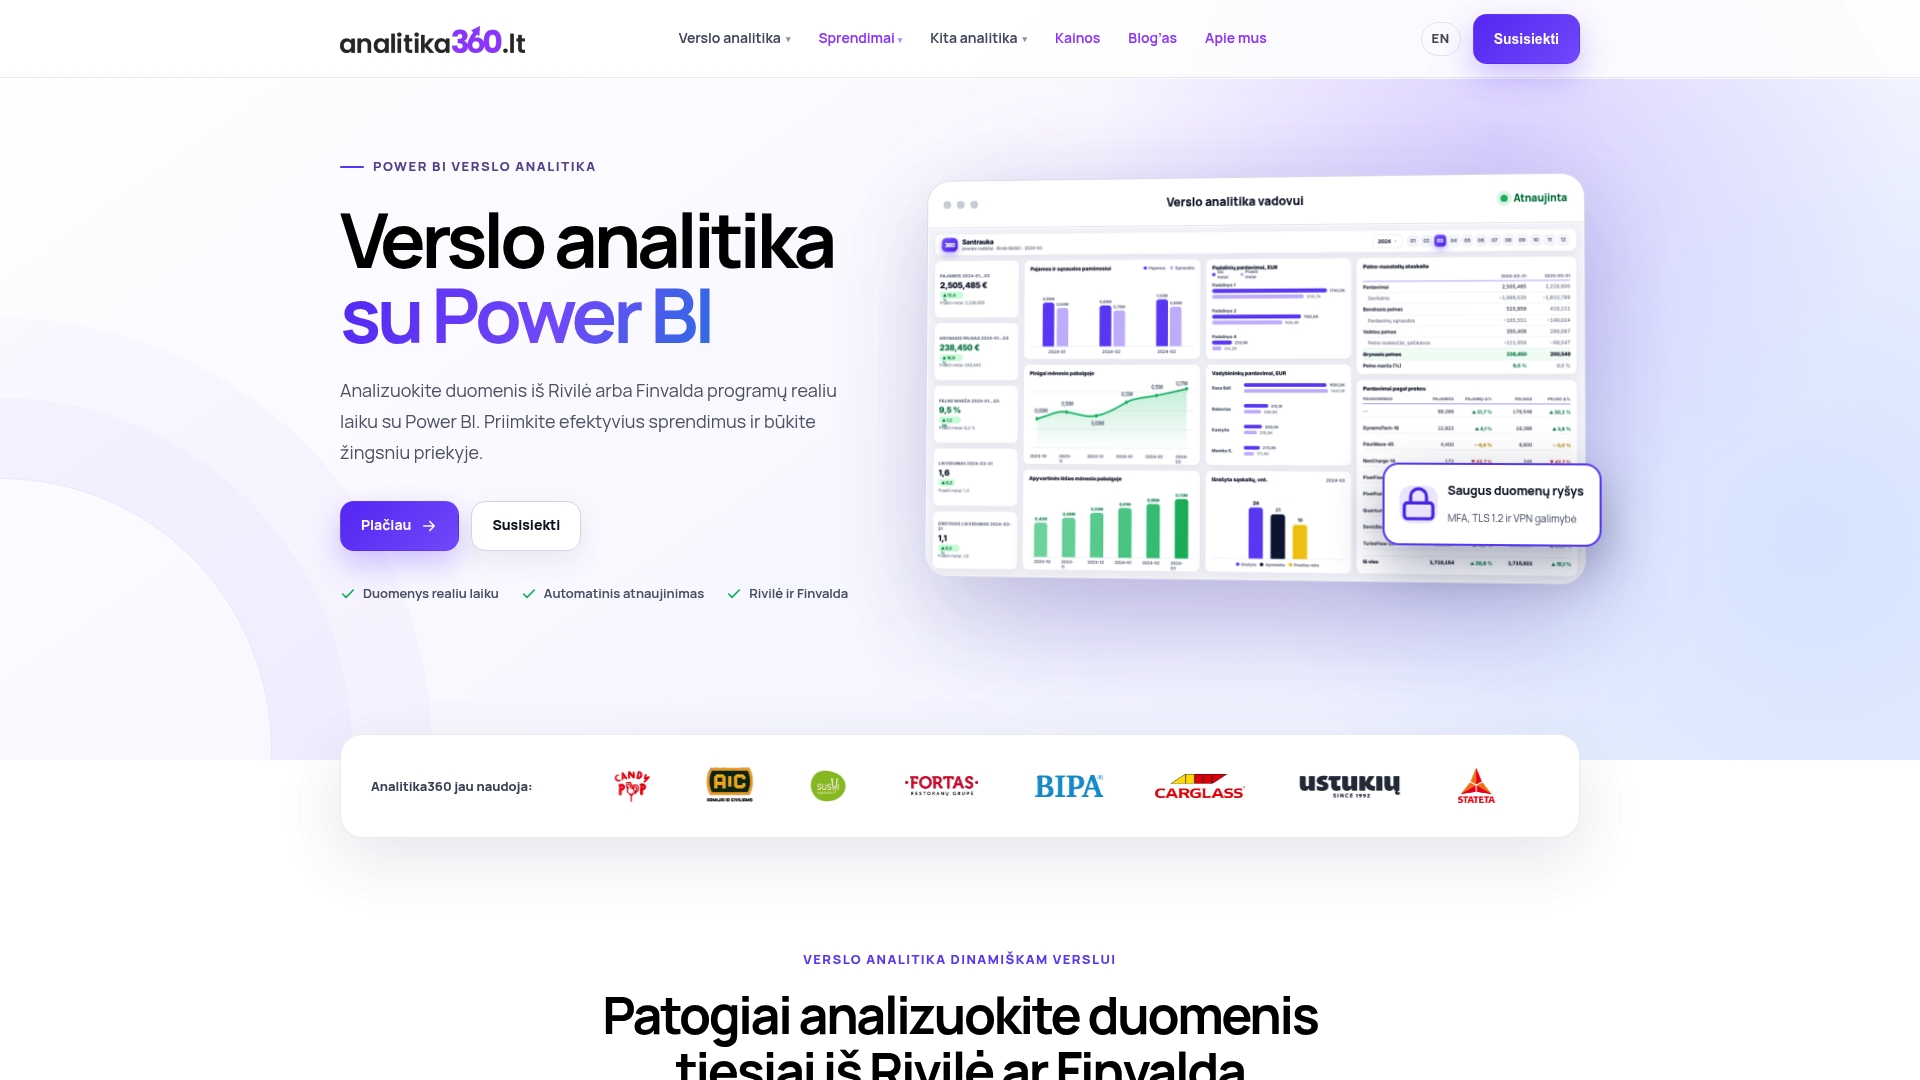
The first step is a short data check to assess whether the data in Rivilė or Finvalda can be transferred directly or needs further cleaning. This is followed by a demonstration using real or similar data, in which management sees what the final report will look like. Browse our business analytics solutions by sector and choose the package that matches your company’s size and industry, or get in touch directly for a tailored quote.
Sources
- Integration with Microsoft Power BI | Finvalda
- Business performance analytics with Power BI | Rivilė
- Data-driven management: how Power BI helps you make better decisions | Primend