Your business in 360°
Horizontal Analysis in Power BI: Tracking Changes Without Manual Work

Horizontal analysis shows how much, and in which direction, revenue, expenses, profit or balance sheet items have changed between two or more periods. Power BI turns this analysis into an ongoing process: DAX measures built once calculate the absolute and percentage change every month on their own, and the report refreshes without a new Excel spreadsheet. For Rivilė and Finvalda users, the quickest route is a ready-made report package that is already connected to the accounting data. Analitika360 offers exactly that kind of Power BI package, with reports that refresh automatically. Below you will find the method, the formulas, the steps and tips on reading the changes correctly.
In brief
- Horizontal analysis compares the same financial statement items across different periods and expresses the change in euros and as a percentage.
- If the base figure is zero or negative, no percentage change is calculated; only the absolute difference is shown.
- In Power BI you need three things: clean accounting data, a date table and a few DAX measures.
- Most of the time goes not on the formulas but on preparing and refreshing the data, so it is worth automating.
- Ready-made Analitika360 packages for Rivilė and Finvalda users start at €59 a month.
Contents
- What horizontal analysis is
- Why it goes stale quickly in Excel spreadsheets
- How to build horizontal analysis in Power BI: 5 steps
- How to read changes in revenue, expenses and profit
- Ready-made Power BI packages for Rivilė and Finvalda users
- Our view
- FAQ
- Sources
What horizontal analysis is
The Visuotinė lietuvių enciklopedija (VLE), Lithuania’s universal encyclopaedia, defines horizontal analysis as a comparison of financial statement data for two or more years, used to establish how figures have changed in absolute terms and in percentages, i.e. their deviations from the base figures. The same encyclopaedia stresses an important rule: when the base figure is zero or negative, the percentage deviation is not calculated.
In practice, two values are calculated:
- Absolute change = current period value − base period value.
- Percentage change = absolute change ÷ base period value × 100%.
When more than two years are compared, base-year analysis is often used: each period’s figures are expressed as a percentage of the base year, with the base year set at 100%. This so-called trend analysis lets you see at a glance whether revenue is growing faster than expenses.
The Lithuanian public sector applies the method on the same principle. In an example from the Ministry of Finance training material Preparing and Analysing Financial Statements, revenue from principal activities rose by 55.48%, while expenses rose by 57.93%. Those two figures alone tell you that expenses grew faster than revenue and the margin was shrinking.
Illustrative example
Below is an illustrative extract from a profit and loss statement, as you would see it in a Power BI matrix:
| Item | 2025 | 2026 | Change, € | Change, % |
|---|---|---|---|---|
| Sales revenue | 480,000 | 552,000 | 72,000 | 15.0 |
| Cost of sales | 300,000 | 357,000 | 57,000 | 19.0 |
| Gross profit | 180,000 | 195,000 | 15,000 | 8.3 |
| Operating expenses | 120,000 | 126,000 | 6,000 | 5.0 |
| Operating profit | 60,000 | 69,000 | 9,000 | 15.0 |
| Result of other activities | −4,000 | 2,000 | 6,000 | – |
In the last row the base figure is negative, so no percentage change is shown. This is the same rule that needs to be written directly into the formula of the Power BI measure.
Why it goes stale quickly in Excel spreadsheets
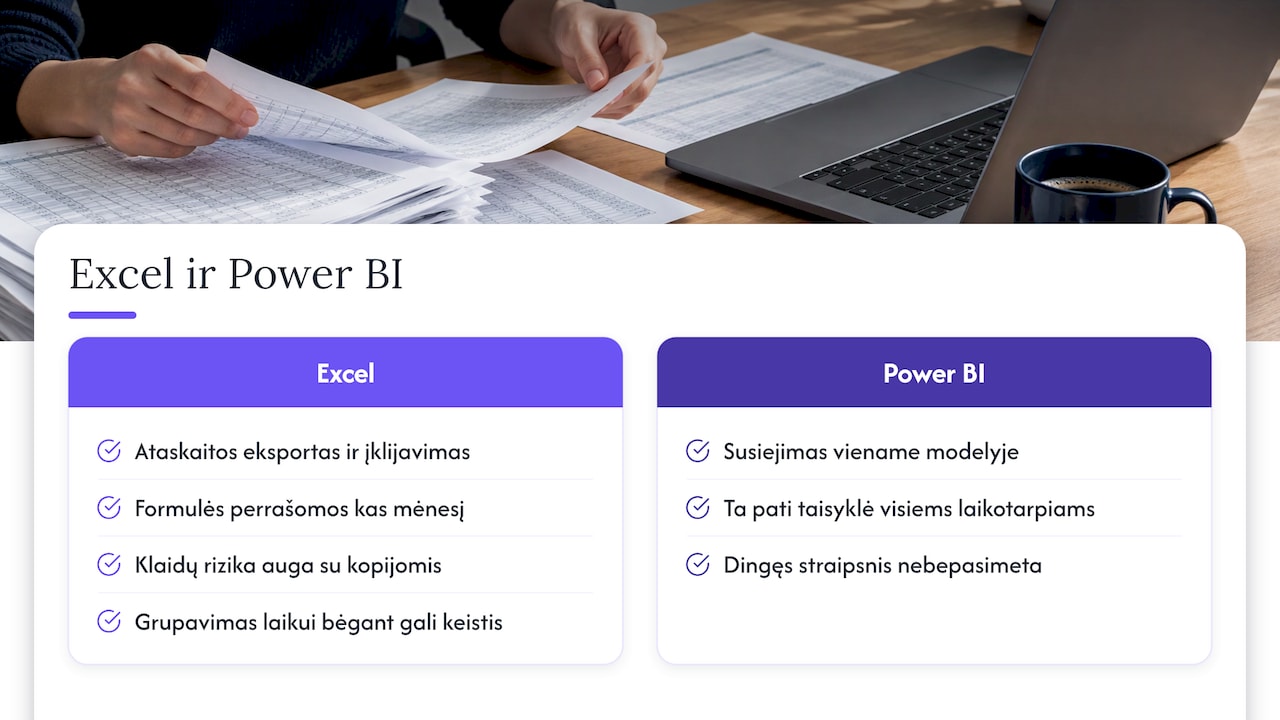
In an Excel file, horizontal analysis is usually done by hand: a report is exported from Rivilė or Finvalda, pasted next to the previous period and the formulas are rewritten. The work is repeated every month, and the risk of errors grows with every copy.
The second problem is comparability. Investopedia points out that the grouping of financial statement items can change over time, so revenue, expenses or assets move between accounts and create false differences. When the mapping of the chart of accounts to report lines is held in a single Power BI model, the same rule is applied to all periods at once and a ‘missing’ item no longer gets lost.
To find out which accounting reports are worth moving to Power BI, see our article on accounting reports in Power BI.
How to build horizontal analysis in Power BI: 5 steps
1. Connect the accounting data
The foundation is general ledger or report data with a date, an account and an amount. The most common mistake: a new Excel file with different column names is imported every month, and the model breaks.
Analitika360 takes this step off your hands: the packages are designed for data from Rivilė and Finvalda, and where needed SharePoint, Excel, CRM or logistics sources are brought into the same Power BI model. We explain how to combine accounting and Excel data in our guide Rivilė, Excel and Power BI.
2. Create a date table and periods
Time comparisons need a separate, continuous date table with years, quarters and months, linked to the fact table. Decide in advance what you are comparing: a month against the previous month, a month against the same month last year, or year to date against the same period last year. For a restaurant chain, comparison with the same month last year often matters more, because seasonality distorts the month-on-month change.
What to watch out for: an incomplete current month. If November has not yet ended, comparing it with the whole of October will show a false decline.
3. Write the DAX measures
SQLServerCentral provides the classic month-on-month template: the previous month’s value with PREVIOUSMONTH, the difference by subtraction and percentage growth with DIVIDE. Adapted to financial data, the measures look like this:
Pajamos = SUM(Apskaita[Suma])

Pajamos PM = CALCULATE([Pajamos], PREVIOUSMONTH('Data'[Data]))

Pokytis Eur = [Pajamos] - [Pajamos PM]

Pokytis % =
IF([Pajamos PM] > 0, DIVIDE([Pokytis Eur], [Pajamos PM]))
The last measure implements the encyclopaedia’s rule: when the base figure is zero or negative, the percentage is left blank. For a year-on-year comparison the logic is the same; only the time function in the previous-period measure changes.
Signs are a common pitfall. In accounting, revenue is often stored with a minus sign (credit) and expenses with a plus sign. Align the signs in the model before calculating the change, otherwise revenue growth will look like a decline.
4. Choose the visuals and filters
The best fit for horizontal analysis:
- A matrix with report lines, two periods, and the change in euros and percentages, as in the table above.
- Conditional formatting: green for favourable changes, red for unfavourable ones. For expenses the logic is reversed, so set the rule according to the item type.
- A line chart for a multi-year trend with a base-year index.
- Filters by department, site, project or restaurant, so that the cause of a change can be traced down to a specific unit.
If you are comparing not only periods but also budget against actuals, see our guide on budget comparison in Power BI.
5. Ensure data quality and refresh
The analysis is only as good as its data. Each month, check that the profit figure in Power BI matches the report in the accounting system, that no unmapped new accounts have appeared and that no closed period has been adjusted.
This is where Analitika360 packages save the most time: reports refresh automatically, with no extra work for the user, and revenue, expense, profit and balance sheet figures are visible in real time. The solution also ensures data security.
How to read changes in revenue, expenses and profit
Numbers without context can mislead. A few principles experienced financial analysts follow:
- Compare the rate of change. If expenses grow faster than revenue, as in the Ministry of Finance example, the margin shrinks even as turnover rises.
- Look at the structural items. In another part of the Ministry of Finance training material, salary and social insurance expenses fell by 11.79%, while business travel expenses rose by 34.83%. A large percentage on a small item can mean less than a modest change in a large one, so always show the euros as well.
- Look for the causes. VLE notes that horizontal analysis on its own shows general trends of change, while their causes require more in-depth analysis. Power BI addresses this with drill-down: from the profit line to the account, department or customer.
- Read it alongside the balance sheet. Profit growth combined with rapidly growing receivables shows that the cash is not yet coming in. For more on this, see our guides on Rivilė balance sheet analysis and the Finvalda profit and loss statement.
Ready-made Power BI packages for Rivilė and Finvalda users
If you would rather not build the model from scratch, Analitika360 offers ready-made Power BI report packages in which revenue, expense, profit, balance sheet, sales, inventory and debt figures refresh automatically.
| Package | Price |
|---|---|
| Rivilė Basic | €59 a month |
| Rivilė PRO | €89 a month |
| Finvalda Basic | €59 a month |
| Finvalda PRO | €89 a month |
| Custom projects | €70 an hour |
Separate reports are prepared for specific sectors such as restaurants, logistics or construction, and Microsoft Pro and Premium licences are also available. You will find all the plans on our business analytics pricing page.
Our view
Horizontal analysis is one of the simplest and most useful methods of financial analysis, but its value only comes through when it is done regularly. An analysis carried out once a year in an Excel file shows the past. A Power BI report that refreshes automatically every month lets you react while a change is still small.
That is why we build ready-made report packages for Rivilė and Finvalda users: the manager or accountant gets comparisons with no extra work, and different sources are combined into a single Power BI model. Where a company’s processes or IT systems are unusual, we tailor the solution individually.
Our aim is simple: for the finance team to spend its time on decisions, not on copying data.
Analitika360
FAQ
How does horizontal analysis differ from vertical analysis?
Horizontal analysis compares the same item across different periods. Vertical analysis shows each item’s share within a single period, for example cost of sales as a share of revenue. In Power BI both analyses can be shown in the same matrix.

Can horizontal analysis be done by quarter or by month?
Yes. The method works for any period, provided the periods being compared are of equal length and complete. With a date table in Power BI, you can filter the same measure by year, quarter or month.
What should I do if the previous period’s figure was negative?
In that case, do not calculate a percentage change; show only the absolute change in euros. In the DAX measure this is handled by a condition that calculates the percentage only when the base figure is positive.
How long does it take to prepare a report like this?
If you build the model yourself, most of the time goes on connecting the data, mapping the accounts and checking. Rivilė and Finvalda users can choose a ready-made Analitika360 package, while individual requirements are handled as a project at €70 an hour.
Sources
- Visuotinė lietuvių enciklopedija: financial analysis
- Ministry of Finance: Preparing and Analysing Financial Statements (Part I)
- Ministry of Finance: Preparing and Analysing Financial Statements
- Investopedia: Horizontal Analysis
- SQLServerCentral: Month-over-Month calculation using DAX in Power BI