See more. Decide better.
 Customer analysis: who is buying, who has gone quiet and who pays late

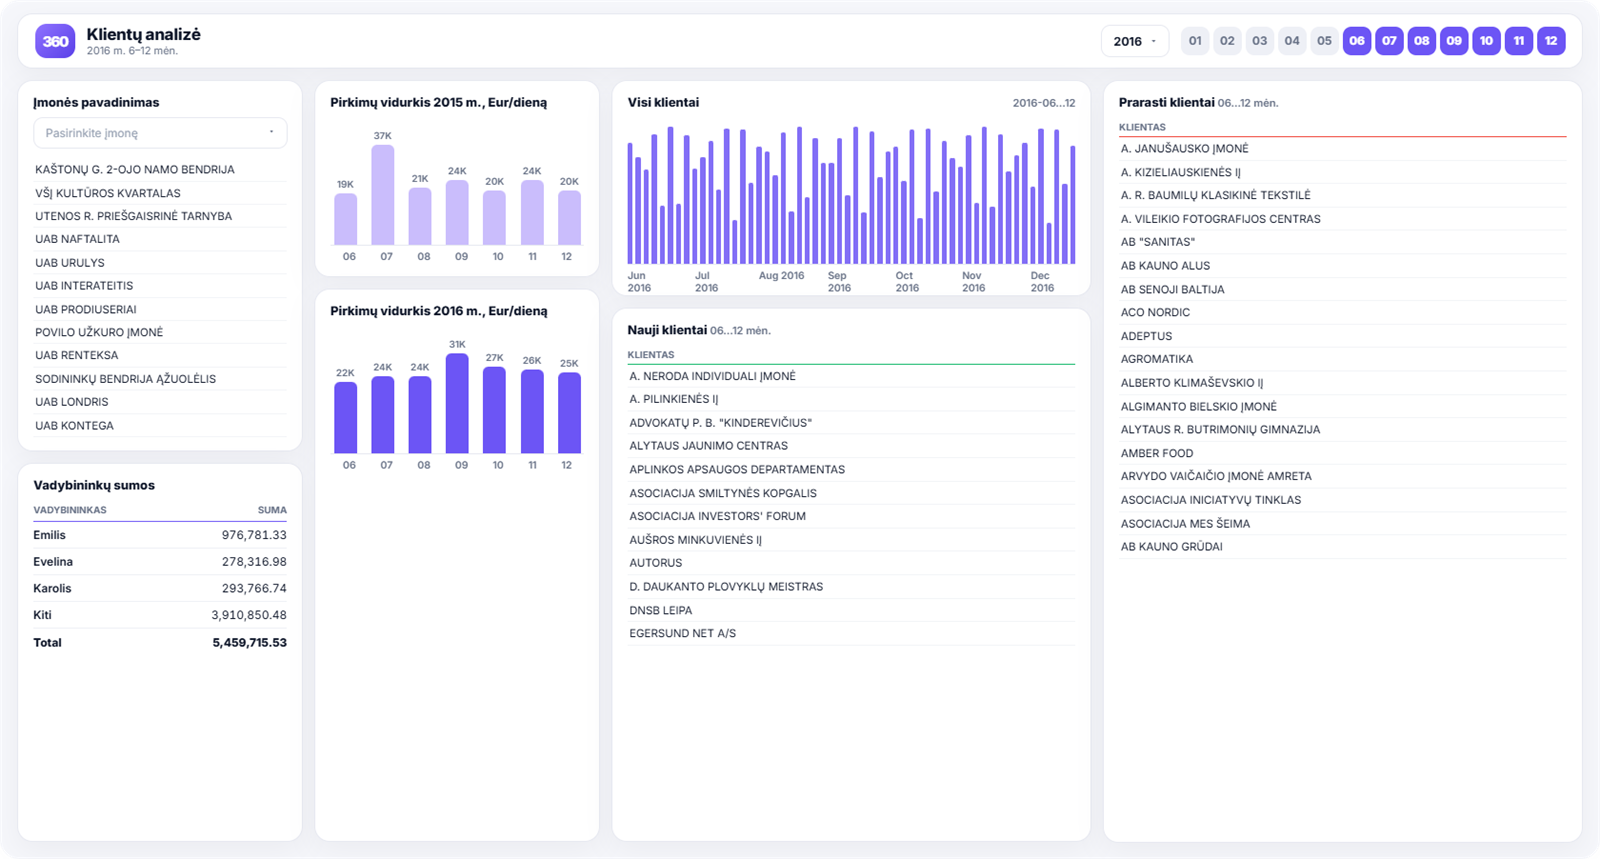
Every company has a customer list. Far fewer have answers to the questions that matter: which customers are growing, which have quietly disappeared and which consistently pay late. That is exactly what the customer analysis report shows.
The decisions it helps you make
- Where to focus your account managers’ time. You can see which customers buy the most and whose purchases are growing.
- Which customers to win back. The lost customers list shows those who used to buy but no longer do — something companies often find out too late.
- Whom to restrict on payment terms. A customer who pays late as a matter of habit is a credit risk, even if their turnover is high.
- Whether your customer base is growing. The number of new customers over a period reflects how well the sales team is performing.
What the report shows
- sales by individual customer for a chosen period;
- a list of new customers;
- a list of lost customers;
- average purchases (for example, € per day) and how they change;
- sales totals by account manager;
- each customer’s sales trend over time.
How to read this report
Start with the lost customers — it is the only list that is, in itself, a task for the sales team. Next, compare each customer’s turnover with their payment discipline: your largest customer paying 60 days late is, in effect, being financed out of your working capital.
It is worth looking at the customer analysis alongside the late payments report — together they show not only who buys, but who actually pays.
How to spot a customer who is about to leave
Customers rarely vanish overnight. Almost always, purchase frequency or the average order value has been falling for several months beforehand — it just goes unnoticed, because overall turnover still looks normal at that point.
In practice, a simple rule works: track how often customers buy, not just how much. A customer who used to order every week and now orders every three weeks is already on the way out — even though their annual total has not yet changed.
The lost customers list shows those who have already gone. A change in frequency shows those you can still hold on to — and that is far cheaper than winning them back.
Customer concentration
There is one figure every manager should know: what share of turnover comes from your five largest customers.
If it is more than half, the company is dependent. Losing one of those customers is not a mere “inconvenience” — it becomes the story of your year. The report shows this figure straight away, and the trend over time tells you whether the dependence is growing.
The same applies to account managers: if one person handles half the customer base, their departure is a business risk, not an HR matter.
A good customer is not simply one who buys a lot
When assessing a customer, it pays to weigh three things together: turnover, margin and payment discipline.
A customer with high turnover, a low margin and payments 60 days late is actually costing you money — they are using your working capital while earning you the least. A customer with half the turnover, a healthy margin and reliable payments is worth more, even if they look more modest on the list.
You can see margin by customer in the sales analysis, and payment discipline in the receivables report.
How to get this report
Customer analysis is included in the Rivilė PRO and Finvalda PRO report packages — see the pricing page for details.