See more. Decide better.
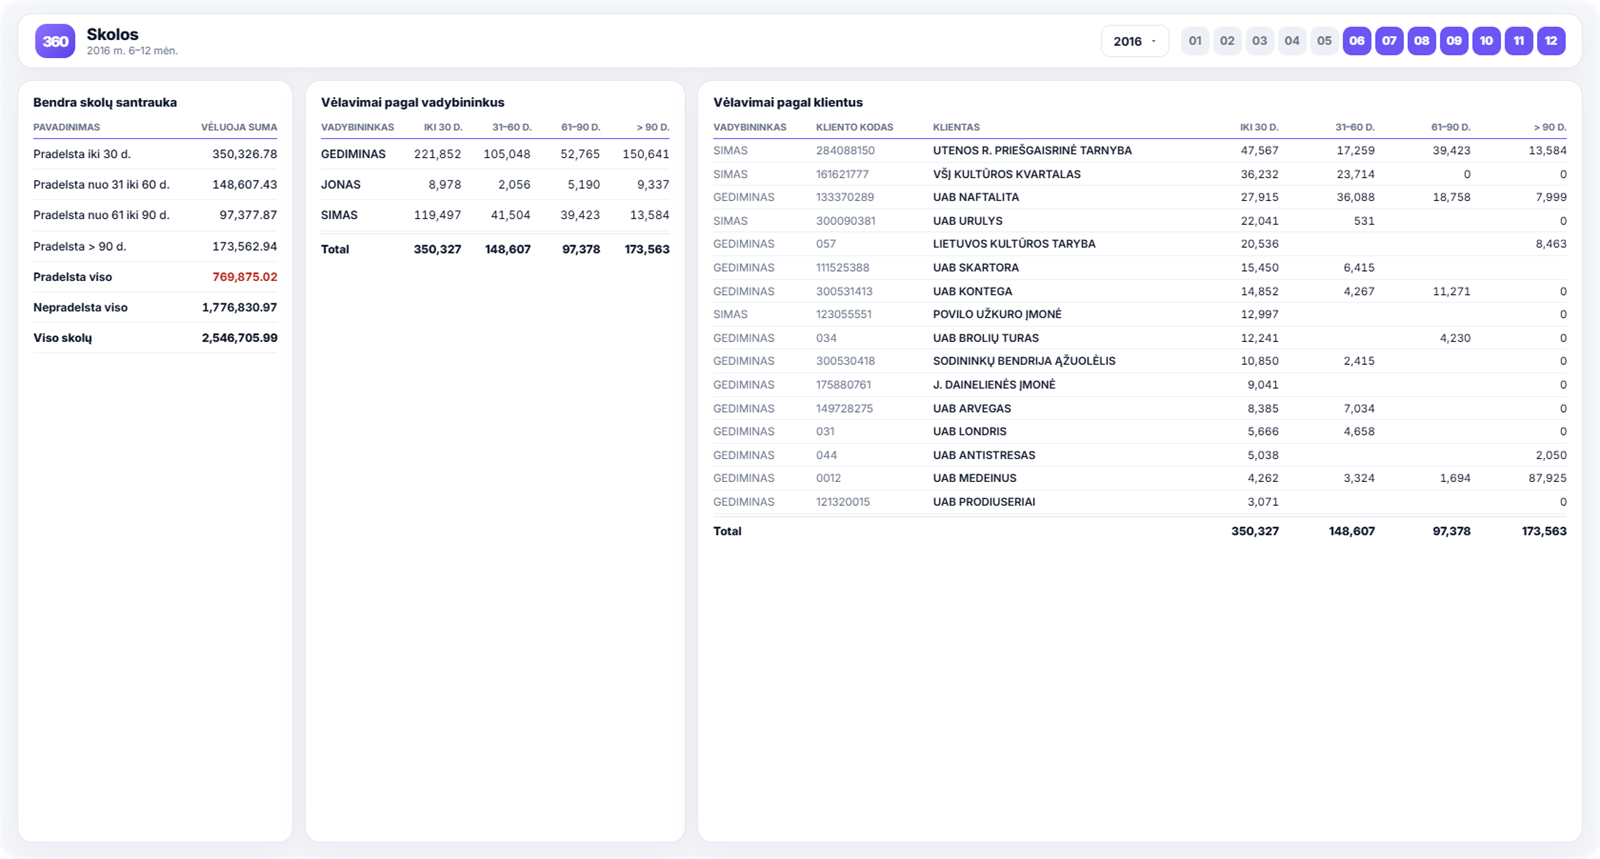
 Debt Analytics: Overdue Receivables by Ageing Band, Customer and Sales Manager

The total amount owed rarely tells you much. What matters is not just how much you are owed, but how long that debt has been outstanding. This report breaks overdue receivables down by how late they are: up to 30 days, 31–60, 61–90 and over 90 days.
Which decisions it helps you make
- Which debts to chase first. Debts over 90 days old are the most likely never to be paid.
- Whose credit to restrict. A customer whose debt keeps sliding into the later bands is a warning sign.
- How your sales managers are performing. Debt by sales manager shows whose customer portfolio is building up overdue balances.
- How much cash is actually tied up. The ratio of overdue to not-yet-due receivables shows how much working capital is sitting idle.
What you see in the report
- an overall debt summary by ageing band;
- overdue and not-yet-due amounts, plus the total receivables balance;
- late payments by sales manager, broken down into ageing bands;
- late payments by customer, with customer code and name;
- a list of potential bad debtors;
- the ability to see which sales manager’s customers are overdue.
How to read this report
Look at how debts move between the bands over time, rather than at a single month’s snapshot. If the amount in the “61–90 days” band grows every month, your earlier collection stage is not working.
Second, set each customer’s debt against their turnover. High turnover combined with large overdue balances does not make a good customer — it is unpaid credit.
For day-to-day control, the late payments report is a better fit, as it shows the individual invoices and the number of days each is overdue.
Why ageing bands rather than the total
A debt loses value with every month that passes. In practice, the likelihood of recovering the money falls off roughly as follows:
- up to 30 days — almost all debts are paid;
- 31–60 days — still under control, but active follow-up is needed;
- 61–90 days — some debts can no longer be recovered without legal action;
- over 90 days — the chance of recovery is slim, and the process itself often costs more than the amount owed.
That is why the key measure in the report is not the total, but how the money moves between the bands. A growing “61–90 days” band means the earlier stage is not working — and that is a management problem, not a customer problem.
Debt by sales manager
The breakdown by sales manager is often the most uncomfortable view, but also the most useful. It answers a question nobody otherwise asks: were the sales figures achieved by selling to customers who actually pay?
A sales manager who leads on turnover but also has the most overdue debt is in reality bringing in less than it appears. If bonuses are calculated on turnover rather than on paid invoices, this situation is built into the system.
This view is usually what prompts a change to the incentive scheme — replacing turnover with cash collected.
How much cash is actually tied up
It is worth turning the receivables balance into a single, easy-to-grasp number: how many days of turnover it represents. If monthly turnover is €200,000 and receivables stand at €300,000, the company is permanently financing its customers to the tune of a month and a half’s turnover.
The same cash is often sitting in the warehouse too — the slow-moving stock report shows how much. Taken together, the two figures explain why a profitable company can have no money in the bank.
How to get this report
Debt analytics is included in the Rivilė PRO and Finvalda PRO report packages — find out more on the pricing page.