See more. Decide better.
 Sales analysis: turnover, margin and invoices on a single screen

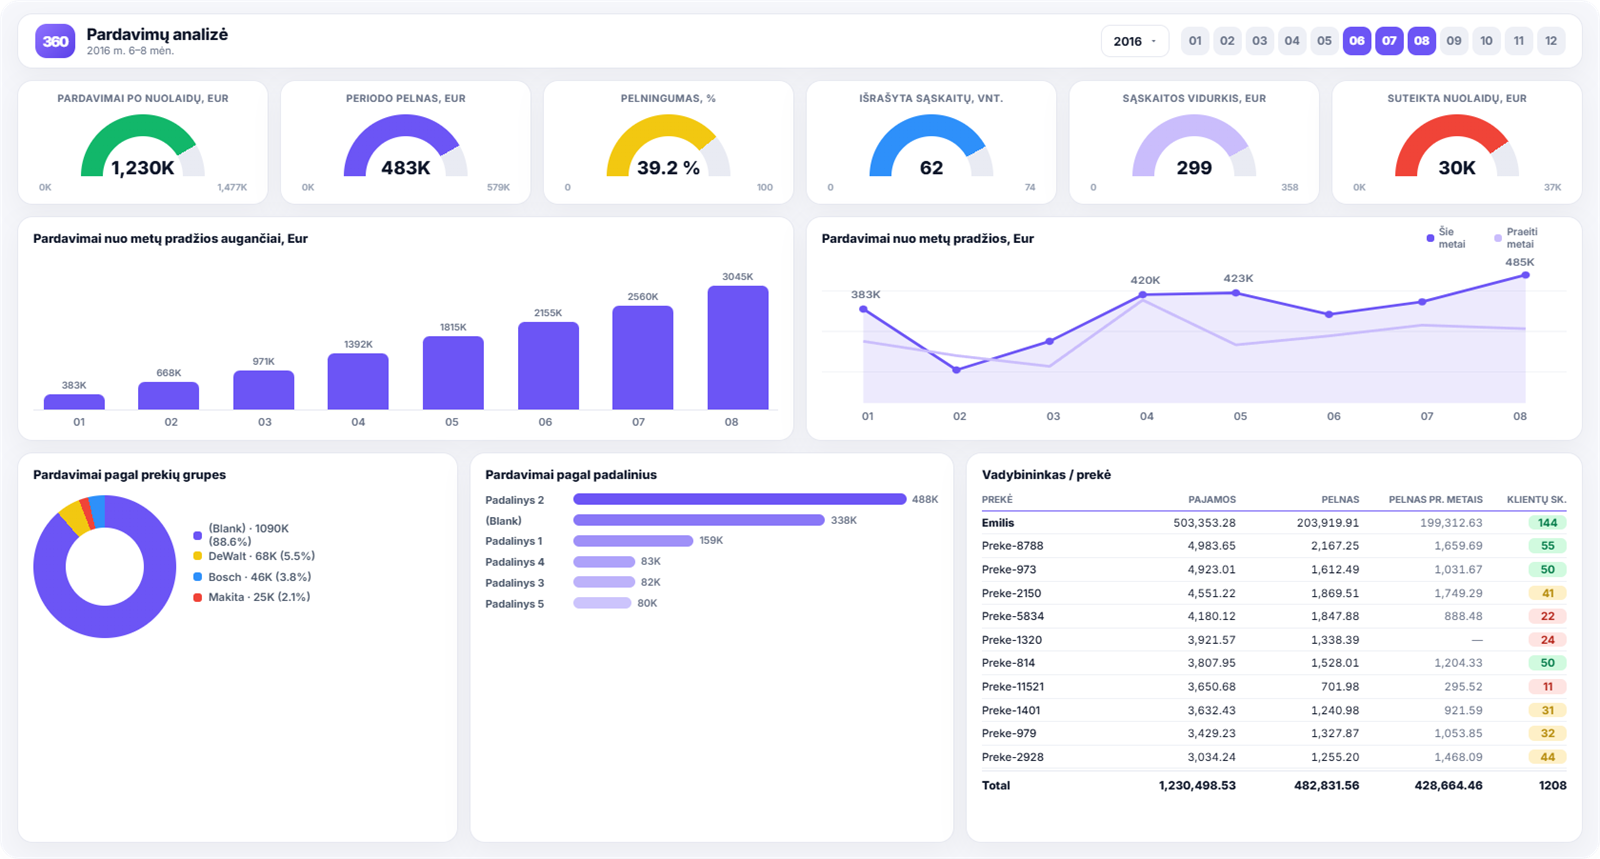
The sales report is the one people look at most often, so it matters that it answers not only “how much did we sell” but also “were those sales profitable”. In this report, turnover, margin and invoice metrics are shown side by side.
The decisions it helps you make
- Are we on track to hit the plan? Cumulative year-to-date sales show whether you are heading towards the target.
- Is growth profitable? Turnover can rise while profitability falls, and you only see this by looking at both figures together.
- Where are discounts doing the work? The total value of discounts granted shows how much margin was given away to make the sale happen.
- Who is performing well? Results by department and by sales manager let you compare them on the same measures.
What you see in the report
- sales after discounts (EUR) and profit for the period;
- profitability as a percentage;
- number of invoices issued and the average invoice;
- total discounts granted;
- cumulative year-to-date sales and a comparison with the previous year;
- sales by product group, department and sales manager;
- a breakdown by sales manager and product, with the number of customers.
How to read this report
The average invoice is an unfairly underrated metric. If turnover has grown but the average invoice has fallen, it means more customers came in but each bought less — an entirely different situation from the same growth with a stable invoice value.
Second, compare profitability across departments. The differences usually stem from discount policy rather than from the market.
For a more detailed breakdown by individual product, see the stock movement analysis.
Turnover and average invoice: four possible combinations
Put two metrics together — the number of invoices and the average invoice — and any change in turnover can be explained at once:
- More invoices, higher average — healthy growth; nothing needs to change.
- More invoices, lower average — you are attracting customers, but they are buying less. Often the result of promotions.
- Fewer invoices, higher average — you are losing customers, but those who remain are buying more. A dangerous combination: turnover looks fine for a while, even as the customer base shrinks.
- Fewer invoices, lower average — an obvious problem, and usually the only one everyone notices.
The third combination is the reason this report is worth your time at all: it does not show up in overall turnover, and its consequences arrive a quarter later. To see which customers have gone, look at the customer analysis.
Discounts come straight out of profit
The total value of discounts granted is often the most striking figure in the report, because it appears nowhere else — a discount is not a cost line; it simply never makes it into revenue.
When you do the sums, remember that a discount comes straight off the margin, not off turnover. With a 25% margin, a 5% discount eats up a fifth of the profit, not a twentieth of turnover. That is exactly why sales managers should be shown a profit measure rather than a turnover one.
What to compare between sales managers
Compare sales managers on turnover alone and the one handing out the most discounts comes out on top. A fairer picture emerges when you combine three things: profit (not turnover), average invoice and number of customers.
A fourth, often overlooked measure is whether those customers’ invoices are actually being paid. A sales manager’s result with a third of it tied up in overdue debts is not yet a result; you can see this in the receivables report.
How to get this report
Sales analysis is included in all the ready-built report packages — for both Rivilė and Finvalda users — as well as in the Basic plans. You will find a comparison on the pricing page.