
Power BI reports on a SharePoint page: how to embed them

Yes, you can embed Power BI reports in a modern SharePoint page using the Power BI web part. It lets you display a full interactive report, a selected page of it or even a single visual directly within the intranet where staff already work every day.
The key requirement lies not in the technology but in permissions: for a user to see the report, they must have a Power BI Pro licence or the report must be published to a Premium or Fabric capacity workspace. The web part does not grant any permissions on its own.
In the sections that follow you will find out:
- which licences the author needs and how many are needed for viewers,
- how to add the web part in practice and when to choose an embed URL instead,
- how to connect SharePoint lists to Power BI as a data source,
- how to align access permissions so the report opens for everyone it is intended for.
Key takeaways
Power BI reports work on a SharePoint page only when three elements are aligned: the web part configuration, the licensing model and the access permissions in the Power BI Service.
| Point | Details |
|---|---|
| The web part is the main method | Edit a modern SharePoint page, add the Power BI web part and select the report via its URL or Browse workspaces. |
| Licensing drives the budget | Pro or PPU suits small audiences; for large intranet audiences, Premium or Fabric capacity usually pays off. |
| Embedding does not grant permissions | Users need separate access to the report in the Power BI Service, ideally through a security group. |
| SharePoint lists as a source | Use the SharePoint Online List connector in Power BI Desktop, but choose Dataverse or SQL for larger volumes. |
| The Analitika360 solution | Analitika360 implements automatically refreshing Power BI reports integrated with SharePoint, Excel and Rivilė and Finvalda data. |
Contents
- SharePoint and Power BI integration: which licences you need
- How to embed a Power BI report in a SharePoint page
- How to connect Power BI to SharePoint lists and files
- Why a user cannot see the report even when the web part is configured
- How to speed up and fix a slow report
- Security and design guidelines for reports in SharePoint
- How Analitika360 handles SharePoint and Power BI integration
- What people usually forget to mention about this integration
- How to start SharePoint and Power BI integration without mistakes
- Sources
SharePoint and Power BI integration: which licences you need
Licensing is the one area where most projects get stuck. The report author, who builds it and publishes it to a workspace, almost always needs a Power BI Pro or Premium Per User (PPU) licence. The question that really determines the budget is a different one: do the viewers have to pay for Pro?
The answer depends on where the report is published. If it sits in a standard workspace, every viewer must have their own Pro or PPU licence. If the workspace is assigned to Premium or Fabric capacity, viewers can open the report without an individual Pro licence, because the entitlement “moves” to the capacity itself.
- Pro / PPU suits cases where up to a few dozen people view the report, usually a single department or project team.
- Premium / Fabric capacity pays off when the whole intranet, tens or hundreds of users, needs to see the report, because you pay for capacity rather than per person.
- Modern SharePoint pages require users to be signed in to Microsoft 365 through Entra ID; if the organisation uses MFA, the first sign-in may require an extra verification step, and it is worth warning staff about this in advance.
Statistical context: in enterprise scenarios, Premium or Fabric capacity allows reports to be published across the whole intranet without separate Pro licences for each viewer, which is why for large audiences it is usually a more economical model than a Pro licence for everyone.
The practical calculation is simple: compare the cost of Pro licences for the expected number of viewers with the monthly fee for Premium or Fabric capacity. Once you have more than a dozen or so viewers, the balance often tips towards Premium. You will find a more detailed comparison in our overview of Power BI licence pricing.
How to embed a Power BI report in a SharePoint page
There are three different routes to embedding, and each suits a different scenario.
- Edit a modern SharePoint page. Open the page in edit mode, click the plus sign next to a section and look for the web part called “Power BI”.
- Select the report. The web part offers two options: browse workspaces (Browse workspaces) directly from the interface, or paste a specific report URL. The second option is more convenient when you already have a ready-made link from the Power BI Service.
- Configure the display. In the web part interface you choose whether to show the whole report, a specific page, the filter pane or the navigation bar at the bottom.
- Publish the page. While the page is left as a draft, only you can see the report; once published, everyone granted the appropriate access will see it.
An alternative route is a direct embed URL from the Power BI Service itself. Open the report, click File → Embed report → SharePoint Online, and the system will generate a link you can paste into the web part without browsing through workspaces. This method works well when you need to quickly reuse the same report on several pages.
The third route, usually avoided because of its complexity, is Power BI Embedded combined with an SPFx (SharePoint Framework) solution. It is intended for the “app owns data” or external users scenario: when the report must be seen by people without a Power BI licence, such as partners or customers on a portal. In this case access is controlled by the application itself rather than by individual Power BI permissions, but it requires a programmatic integration and your own authentication solution. It is a more expensive and longer project, suitable only when the standard “embed for your org” model does not work because the users are outside the organisation.
Pro tip: When you only need to show a single chart, such as a sales trend on a board meeting page, use the “embed a single visual” feature. It cuts page load time and distraction, as the viewer does not see the full report menu.
How to connect Power BI to SharePoint lists and files
SharePoint often holds not just documents but also structured lists: order registers, project tracking tables, request forms. Power BI Desktop has a dedicated connector for this, and the process requires no extra code.

Open Power BI Desktop, choose Get data → SharePoint Online List, enter your SharePoint site URL and click Connect. The system will show all the lists on the site, from which you can select the columns you need and import the data for further analysis.
This connector has its limits:
- It works best with lists of fewer than around 100,000 items; above this threshold performance slows down or becomes unreliable.
- For larger volumes, it is worth using Dataverse or an SQL database as an intermediate layer rather than importing the list directly.
- For larger lists, use incremental refresh so that Power BI updates only new items rather than reloading the entire list.
- DirectQuery is an option, but with SharePoint lists it often runs more slowly than import, so it only suits cases where the data changes very frequently.
It is also worth noting that Microsoft has announced the removal of the older “Visualize the list” integration feature, so if your team has been using it, you will need to replace it with the standard SharePoint Online List connector or the web part.
Pro tip: Before importing, check the column types in the SharePoint list. Date, number and text fields that look tidy in the list sometimes turn into text in the Power Query window if free input was allowed in the list. Fix the types in the Power Query Editor before building visuals, otherwise filters and aggregations will be inaccurate.
A concrete example of linking accounting data with a SharePoint environment is described in our article on Finvalda and Power BI integration.
Why a user cannot see the report even when the web part is configured
This is the question IT teams ask most often: the web part appears blank, or the user seeing the error message has permission to edit the SharePoint page but not to view the report itself. The reason is simple: access to the SharePoint page and access to the Power BI Service are two separate layers.
Embedding does not automatically pass on viewing rights. A user may have full access to the SharePoint site, but if they have not been granted access to the specific report or workspace in the Power BI Service, they will only see an error message.
The practical solution relies on three tools:
- Microsoft 365 or Entra security groups. Grant access to the report to the whole group rather than to individual users, and then manage membership through the group.
- The “push app” feature. A Power BI administrator can automatically distribute an app to all members of a group so they do not have to look for the report themselves.
- App install via the workspace. An alternative where users get access by joining a specific workspace rather than through a separate app.
MFA sometimes causes an additional hiccup: when a new user opens the web part for the first time, the browser may show a sign-in window instead of the report. This is resolved simply by signing in once in the same browser window in which SharePoint is open.
Before rolling the report out to a wider audience, run through a short checklist: the user belongs to the correct security group, the group has been granted access to the workspace, the licensing model (Pro or Premium) matches the number of viewers, and the report has been published, not just saved as a draft.
How to speed up and fix a slow report
A slow-loading report on a SharePoint page usually has one of three causes: too many visuals, an oversized data model or the wrong data connection mode.
First, reduce the number of visuals on each page. Every additional chart means an extra query to the data source, and SharePoint, running in the browser, feels this load more heavily than when the report is opened directly in the Power BI Service.
Second, choose the right data connection mode. Import mode is usually faster, as the data is already compressed in the Power BI engine’s memory. DirectQuery suits cases where the data changes every minute and an import would not reflect the real situation, but it requires a stable, fast connection to the underlying source.
- Use caching and aggregations when data volumes are large, so visuals do not recalculate the entire dataset every time.
- Use incremental refresh instead of a full refresh when a table has millions of rows.
- Use DirectQuery only when data freshness matters more than speed.
- Dynamic filtering driven by URL parameters in the SharePoint web part has its limits; more complex cases require an SPFx solution.
The web part supports the filter pane and navigation bar directly in its interface, so you often do not even need extra SPFx code for dynamic filtering if the filtering logic is straightforward.
When a report will not open at all, start troubleshooting with three things: check the user’s licence and workspace access, see whether the report has been published (rather than left as a draft), and open the browser console (F12), which often shows the exact cause of the error, such as an authentication or CORS error.
Security and design guidelines for reports in SharePoint
A report that works well when opened directly in the Power BI Service does not always look good when embedded in a SharePoint page. The difference often comes down to the fact that a SharePoint page gives the report less space, and users view it alongside other page elements rather than full screen.
It is advisable to design reports specifically for SharePoint embedding: fewer visuals per page, larger typography and a single clear theme without an overloaded colour palette. This improves both load time and readability in a smaller window.
- Use Row Level Security (RLS) when different departments need to see the same report but each only its own data; this avoids separate copies of the report for each department.
- Apply sensitivity labels and block export when a report contains financial or personal data, and align these rules with your Microsoft Purview policies.
- Regularly review the access logs in the Power BI Service admin portal to see who has access and whether they still need it.
- Carry out a periodic access review every quarter, especially if your team structure changes often.
Combining RLS with SharePoint page groups lets you maintain a single version of a report for several audiences without the risk of one department seeing another’s financial figures.
Pro tip: If a report is viewed by both senior management and other staff, create two separate pages in the same report: one with detailed data (restricted by RLS) and another with a general summary visible to everyone. This saves you from having to build two entirely separate reports.
How Analitika360 handles SharePoint and Power BI integration
Analitika360 implements combined SharePoint and Power BI solutions for clients whose data is scattered across Rivilė or Finvalda accounting software, Excel spreadsheets and SharePoint sites. Instead of a manager pulling figures together by hand from several sources, all reports are designed in advance and refresh automatically without any further input from the user.
The practical effect shows up in two groups of clients. Restaurant chains use real-time revenue and cost indicators instead of month-end summaries that reach the manager a week late. Accounting firms working with several clients at once save time because reports are generated automatically rather than by collecting data manually from each client separately.
- Integration with SharePoint and Excel brings data from different sources together in a single dashboard.
- Automatic refresh removes the need to transfer data by hand.
- Report templates tailored to specific sectors (restaurants, logistics, construction) shorten implementation time.
A system that updates itself is not a luxury but a necessity when decisions are made daily rather than once a month.
You can see real examples of the reports we have implemented on our Power BI report examples page.
What people usually forget to mention about this integration
Most managers we hear talking about SharePoint and Power BI integration focus on the technical embedding step, even though it is the easiest part of the project. Adding the web part takes a few minutes. The real work lies in the licensing decision and the access architecture, which stays invisible until someone can no longer open the report.
A common mistake we see again and again: an organisation buys Premium capacity “to be on the safe side”, even though its audience is just ten people. In that case Pro licences would be cheaper and simpler to manage. The opposite mistake is just as common: trying to keep Pro licences for dozens of departments when Premium capacity would long since have paid for itself.
The second frequently underestimated issue is access synchronisation. Teams build a fine report, embed it in a page, and only a week later discover that half the department cannot see it because nobody added them to the security group on the Power BI side. This separation between SharePoint and Power BI permissions is not a flaw but an architectural decision that needs to be understood in advance, not discovered while firefighting.
If you want the integration to work from day one, address licensing and access together with the technical side, not after it.
How to start SharePoint and Power BI integration without mistakes
If you are reading this article, you have probably already tried to configure the web part yourself or are planning to do so soon. The do-it-yourself route works, but it takes time to get to grips with licences, RLS rules and data source configuration correctly first time.
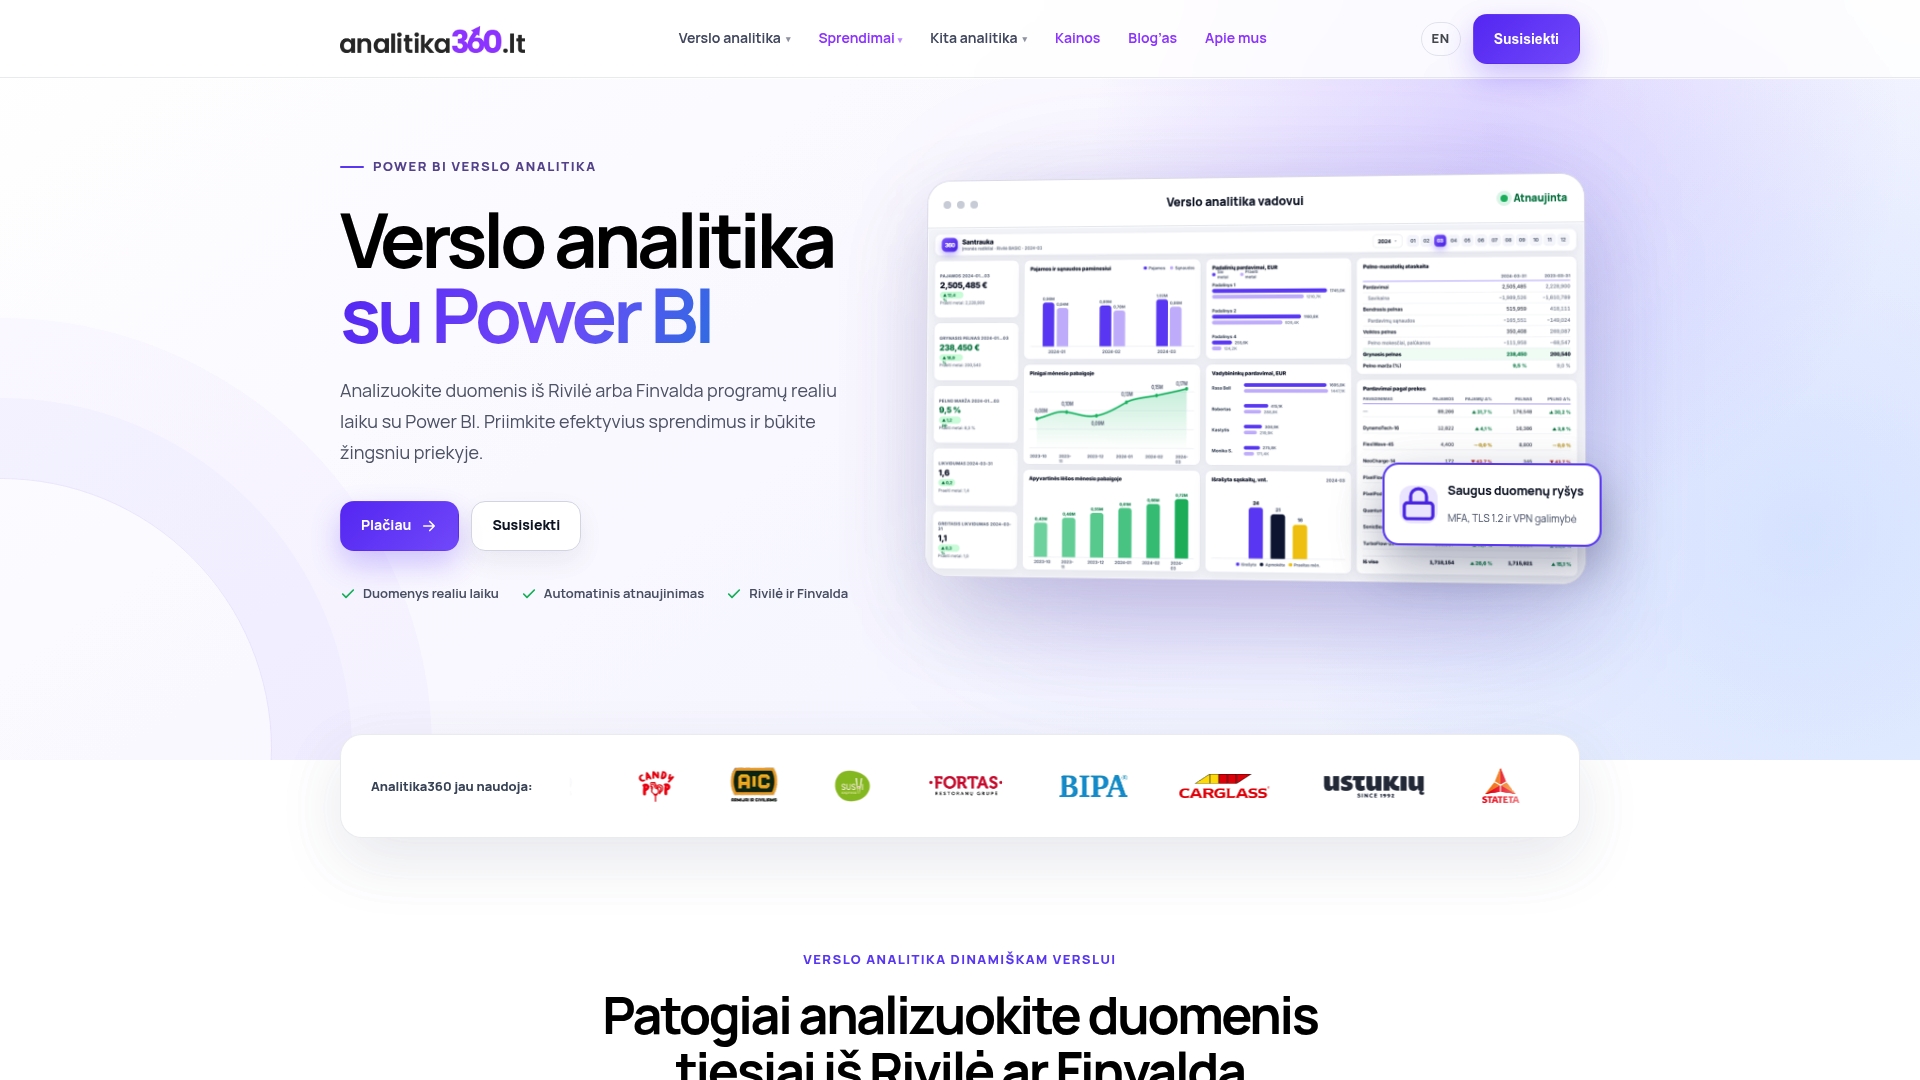
Analitika360 offers a different route: ready-made, customised Power BI report packages that are already integrated with Rivilė or Finvalda data, SharePoint sites and Excel files, and that refresh automatically without manual work from your team. Instead of your IT specialist spending weeks sorting out licences and access groups, the solution is delivered with the architecture already configured and tailored to your sector, whether you are a restaurant chain, a logistics company or an accounting firm working with several clients.
Browse our business analytics solutions by sector and choose the package that matches your data volume and audience size.