
Financial KPIs: Formulas, Examples and Implementation Steps

The priority finance KPIs are measures of profitability, liquidity and operational efficiency. EBITDA, net margin, ROA and the current ratio reveal the most about a company’s health. Start with these four or five measures, set SMART targets for them and automate the monitoring, so that decisions are based on facts rather than intuition.
In brief:
- Your core finance KPIs should cover profitability, liquidity and operational efficiency, and tracking them should be automated.
- KPI definitions such as EBITDA and ROA must be clear and measurable, with explicit thresholds set according to past results and market averages.
- Most companies need to track between three and seven KPIs, and they should be analysed regularly, at a frequency that matches the decisions being made.
- Data quality is critical, so the agreed formulas must be followed and data reliability ensured through periodic checks.
- Automated KPI reports from Rivilė and Finvalda let you track financial indicators in real time, using standard or bespoke analytics packages.
Contents
- What financial KPIs are: definition and relationship to financial statements
- The main groups of financial KPIs, with examples
- Formulas and worked examples: EBITDA, margins, ROA, ROE, liquidity and efficiency metrics
- How to set KPIs: applying SMART, benchmarks and ownership
- Common mistakes and compliance risks (data governance, VAS/IFRS, AVNT)
- An Analitika360 example: automated KPI reports from Rivilė and Finvalda with Power BI
- Editorial perspective: from reports to decisions
- How to choose the right Power BI solution for KPI monitoring
- Sources
- Frequently asked questions
What financial KPIs are: definition and relationship to financial statements
A financial KPI is a management measure that supplements the standard accounting statements. It shows how the company is performing in real time, not just what must be disclosed in the annual report. IFRS documents describe this distinction through the concept of management performance measures: management defines for itself the measures that best reflect its performance, but must describe them transparently.
The classic example is EBITDA versus net profit. Net profit reflects all taxes, interest and depreciation. EBITDA shows how much cash the operations themselves generate, stripping out the effect of financing and accounting decisions. Both figures are needed, but they answer different questions.
The main groups of financial KPIs, with examples
Financial KPIs fall into four groups, and each answers a different management question.
- Profitability – is the business making money at all? EBITDA, EBITDA margin, net profit margin, ROA, ROE.
- Liquidity – does the company have the cash to pay its bills? Current ratio, quick ratio, net working capital.
- Operational efficiency – how quickly do assets and cash turn over? Working capital turnover, cash conversion cycle (CCC), days sales outstanding (DSO).
- Capital structure – how far does the company rely on borrowed capital? Debt-to-equity ratio, interest coverage ratio.
Priorities shift with circumstances. In a growth phase, profitability and efficiency measures matter most, because they show whether expansion is creating added value. During a crisis or a seasonal downturn, the liquidity group becomes the most important, because it shows how many days the company can operate without borrowing. In manufacturing the CCC is especially important; in retail, inventory turnover; in services, DSO and staff productivity ratios.
Formulas and worked examples: EBITDA, margins, ROA, ROE, liquidity and efficiency metrics
Concrete formulas let the finance team start calculating straight away, without waiting for further explanation.
- EBITDA = net profit + interest + taxes + depreciation + amortisation.
- EBITDA margin = EBITDA / revenue × 100%.
- Net profit margin = net profit / revenue × 100%.
- ROA (return on assets) = net profit / average total assets × 100%. A figure of 8% means that every euro of assets generates 8 cents of profit.
- ROE (return on equity) = net profit / equity × 100%. A high ROE alongside a low ROA often signals heavy borrowing rather than efficiency.
- Current ratio = current assets / current liabilities. A ratio of around 1.5–2 is generally regarded as safe.
- Quick ratio = (current assets excluding inventory) / current liabilities.
- Working capital turnover = revenue / working capital.
- Cash conversion cycle (CCC) = days inventory outstanding + days sales outstanding, minus days payables outstanding.
Pro tip: When calculating EBITDA margin, compare how it changes over several quarters rather than a single period – a one-off figure can mislead because of seasonality.
It is worth noting that the exact calculation method can vary. ECB analysis shows that the interpretation of profit indicators depends on whether the base is value added or total supply, which means a company’s internal KPIs and the figures under accounting standards rarely match perfectly.
How to set KPIs: applying SMART, benchmarks and ownership
A KPI without a specific threshold is just a number in a table. The SMART principle forces every measure to be tied to a real objective.
- Specific: not “increase profitability” but “raise EBITDA margin from 12% to 15% within two quarters”.
- Measurable: every KPI has a formula and a clear data source.
- Achievable: thresholds are set according to the trend of previous years, not wishful thinking.
- Relevant: the measure is linked to a strategic objective, for example net profit margin if the goal is cost control.
- Time-bound: a clear date on which the result is checked.
Thresholds are best set in two layers: an internal benchmark (last year’s result) and a market benchmark. For sector averages, Eurostat data is useful, showing the profit share of EU non-financial corporations in 2024.
Every KPI needs an owner who is accountable for changes in the measure, and a threshold that automatically flags a problem. Start with 3–7 measures. More figures at once create noise rather than clarity.
Common mistakes and compliance risks (data governance, VAS/IFRS, AVNT)
Three mistakes recur most often: different calculation methods across departments, unreliable or manually keyed sources, and trying to track too many measures at once.
- An EBITDA formula that is not aligned between the finance and operations departments creates two “truths” within the same company.
- Excel files without version control increase the risk of error every time data is transferred by hand.
- Tracking too many KPIs (more than 10–12) dilutes attention on the most important measures.
The controls are simple: a documented formula book, a data change log (audit trail) and periodic testing that compares the automated calculation with a manual one. In Lithuania this is particularly relevant, because the 2025 monitoring by AVNT, the Authority of Audit, Accounting, Property Valuation and Insolvency Management, reviewed the financial statements of 41 companies and found significant shortcomings in many cases.
Data quality is not a technical detail; it is the very foundation of a KPI’s reliability. If the notes to the financial statements do not agree with the balance sheet, no dashboard will save you.
Best practice is a hybrid model: use accounting standards (VAS, the Lithuanian Business Accounting Standards, or IFRS) for external reporting, and management KPIs for quick internal decisions, clearly marking them as management rather than audited measures.
An Analitika360 example: automated KPI reports from Rivilė and Finvalda with Power BI
Analitika360 feeds data from Rivilė and Finvalda straight into Power BI reports, also bringing SharePoint, Excel or CRM data together in a single model. The reports refresh automatically, with no further intervention from the user, so revenue, cost, profit and inventory figures are visible in real time rather than after month-end close.
The KPIs most often automated are EBITDA margin, net profit trends, the current ratio and days sales outstanding. Implementation usually starts with the ready-made Basic package when standard reports are needed, while PRO or a bespoke project is chosen when specific breakdowns by department or sector are required, for example for restaurant chains or logistics companies.

Editorial perspective: from reports to decisions
Most companies track too many KPIs and rely on them too little when making decisions. A measure that nobody is accountable for is just a number in a table. Start with three to five KPIs, run them through one full financial cycle, and only then expand the list, if the measures are genuinely changing behaviour.
— Analitika360
How to choose the right Power BI solution for KPI monitoring
If your company uses Rivilė and you want to start tracking your core financial KPIs quickly, the Rivilė Basic package costs €59 a month and includes ready-made reports with no additional implementation time. When you need deeper analysis, a multi-department breakdown or integration with additional sources, Finvalda PRO at €89 a month is worth considering, or a bespoke project at €70 an hour when your needs go beyond a standard package.
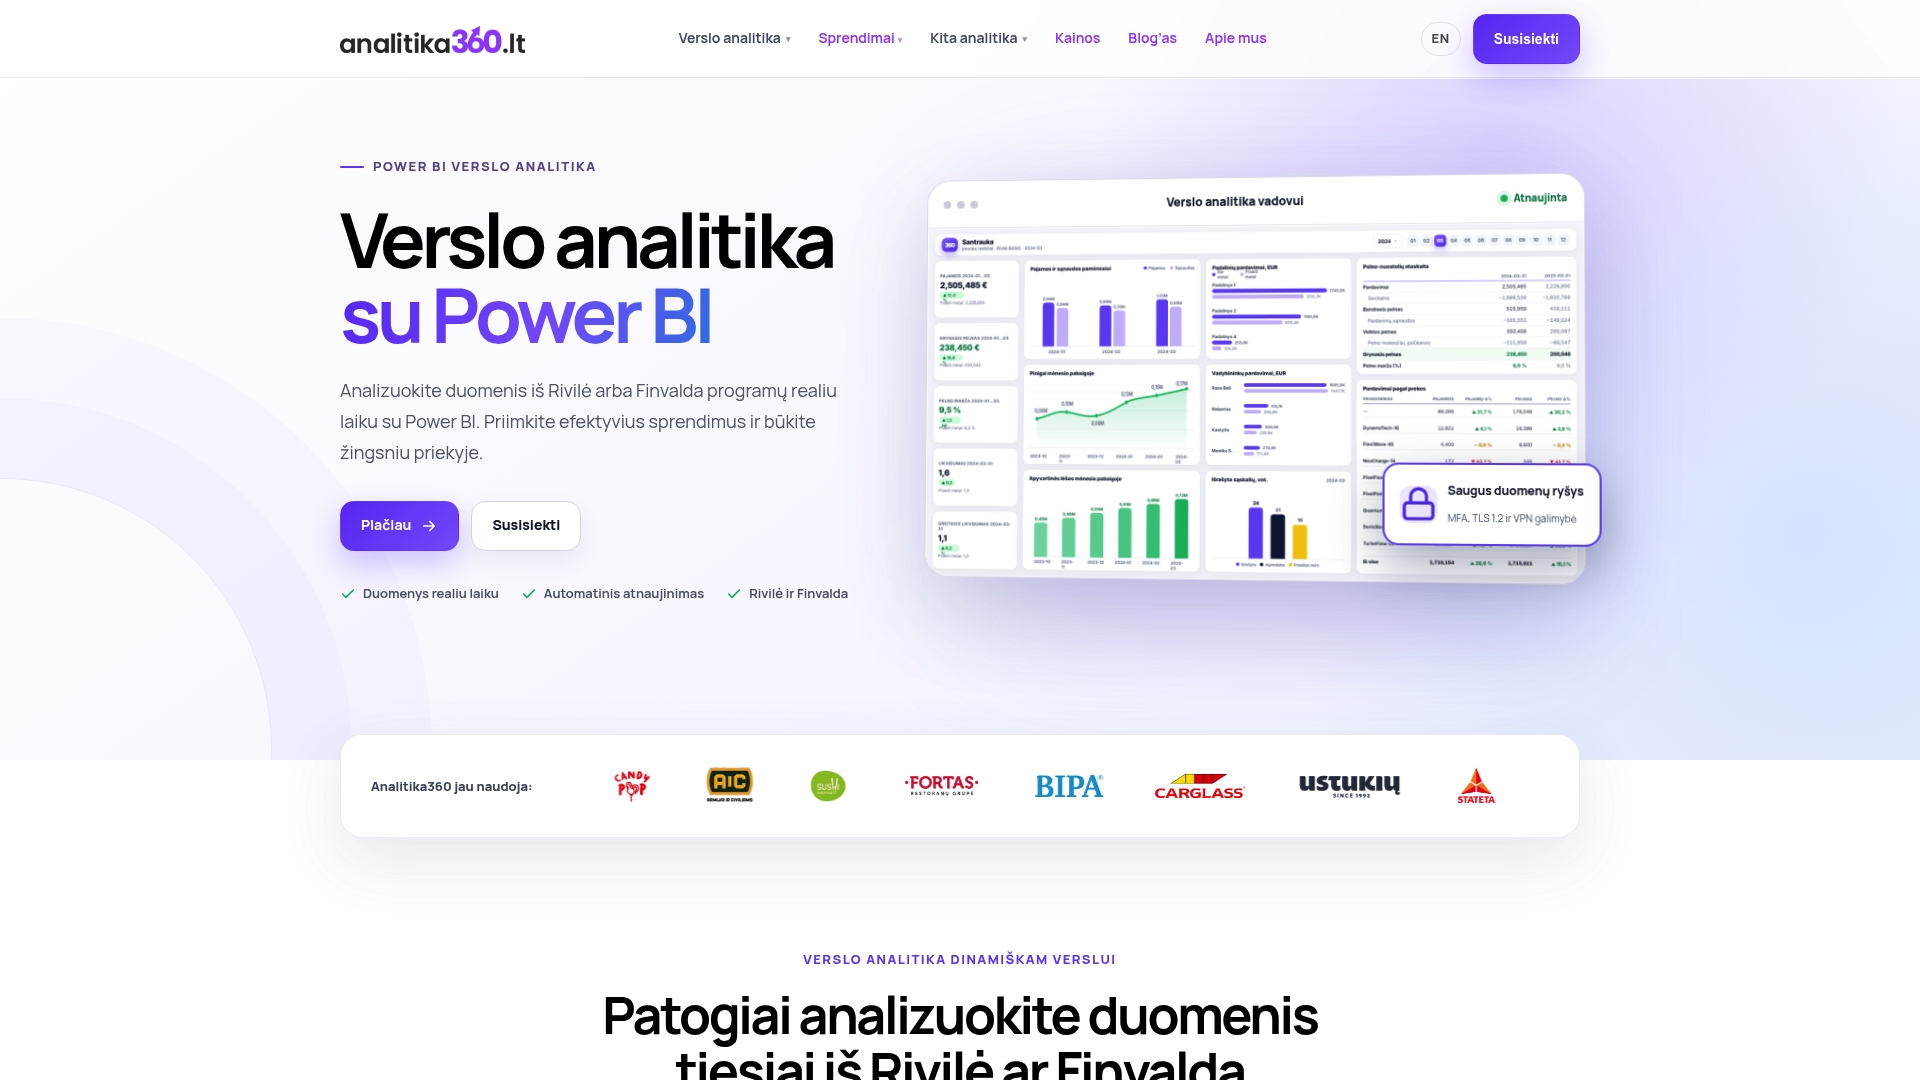
Unlike generic analytics tools that have to be configured from scratch, Analitika360 solutions recognise the Rivilė and Finvalda data structure out of the box, so the first reports are usually ready within a few days rather than weeks. If you would like to see how this would look with your own company’s data, get in touch to arrange a demo and choose the package that suits your needs; see the full price list.
Sources
Several official sources are useful for checking calculations and compliance questions: the IFRS staff paper on management performance measures, ECB macroeconomic data for sector benchmarks, AVNT guidance on reporting quality, and Eurostat statistics for EU-level comparisons.
This article is general information, not a substitute for advice from a qualified financial advisor. Consult a qualified financial professional about your own circumstances before acting on anything here.
- Financial Key Performance Indicators for Business Entities (IFRS / FASB meeting paper)
- Profit indicators for inflation analysis considering the role of total costs (ECB)
- Quality monitoring of financial statements submitted to the Register of Legal Entities (JAR) data controller (AVNT)
- Profit share and investment rate of non-financial corporations (Eurostat)
Frequently asked questions
How many financial KPIs should be tracked at once?
Start with 3–7 measures that are directly linked to a strategic objective. A larger number often reduces attention to the most important changes rather than increasing control.
What is the difference between EBITDA and net profit?
EBITDA shows profit from core operations, excluding interest, taxes, depreciation and amortisation. Net profit includes all of these elements, so it better reflects the final financial result.
How often should KPI reports be updated?
Liquidity and cash flow measures are worth checking weekly or daily, and profitability measures monthly or quarterly. The frequency depends on how quickly operational decisions are made.
How much does an automated KPI reporting system cost?
The Rivilė Basic and Finvalda Basic packages cost €59 a month, and the PRO versions €89 a month. Bespoke projects are charged at an hourly rate of €70 an hour.
What are management performance measures and how do they differ from standard accounting measures?
They are measures defined by management itself that supplement the required accounting statements, as described in IFRS documents. They make it possible to see performance trends more quickly, but they must be explained transparently so that they are not misleading.