
Finvalda Sales Analysis with Power BI: A Practical Guide

Finvalda sales analysis with Power BI through Analitika360 lets you see sales segments, sales managers’ results and seasonality in real time, insights that otherwise get lost in accounting reports. Instead of gathering data from Finvalda by hand, you get automatically refreshed reports covering revenue, profit and inventory metrics. In this article you will find specific KPIs, data preparation steps and the most common mistakes worth knowing about before you start.
In brief:
- If you use sales and inventory data, the integration lets reports refresh automatically several times a day, saving time and giving you real-time analysis.
- The key KPIs include sales revenue, net profit, average order value and sales manager comparisons, which help you spot profitability problems and gauge operational efficiency.
- Data preparation involves exporting and checking sales, inventory and customer data, paying particular attention to unique identifiers and consistent formatting.
- Licences start from €10 a month per user, with additional charges for report segmentation and wider functionality.
- Broader integration and analytical methods let you separate out seasonal fluctuations, analyse correlations and forecast sales, but it is best to start with simple methods.
Contents
- Integrating with Power BI and Analitika360: what you connect and what you get
- Which KPIs to track in Finvalda reports and why they matter
- Preparing data for Finvalda analysis: export, cleansing and typical mistakes
- Analytical techniques: when to use descriptive statistics, correlation or regression
- How Analitika360 puts Finvalda sales analysis into practice
- The Analitika360 view: when to choose a package and when a bespoke solution
- Get started with Analitika360: packages, demo and next steps
- Sources
- FAQ
Integrating with Power BI and Analitika360: what you connect and what you get
Finvalda sales data, inventory records and customer records are connected to Power BI through Analitika360’s solutions, with no extra manual exporting. The system refreshes the reports several times a day, so management sees not last month’s position but, in practice, the current one.
Analitika360 offers ready-built Power BI solutions in which sales are broken down by sales manager, product, customer and period. This means there is no need to build a report from scratch; you simply connect your Finvalda database.
What is typically integrated:
- Sales transactions: invoices, returns, discounts.
- Inventory movements: stock balances, inventory changes, stocktakes.
- Customer records: segments, regions, payment terms.
- Budget data from Excel files, combined with actual results.
The subscription model is built around two packages designed for different business needs, covering sales and profit reports as well as report segmentation and comparisons. An indicative Power BI licence costs from €10 a month per user, including VAT, on top of the fee for the report package itself.
Which KPIs to track in Finvalda reports and why they matter
Not all metrics are equally valuable. Some reveal a problem only after it has already cost you money, while others let you act in advance.
The main KPIs worth tracking in Finvalda sales analysis:
- Sales revenue by period, product and sales manager. Shows the overall direction, but not profitability.
- Net profit after costs. Essential, because high revenue with low profit signals a pricing problem.
- Average order value (AOV). A falling AOV often means customers are buying fewer units per order.
- Sales volume in units. Separates the effect of price changes from genuine shifts in demand.
- Sales manager comparison. Reveals who actually generates revenue and who merely processes existing order lines.
Falling sales volumes alongside stable revenue usually point to price rises that are, for now, offsetting the loss of volume, but this is not a sustainable model.
Statistical insight: time series analysis reveals recurring seasonal patterns that a one-off monthly report conceals. Statistical methods such as descriptive statistics and time series decomposition are often used to distinguish sales fluctuations from genuine trends.
Preparing data for Finvalda analysis: export, cleansing and typical mistakes
Before connecting to Power BI, the data from Finvalda needs to be in good order. Finvalda WEB supports a wide range of transactions, including purchases, sales, reservations, returns and stocktakes, which can be exported to Excel format.
Steps before connecting:
- Export sales, inventory and customer record data as separate files.
- Check the ID fields: every product and customer must have a unique, non-duplicated code.
- Standardise the date format across all reports so that Power BI reads the time series correctly.
- Check currency and category names if you work with several divisions or warehouses.
The most common mistake is duplicated customer codes, which cause revenue to be attributed to the wrong segment. Another frequent problem is exported data that includes an intermediate VAT amount, which distorts profit calculations unless it is removed before analysis.
Pro tip: when connecting data for the first time, pick one problem area, such as sales by category, and tidy up the model for that area only. A wider report is easier to build once one data stream has already been checked and cleaned.

Analytical techniques: when to use descriptive statistics, correlation or regression
Not every question calls for a complex model. It is usually best to start with a simpler technique and move to more sophisticated ones only when the simple methods fail to give an answer.
- Descriptive statistics and time series analysis reveal seasonality, for example when in the year sales rise and fall, and let you forecast the next cycle.
- Correlation suits the question of how two metrics move together, for example how a price change relates to the quantity sold.
- Regression shows how much a particular factor (season, price, advertising budget) affects sales results, separating its influence from other variables.
Even simple statistical models, such as linear regression or time series forecasting, give small and medium-sized Lithuanian businesses a real advantage, provided the underlying data is clean. Starting with a complex model when the database is messy only distorts the conclusions.
How Analitika360 puts Finvalda sales analysis into practice
Analitika360’s solutions connect to both the Finvalda and Rivilė accounting systems, so businesses working with data from several systems get a single, shared analytics environment. Reports refresh automatically, with no further input from the user.
What a Finvalda user actually gets:
- Different report packages tailored to a range of business needs.
- Automatic data refresh several times a day, directly from the Finvalda system.
- Implementation services covering account linking, report parameter setup and user training.
- Consultations during the initial implementation stage, which are often provided at no extra charge in the first few months.
By using electronic data analysis systems, some clients can save time previously spent preparing reports by hand and get the financial information they need for decision-making.
The Analitika360 view: when to choose a package and when a bespoke solution
A ready-built package suits businesses whose KPIs are standard: revenue, profit and sales manager comparisons. A bespoke solution is needed when the industry has its own particular logic, such as analysing waiting staff shifts in restaurants or stage-by-stage profitability of construction projects.
The investment usually pays for itself within a few months if someone was previously spending several hours a week preparing reports by hand. A good starting point is a demo and an inventory of your existing data sources, which will show whether the Basic package is enough or whether broader integration is needed.
— Analitika360
Get started with Analitika360: packages, demo and next steps
Analitika360 is an alternative to manual reporting for Finvalda users in Lithuania: instead of spending several hours a week copying data into Excel, you get an automatically refreshed Power BI reporting system connected directly to your accounting data.
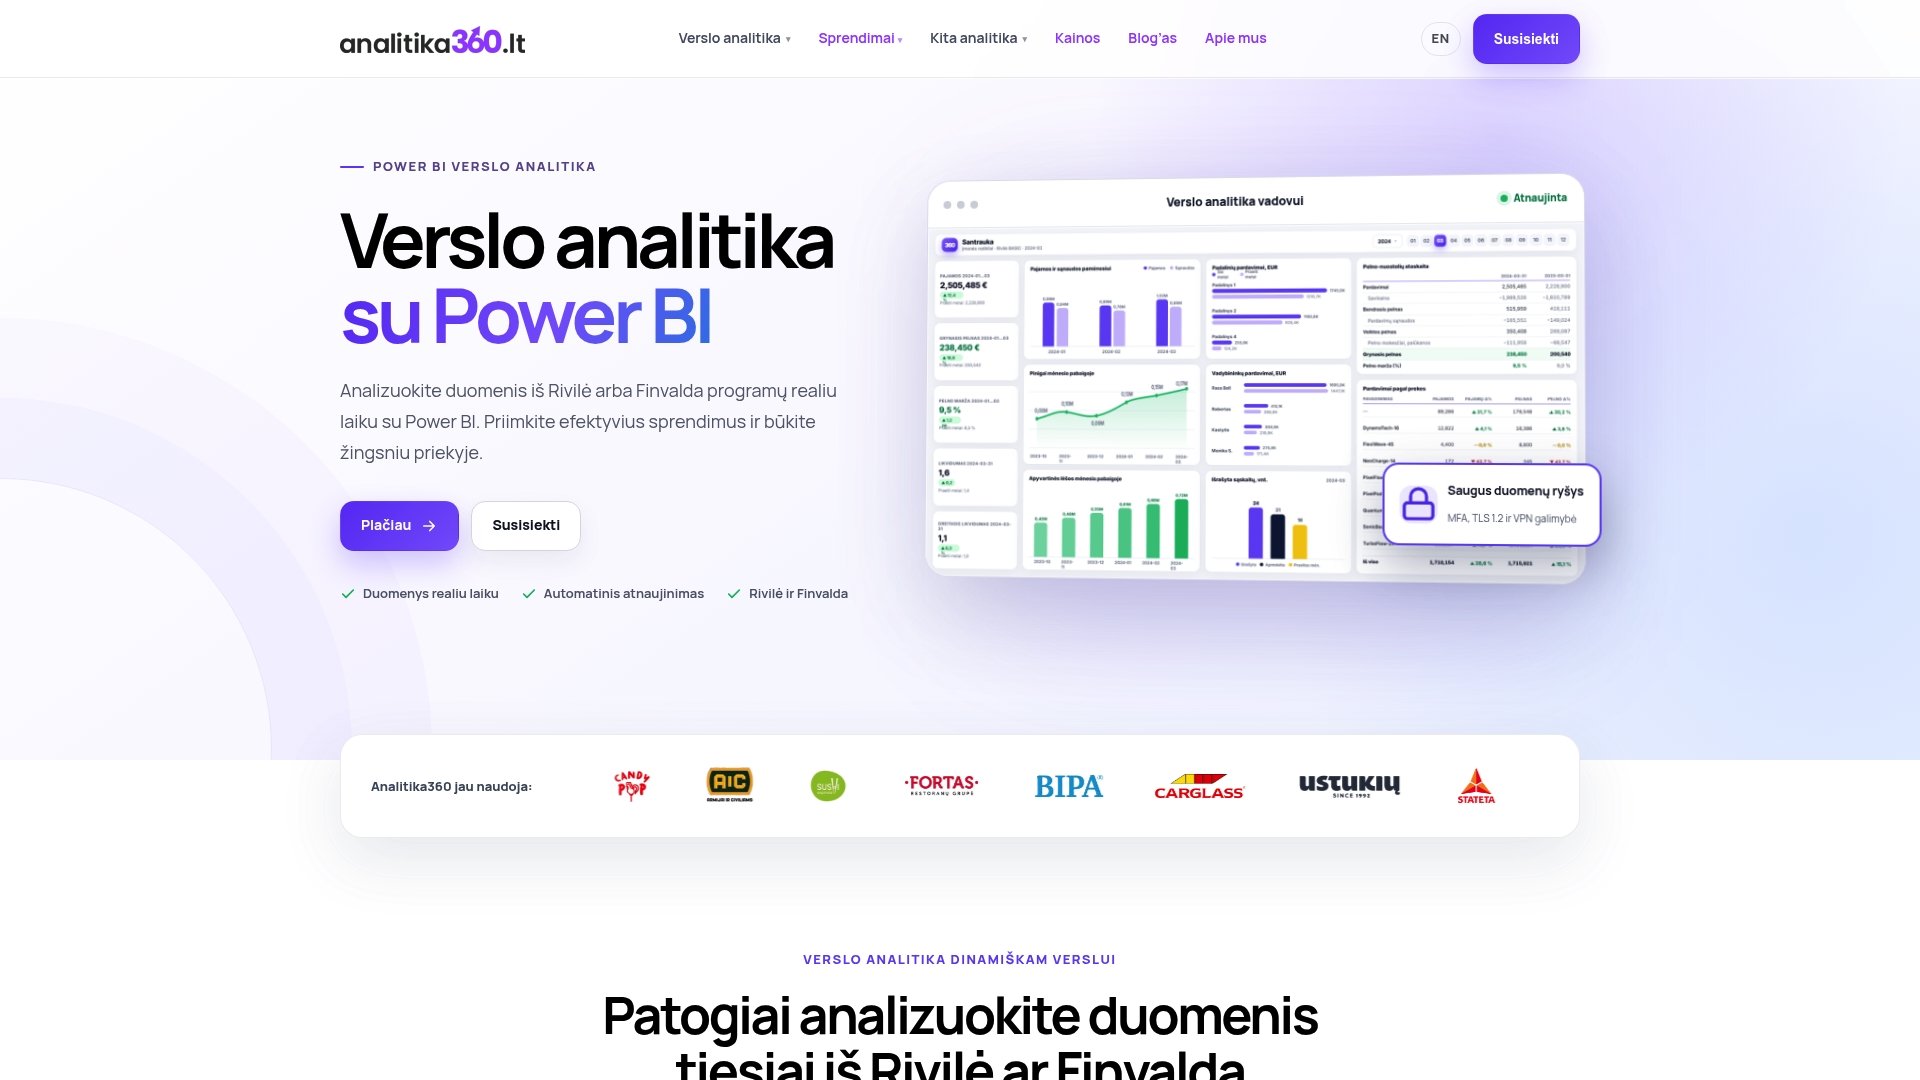
Depending on the package you choose, the report packages include core sales and profit reports as well as additional segmentation and analysis tools. Before booking a demo, check which Finvalda modules you use and whether your data exports cleanly; this will help the consultant assess the most suitable package more quickly. Browse our business analytics solutions by industry and get in touch to arrange a personal demo if you would like to see how the reports would look with your own data.
Sources
- Integration with Microsoft Power BI | Finvalda
- Data analysis reveals hidden business opportunities through statistics – Statistics portal
FAQ
What is Finvalda sales analysis with Power BI?
It means connecting data from the Finvalda accounting software to Power BI through Analitika360, so you can see sales, profit and inventory metrics in automatically refreshed reports.
How much does a Power BI licence cost for a Finvalda user?
The indicative price is from €10 a month per user, including VAT, on top of the fee for the chosen report package.
What data needs preparing before connecting Finvalda to Power BI?
You need to export sales transactions, inventory movements and customer record data, and check the ID fields, date formats and currency notation.
What is the difference between the Basic and PRO report packages?
The Basic package covers core sales and profit reports, while the PRO package adds sales manager segmentation and deeper product and customer analysis.
Which KPIs are worth tracking first?
Sales revenue, net profit, average order value and sales manager comparisons, because together these metrics show both volume and profitability.