
Finvalda Warehouse Reports: A Complete Step-by-Step Guide for 2026

Yes, Finvalda has a full set of warehouse reports: stock balances, stock balances at a date, stock movements, write-offs and stocktakes. The route to them is the same in every version of the system: open the report tree, choose the warehouse group, apply your filters, click ‘Preview’ and confirm. You can export the result straight away to XLS, CSV or XML, or schedule an automatic daily report pack.
In brief:
- If you use Finvalda, you can create and export warehouse reports in a few minutes and schedule them to run automatically.
- In both versions, WEB and Finance, the report tree and filters follow the same logic; they simply run in different environments.
- Most errors stem from inaccurately entered balances or from filters that fail to account for multiple warehouses or objects.
- Exporting to CSV or XML is usually best for analysis, while XLS suits people who review and analyse the figures by hand.
- Power BI integration lets you refresh warehouse metrics automatically and link them to sales and costs without any manual work.
Contents
- The report tree in Finvalda: where to find warehouse reports
- How to generate a specific warehouse report in Finvalda
- The most commonly used warehouse reports and what they tell you
- Export formats: when to choose XLS, CSV or XML
- Typical errors when generating warehouse reports and how to fix them
- Integration with Power BI: how Analitika360 extends Finvalda warehouse reports
- Editor’s note: when Finvalda is enough and when it pays to automate
- How Analitika360 automates Finvalda warehouse reports
- Sources
- Frequently asked questions
The report tree in Finvalda: where to find warehouse reports
All Finvalda reports, warehouse reports included, sit within a single structure that the system documentation calls the report tree. The structure works on three levels: group, subgroup and the specific list of reports. The warehouse block usually sits next to the purchasing and sales groups, so for a new user the first challenge is not the report itself but finding your way to it.
According to the official documentation, the reports in the tree are arranged into groups and subgroups, and every filter window is dynamic. This means the filter fields change depending on the report you select: in the stocktake report, for example, you will see a date range and a warehouse code. The stock movement report adds a document type field as well.
In practice, the best way to navigate the tree is as follows:
- Open the main menu and find the warehouse group among the other modules (purchasing, sales, cash).
- Right-click the name of the report you want to open a context menu with the ‘Preview’ command.
- Select ‘Preview’ to open a dynamic filter window with the parameters specific to that report.
- If the list of reports is too long, hide the rows you don’t need. Finvalda lets you customise the list of visible reports and saves this setting in your user profile.
- Once configured, the tree stays the same the next time you log in, so you only invest the time once.
The difference between Finvalda WEB and Finvalda Finance (also known as Finvalda PRO) is a practical one rather than a fundamental one. Both versions use the same report tree principle, but Finvalda WEB runs in a browser, while Finvalda Finance is a desktop application more often used by larger accounting departments. The filter logic and report names are the same, so instructions for one system almost always apply to the other.
Pro tip: *if your list of warehouse reports feels too broad, keep only the 4–5 you use most often visible (stock balances at a date, movements, stocktake) and hide the rest. This cuts search time every time you need a quick answer before a meeting with management.
How to generate a specific warehouse report in Finvalda
Generating a warehouse report in Finvalda WEB or Finance takes a few minutes once you know your filters. The step-by-step plan below works both the first time and for recurring month-end close.
- Open the report tree. In Finvalda WEB this is done from the main menu; in Finance the report tree is reached by a similar route via the program’s top bar.
- Find the warehouse report group and choose the specific list: stock balances, stock balances at a date, movements, write-offs or stocktake.
- Right-click the chosen report and click ‘Preview’ to open the filter window.
- Set the period. Choose a specific date (for balances at a date) or a range (for movement and write-off reports).
- Select one or more warehouses. If the company has several warehouses, you can tick one, several or all of them at once in the filter.
- Specify an item or item group. A direct search works for a specific item code; for broader analysis, the item group filter is the better choice.
- Add objects if needed. Objects let you separate departments, projects or departmental profit centres, if your company uses such a structure.
- Click ‘Confirm’. The report will open in a separate window with the parameters you selected.
- Review the result and, if you need to make adjustments, go back to the filter window without having to work through the whole tree again.
- Save the filter template if you plan to generate the same report regularly, or export the data straight away.
Because the filter window is dynamic, each report ‘adapts’ to its content. The write-off report, for example, includes a field for the reason for the write-off, which the simple stock balance report does not have. Once you grasp this logic, the filter window for a new report no longer raises questions, even if you have never generated it before.
The automatic daily report pack is a separate but related feature. The Finvalda documentation mentions the option of receiving an automatically generated daily pack of business reports, such as sales for the previous day or week. In a warehouse context, this is useful when you want to see stock balances every morning without generating them by hand. Such a pack is worth setting up once; after that it runs without needing constant attention.
Pro tip: before saving a filter template, check that it covers all the warehouses you need. A common mistake is for a user to create a template for one warehouse, then a few months later the company opens a second one, and the old template simply doesn’t see it.
The most commonly used warehouse reports and what they tell you
Each warehouse report in Finvalda answers a different question. Failing to understand the difference is the most common reason management is given inaccurate figures, even though the system itself is working correctly.

Current stock balances show the quantity and value of items at the precise moment the report is opened. This report is best for a quick check before a sale or before approving an order, but it is not suitable for historical comparison, as the data changes every time a new transaction takes place.
Stock balances at a date, by contrast, ‘freeze’ the picture for a chosen day in the past. This report is essential for month-end close, as it lets you compare the state of the warehouse on, say, 31 December with the end of the previous month, even if the quantities in the warehouse are different today.
Stock movement reports show what happened to an item over a given period: purchases from suppliers, sales to customers, transfers between warehouses and write-offs. These reports matter not only for accounting but also for the warehouse manager, as they reveal whether an item is moving as planned or has stalled for some reason.
Write-off reports are tracked separately, as a write-off usually means a financial loss (damaged goods, expired shelf life, a stocktake shortfall). Reviewing the write-off report regularly helps you spot recurring patterns, such as the same item group being written off again and again because of poor storage.
Stocktake reports compare the quantity actually counted during a check with the quantity recorded in the accounting system. Discrepancies here may point either to a physical shortfall or to an error in the documents. Finvalda WEB also includes ageing tracking for current stock balances, which shows how long an item has been sitting in the warehouse without moving; this matters when planning write-offs or promotions to clear old stock.
Exact cost is a report that links a stock balance to a specific purchase document. In the item list, under the ‘In warehouses’ menu, you can see the total quantity and value in euros, and a button lets you view the unit cost by the specific goods receipt document. This is useful when you need to confirm which batch an item was sold from and what its actual purchase price was.
Export formats: when to choose XLS, CSV or XML
Which format you choose should depend on what will happen to the data next, not on personal habit. The Finvalda WEB documentation confirms that reports can be exported to XLS, CSV and XML, but each has its own purpose.
- XLS suits reports that a person will check: an accountant, manager or auditor who needs a formatted sheet with totals, filters and the ability to recalculate subtotals themselves.
- CSV suits data that is going into another system or analytics tool. The format does not keep formatting, so it is easier to process automatically, but less convenient if the data needs to be read by eye.
- XML is useful for structured data where hierarchical fields matter, such as item codes together with Intrastat data or units of measure. This format is most often chosen for integrations with other business systems.
Before exporting, it is worth checking that the filter can actually be reproduced next time. In practice, this means saving the filter template under a name that clearly states its content (for example, ‘Warehouse No. 1, balances at a date, month end’) rather than a generic name you won’t recognise six months later.
Some warehouse reports have additional structured fields that matter for export: item codes, units of measure and Intrastat categories for goods moving between European Union countries. If your company trades internationally, check these fields before exporting so that the statistical return is not incomplete. Handling currency fields correctly is just as important when warehouse transactions involve foreign suppliers, and this practical guide to currency conversion on invoices can help you understand how exchange rates are reflected in accounting records.
Typical errors when generating warehouse reports and how to fix them
Most warehouse report errors in Finvalda are caused not by a system fault but by incorrectly entered opening data or an overly narrow filter.
- Inaccurate opening balances. If an item’s opening balance was entered incorrectly when the system was set up or when migrating from another program, every subsequent report inherits the error. Accounting school materials stress that the accuracy of opening balances is one of the first steps in working with Finvalda, and it is the first thing to check when report figures don’t match expectations.
- An overly narrow warehouse or object filter. If the company has several warehouses or departments but only one is ticked in the filter, the report will look incomplete even though the system is working correctly. The fix: before generating, check that all the warehouses and objects you need are ticked in the filter.
- Unit cost discrepancies. When the total warehouse value doesn’t match expectations, use the ‘Exact cost’ button for the item in question to see which specific purchase document the balance came from. It often turns out that the problem was caused by a single incorrectly entered purchase document rather than a systemic error.
- Incorrect date ranges in stocktakes. Stocktake reports are sensitive to the date range: if the count date does not match the date the document was finalised, the differences between the actual and recorded quantities may look larger than they really are. Before drawing conclusions, check the status of the stocktake document, making sure it has been approved and not just saved as a draft.
Integration with Power BI: how Analitika360 extends Finvalda warehouse reports
The Finvalda report tree is ideal for periodic checks and one-off analysis. But when you need to see warehouse metrics in real time, alongside sales and profit data, standard export is no longer enough, because each time you have to regenerate, download and process the file by hand.
This is where Power BI integration comes in. Analitika360 offers Power BI Analitika Finvalda packages that connect automatically to the Finvalda database and refresh metrics without the need to export an XLS file every time. In such a dashboard, stock balances, sales volumes and unit cost metrics appear on the same screen, and you can filter them by warehouse, item group or period in just a few clicks.
The practical benefits of integration:
- Time savings. Instead of generating and exporting a report every day, the data refreshes automatically in the background.
- Centralised metric tracking. Warehouse data is visible alongside sales and financial metrics in a single dashboard, rather than in separate Excel tabs.
- Fewer manual errors. When data doesn’t pass through several stages of manual copying, there is less chance of a formula shifting to the wrong cell or a file being opened with out-of-date data.
- Historical analysis with no extra work. Power BI dashboards let you compare warehouse metrics across several months or years, something a standard one-off report usually doesn’t cover.
The Analitika360 solution refreshes Finvalda data automatically and delivers visualisations with no further input from the user, which means a dashboard, once configured, runs on its own. The same logic can be applied to the wider question of automation in a business, covered in the article on how to move away from manual Excel reports.
When does it make sense to move from Finvalda exports to direct integration? When reports need to be generated more often than once a week, when you need metrics from several sources at once (for example, warehouse and CRM), or when management wants to see trends, not just a snapshot.
Editor’s note: when Finvalda is enough and when it pays to automate
For a small company with one warehouse and a handful of staff, the standard Finvalda WEB report set is usually sufficient. The report tree, dynamic filters and automatic daily pack do their job without any further investment.
The situation changes as the number of warehouses, item groups or objects grows, or when management wants to see metrics in real time rather than after a manual export. The criteria then become clear: how often the report is needed, how many different sources must be brought together into a single view, and whether the metrics need to update automatically or a periodic check is enough. When the answer to the last question is ‘yes, it needs to be automatic’, integration with Power BI becomes the logical next step, not a luxury.
— Analitika360
How Analitika360 automates Finvalda warehouse reports
Analitika360 is an alternative to exporting Finvalda reports by hand wherever warehouse metrics need to be seen daily, not just at month end. The difference from a standard XLS export is concrete: the data refreshes automatically, and stock balances, unit cost and sales metrics are visible in a single Power BI dashboard rather than in several separate files.
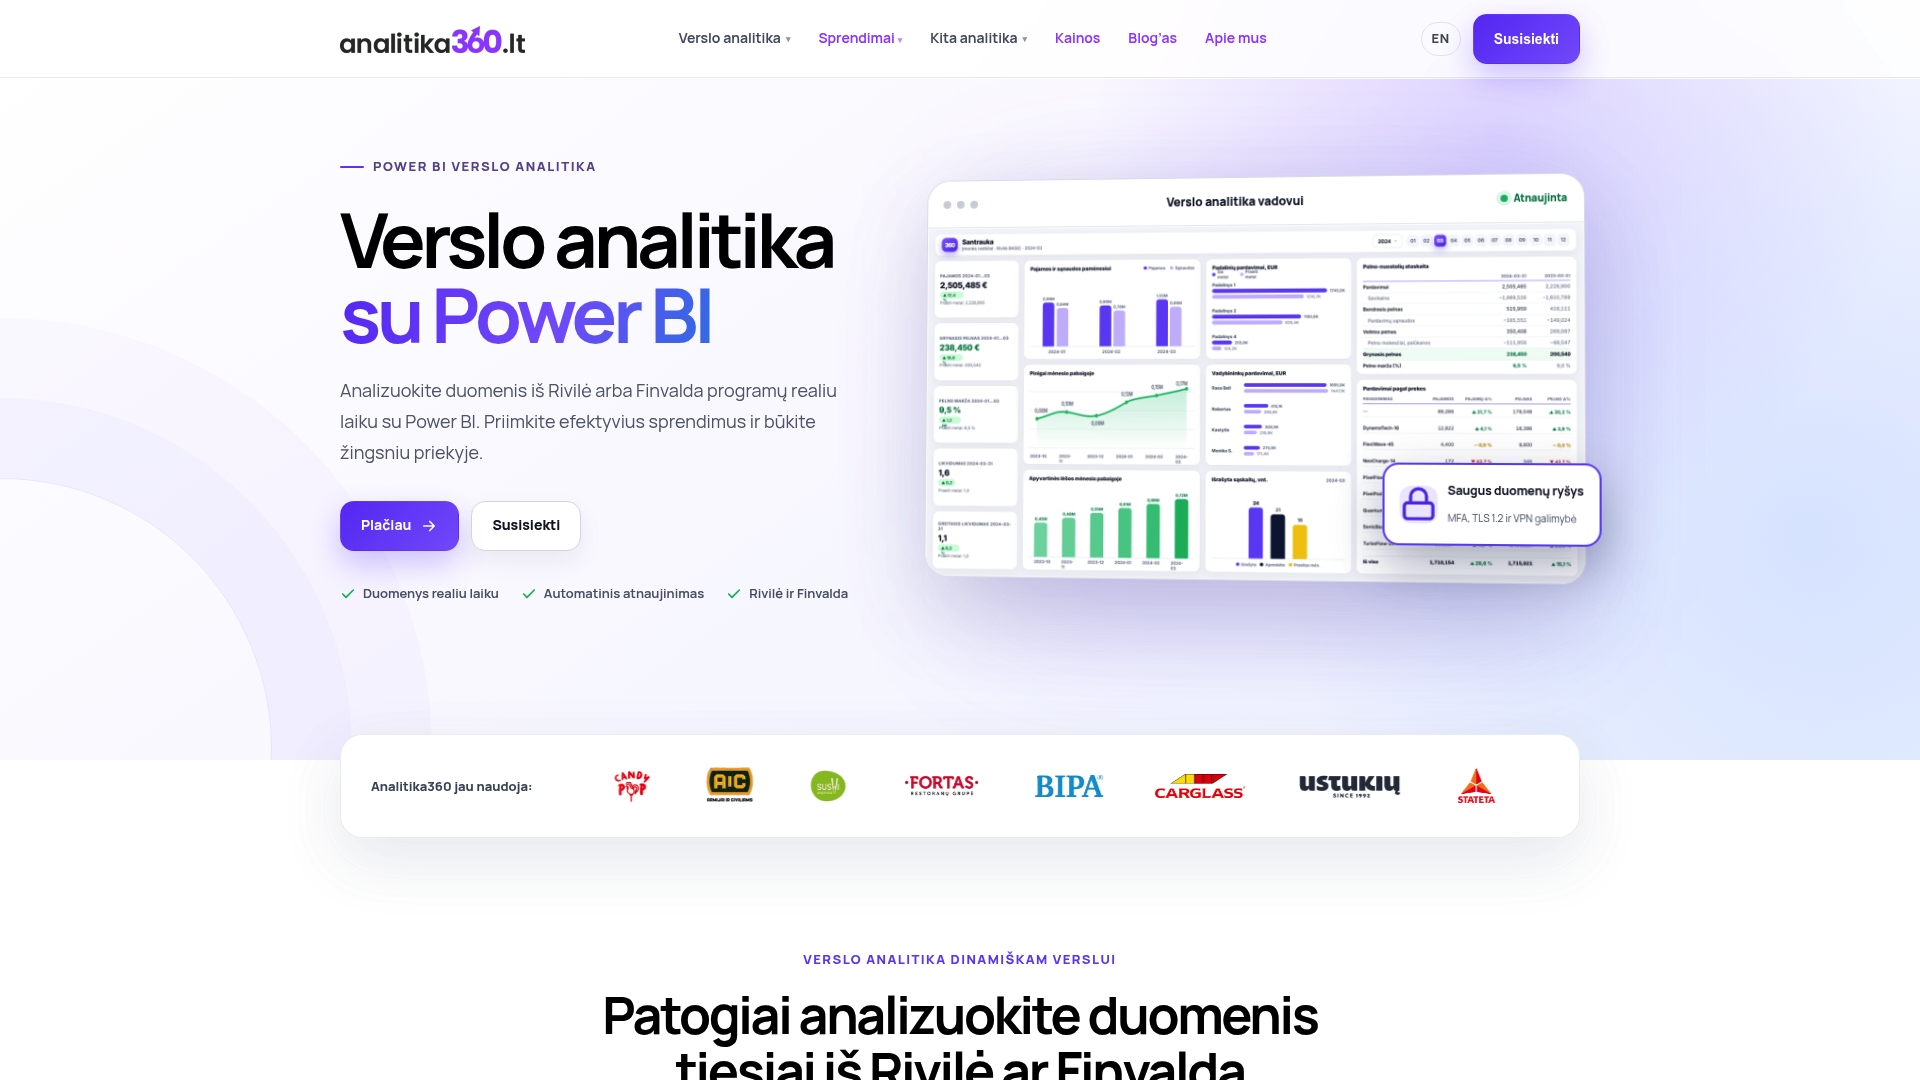
The offering consists of ready-built Power BI Finvalda report packages that can be tailored to different sectors, such as retail and wholesale, logistics or manufacturing. The package integrates with Finvalda and with other sources, such as Excel or a CRM system, if warehouse data needs to be seen alongside sales or customer information. The result: the time spent generating reports every day is saved, and management can see up-to-date figures at any moment.
If you would like to see how this works in practice, take a look at the features of the Power BI Analitika Finvalda package or browse solutions by sector to find the best fit for your company.
Sources
If you want to dig deeper into the technical documentation, start with the Finvalda WEB user guide, which describes how the report tree and filters work in full. The Finvalda WEB product page has the full list of features, and its FAQ section answers the most common practical questions, including those about automatic report packs. The practical steps for opening balances and accounting work are described in the accounting school materials.
Frequently asked questions
Does Finvalda have automatic warehouse reports?
Yes, Finvalda lets you set up an automatically generated daily pack of business reports, which can include stock balances, so you don’t have to run the report by hand every time.
How do Finvalda WEB and Finvalda Finance differ when it comes to warehouse reports?
Both versions use the same report tree principle and filter logic; the only difference is the environment: Finvalda WEB runs in a browser, while Finvalda Finance (PRO) is a desktop application.
What is the best format for exporting a warehouse report for further analysis?
If the data is going into another analytics or BI system, CSV or XML is the best choice, while XLS is more convenient for review by a person.
Why don’t the stock balances in the report match the actual quantity?
The most common cause is inaccurate opening balances or stocktake documents that have not been fully approved, so start by checking the document status and the accuracy of the opening entries.
Can Finvalda warehouse data be linked to Power BI?
Yes, Analitika360 offers ready-built Power BI packages that refresh Finvalda warehouse data automatically and present it alongside sales and unit cost metrics in a single dashboard.
How much does the Analitika360 Power BI solution for Finvalda cost?
Prices depend on whether you choose the Basic or PRO package and on your company’s needs, so you will find the most up-to-date price on the official Power BI Analitika Finvalda page.