Your business in 360°
 Food Cost Analysis: A Step-by-Step Guide for Accountants

To set the unit cost of a product correctly, we calculate the ingredient cost per unit based on actual yield and then add the allocated labour, energy and overhead costs. You need five things for this: an up-to-date recipe, the actual yield after preparation, the latest purchase prices, the labour time spent and inventory balances. Once you have gathered this data, the costing becomes an accurate figure rather than a rough estimate.
In brief:
- Calculate the ingredient cost per unit based on actual yield after preparation, because the raw weight ignores trimming or cooking losses and understates the true cost.
- Check purchase prices, batch yields and labour standards every month, and allocate waste management charges according to the weight actually recorded.
- If an ingredient price rises by 15 % and the selling price stays the same, the margin shrinks; if yield falls from 80 % to 70 %, the unit cost rises.
- Rivilė Basic and Finvalda Basic cost €59 a month each, the PRO version costs €89 a month, and custom work starts at €70 an hour.
Contents
- What makes up the cost of a food product: an overview of direct and indirect costs
- Steps and formulas: calculating unit cost in practice
- Recipe cards and yield: how to record and adjust unit cost accurately
- Waste accounting and HACCP: the role of legislation and waste data in unit cost
- Automation and reporting: how to connect Rivilė and Finvalda to Power BI
- Pricing and profitability models: putting cost findings into practice
- Key indicators and review frequency: what to monitor daily, weekly and monthly
- Editor’s view: the strategic importance of cost analysis
- The Analitika360 solution: how to get started with automated cost analysis
- FAQ
- Sources
What makes up the cost of a food product: an overview of direct and indirect costs
An accurate unit cost is made up of several layers that are worth calculating separately, because each one changes at a different pace. Ingredients account for the largest share, but their price varies with the supplier, the season and the size of the purchase batch. Labour costs are allocated according to the time actually spent on a specific product, not the average hourly rate of an employee across the whole production unit.
On top of these two components, you need to add:
- energy costs, allocated by production line or kitchen area
- packaging materials, which make up a significant share for some products
- fixed costs: rent, insurance, equipment depreciation
- administrative costs, allocated in proportion to turnover or production volume
Waste management and food safety costs are often forgotten, even though they directly affect the final price. Sorting, storage and collection services cost money, and this cost should go into overheads, allocated according to the quantity produced. When this item is left out, profitability figures look better than they really are.
Steps and formulas: calculating unit cost in practice
The calculation becomes reliable when it is done consistently rather than once a year. Below is a sequence of steps you can transfer to an Excel spreadsheet or an automated system.
- Gather the recipe data: the weight or volume of each ingredient per unit of the product.
- Record the actual yield: compare the weight of the ingredient before and after preparation.
- Calculate the ingredient cost per unit: (purchase price ÷ actual yield) × recipe quantity.
- Allocate the labour cost: (hourly wage ÷ 60) × minutes spent per product.
- Add energy and packaging costs using the average rate per unit.
- Allocate fixed and administrative costs in proportion to monthly production volume.
- Add all the parts together and compare the result with the selling price to get the margin percentage.
The formula looks simple, but the result only reflects reality accurately when purchase prices and yield data are updated regularly, not once a year.
Pro tip: enter every new supplier price into the recipe card straight away, so that unit cost is never calculated from outdated data.
The checkpoints worth reviewing every month include changes in purchase prices, variations in actual yield between batches and whether labour standards still match new recipes. When these three things are checked regularly, unit cost can no longer drift far from reality.
Recipe cards and yield: how to record and adjust unit cost accurately
Yield shows how much finished product you get from the purchased ingredient after trimming, cooking or other preparation.
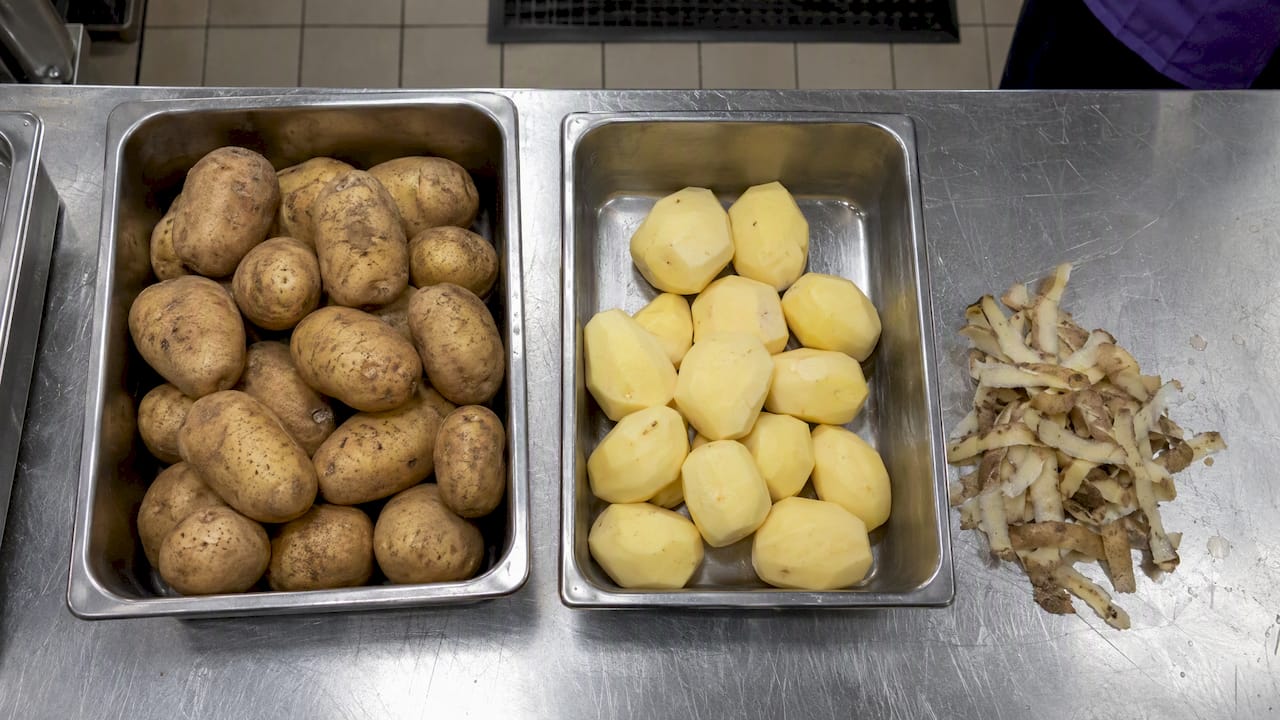
The adjusted ingredient cost per unit is calculated by dividing the purchase price by the actual yield percentage, not by the original quantity. This explains why two identical ingredients can have different costs in different recipes if their preparation losses differ.
A recipe card should record:
- the raw weight of the ingredient before preparation
- the final weight after preparation and the calculated yield percentage
- the date the yield was last checked
- the supplier, because different batches may give different yields
Waste accounting and HACCP: the role of legislation and waste data in unit cost
Regulation (EC) No 852/2004 requires food business operators to apply HACCP principles and maintain traceability, and this requirement indirectly improves the quality of cost data as well: when ingredient flows are recorded properly, the calculations become more reliable.
Waste transfer documents and records in GPAIS, Lithuania’s national product and waste information system, are not merely a legal formality. They provide specific weight data that can be assigned directly to product cost: if one batch of an ingredient produces more waste than another, the waste management cost should increase the cost of that batch accordingly.
In practice, this means:
- recording waste transfer notes with weights by product group
- allocating the cost of the waste management service in proportion to the quantity generated
- checking HACCP documentation against purchasing and production logs every month
Measuring food waste is becoming an EU priority: the EFSA and HaDEA call to support food waste measurement and prevention in 2026–2027 shows that waste accounting will receive more attention and funding in the near future, so businesses would do well to build this area into their costing process in advance.
Automation and reporting: how to connect Rivilė and Finvalda to Power BI
Calculating unit cost manually in Excel spreadsheets works for a small product range, but loses accuracy as the number of recipes and suppliers grows. Official statistics show that food prices have fluctuated significantly in recent years, so a static spreadsheet that is rarely updated quickly stops reflecting the true position.
By connecting accounting software to Power BI solutions, cost calculation moves from a one-off Excel file to a continuously refreshing model. The implementation steps usually look like this:
- Purchasing, warehouse and sales data from the accounting systems are combined into a single model.
- Recipe and labour time data are added from Excel or SharePoint if they are kept separately.
- An automatic refresh schedule is set up so that reports update without any extra work from users.
- Margin and cost dashboards are built that the accountant or manager can access in real time.
Pro tip: roll out the integration in stages, connecting purchasing and warehouse data first and adding the recipe model only once the main sources have been verified.
Clients who already use Rivilė for bookkeeping can draw on a similar experience described in the Rivilė debt management example, where automated solutions saved hours of manual work every week. Data quality remains the most important factor: if purchase prices or recipes are entered inaccurately, even an automated report will show the wrong margin.
Pricing and profitability models: putting cost findings into practice
Unit cost on its own does not tell you what price to charge, but it becomes the basis for pricing decisions.
Scenario testing lets you see how pricing responds to changes before they happen:
- a 15 % jump in an ingredient price shows how much the margin falls if the selling price is left unchanged
- a drop in yield from 80 % to 70 % increases the unit cost and calls for either a price adjustment or a process improvement
- a seasonal change in a supplier’s price may require a temporary buffer margin in menu pricing
Tracking two key indicators, gross margin percentage and contribution margin per product, helps you see quickly which dishes actually make a profit and which merely take up space on the menu.
Key indicators and review frequency: what to monitor daily, weekly and monthly
Cost analysis only pays off when the indicators are reviewed regularly, not once at the end of the year.
- Daily: ingredient usage and inventory balances for key items.
- Weekly: actual yield for key recipes and deviations from the standard.
- Monthly: product profitability, overall margin and changes in purchase prices by supplier.
- Ongoing: alert thresholds that flag automatically when the margin falls below a set level.
Automatic alerts about deviations let you respond within days, not months, by which time the error has already shown up in the financial results.
Editor’s view: the strategic importance of cost analysis
Many food service businesses calculate unit cost only to update their price list, which is the least of its value. Ongoing analysis reveals which dishes genuinely make a profit and lets you adjust the menu before losing money. Small kitchens should start with their three or four most popular dishes rather than trying to cost the entire menu at once. Automated data sources save time and reduce the risk of human error that manual retyping in Excel inevitably brings.
— Analitika360
The Analitika360 solution: how to get started with automated cost analysis
We offer ready-built Power BI report packages that connect to accounting systems and automatically refresh purchasing, warehouse and sales data with no manual transfer. This means cost and margin dashboards can run continuously, not just when the accountant finds time to update them.
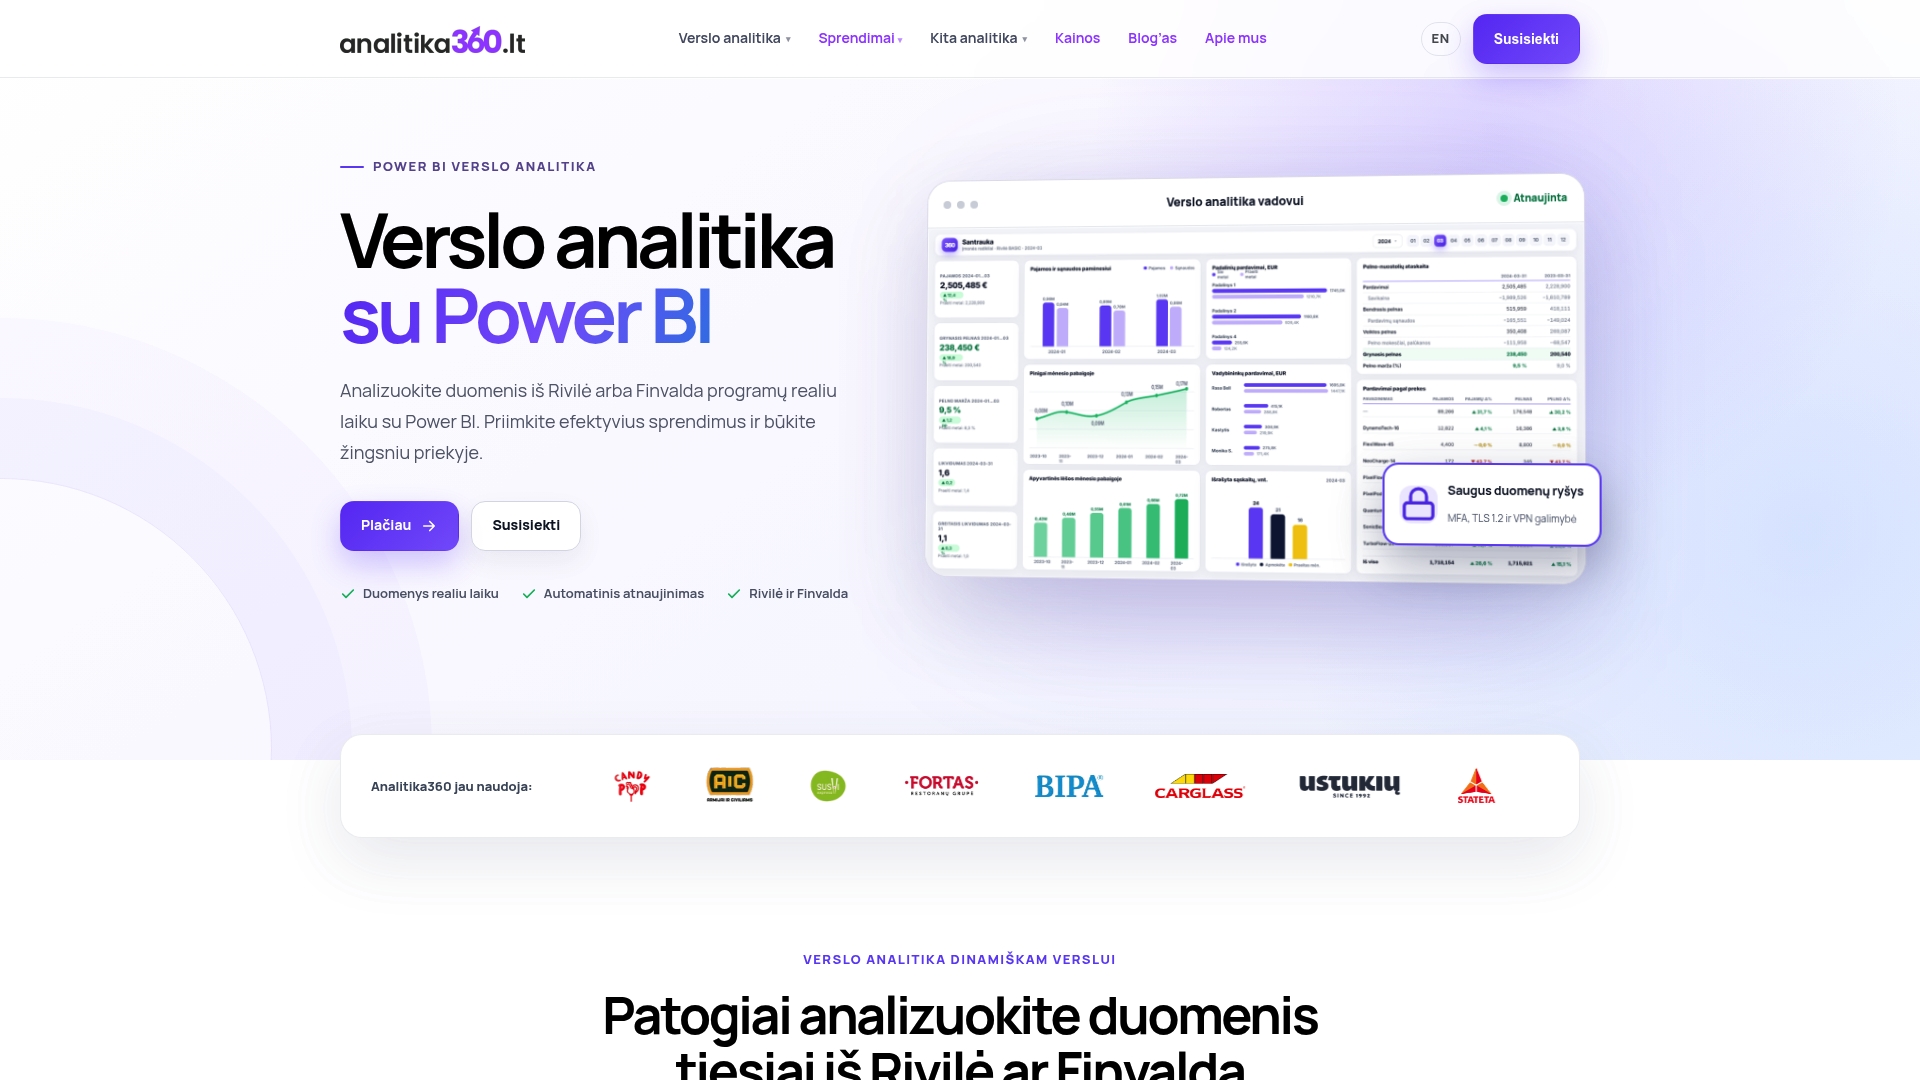
Users get:
- real-time monitoring of margin and unit cost by product group
- custom solutions when the standard package does not fit specific processes
- the option to start with a smaller package and scale up as needed
Take a look at the Rivilė Basic package or explore the Finvalda PRO solution if your business uses Finvalda. Custom projects are priced from €70 an hour; see the pricing page.
FAQ
How do you calculate the cost of a food product in brief?
Unit cost is the sum of the adjusted ingredient cost (based on actual yield), the labour cost per unit, energy and packaging costs, and a proportional share of fixed costs. Each component is worth calculating separately so that it is easy to spot later which one has changed.
What is actual yield and why does it matter?
Actual yield shows how much finished product you really get from the purchased ingredient after preparation, such as trimming or cooking. It matters because using the raw weight without adjustment systematically understates unit cost and makes the margin look higher than it really is.
Which legislation governs food safety and traceability documentation?
Regulation (EC) No 852/2004 sets out the obligations for food business operators to apply HACCP principles and ensure traceability. These requirements indirectly improve the accuracy and reliability of the data used to calculate unit cost.
How does waste accounting affect cost calculation?
Waste transfer documents and weight data let you assign the waste management cost to a specific product batch rather than to an average across all production. When this cost is allocated in proportion to the quantity of waste generated, unit cost becomes more accurate rather than a rough estimate.
How much does automated cost and margin analysis cost?
The Rivilė Basic and Finvalda Basic packages for Power BI reports cost €59 a month each, while PRO versions such as Finvalda PRO cost €89 a month. Custom projects are priced from €70 an hour depending on specific requirements.
Sources
- Consolidated text: 32004R0852 — Regulation (EC) No 852/2004
- Prices – Official Statistics Portal
- Funding call: EU support to Stakeholders to improve measurement of food waste and help implement food waste prevention in their operations and organisation - EFSA