
Mobile reports: how Rivilė and Finvalda users put them in place

Yes, you can have Power BI reports designed for mobile devices, connected to Rivilė or Finvalda and refreshing automatically. A manager will see revenue, expenses, profit and stock levels in real time on a phone or tablet, without having to do anything themselves. The technical basis is simple: data can refresh up to 48 times a day, depending on the package chosen and the needs of the business.
In brief:
- Mobile reports come with automatic data refresh of up to 48 times a day, depending on the package and the needs of the business.
- For a successful rollout, it is important to define which KPIs appear on the first screen and to limit them to between three and six, so the manager can understand them at once.
- Integration with Rivilė or Finvalda is done through an API and a gateway, and errors often stem from incorrect configuration or a mismatched refresh schedule.
- The mobile screen design must be simple, clear and focused on specific KPIs, avoiding extra detail that will not fit on a small screen.
- A project usually takes 4–16 weeks, and prices start from €300 a month, depending on the complexity of the integration and the solution chosen.
Contents
- Which KPIs to show on the mobile screen
- How to integrate Rivilė or Finvalda with Power BI in mobile reports
- How to design a mobile screen so the report works
- How to protect data when the report is accessed from a phone
- How much a mobile report rollout costs and how long it takes
- When to choose a ready-made solution and when a bespoke project
- Editorial view: where most companies overrate the technology and underrate decision design
- Analitika360: ready-made mobile reports for Rivilė and Finvalda users
- Sources
- Frequently asked questions
Which KPIs to show on the mobile screen
A mobile screen has no tolerance for cluttered tables. A manager looking at a report between two meetings needs to see within five seconds whether the business is doing well or whether it is time to ring the accountant.
Financial indicators form the foundation:
- Revenue and expenses by department or product group
- Profit (gross and net), the profit and loss statement (P&L)
- Balance sheet summary: assets, liabilities, equity
Operational indicators complete the picture at a day-to-day level:
- Daily sales compared with the previous period
- Stock levels and shortage alerts
- Overdue payments and receivables
Visualisation matters as much as the figure itself. KPI cards with colour coding (green, amber, red) let you spot a deviation from plan instantly. Simple filters, such as choosing the period or department with a single button, and a drill-down function that takes you from a headline figure down to a specific transaction, are what separate a useful report from a decorative one.
Pro tip: Do not cram every KPI onto one screen. Limit the first page to 3–6 key indicators and leave more detailed analysis for a second or third layer with drill-through. A manager who needs 15 figures at a glance will not get a single clear answer.

How to integrate Rivilė or Finvalda with Power BI in mobile reports
The technical integration rests on three layers: the data source, the connection and the Power BI model. Rivilė and Finvalda both offer API access, through which data is extracted automatically, with no manual export to Excel.
A practical plan for the rollout looks like this:
- Checking the data source. Establish which modules (sales, warehouse, accounting) need to be connected.
- Activating API or web service access. The Finvalda web service documentation describes specific methods, such as queries for customers, products and sales over a period.
- Setting up the gateway. A gateway sits between the local database and the Power BI cloud, encrypting data transfer and maintaining the connection without constant file exports.
- Setting the refresh cycle. The frequency is matched to the rhythm of the business, not the other way round.
- Testing before go-live. Check that the figures match the source system across several different days.
The gateway is the critical point where problems most often arise. A misconfigured gateway leads to stale data or a complete breakdown in synchronisation, and the manager only notices when the figures no longer reflect reality.
The most common mistakes that implementation teams run into:
- Refresh times coincide with the business’s peak hours, so the query ‘hangs’
- Incorrect API keys or outdated login credentials after a system update
- Different time zone settings between the source and the Power BI cloud
Retail may need hourly refreshes during the working day, while budget management reports are fine with 2–4 refreshes a day. The frequency is set by the business cycle, not by what is technically possible.
How to design a mobile screen so the report works
Mobile design is not simply a shrunken desktop version. It follows its own principle: one screen, one task. If a manager opens the report to see daily sales, the screen must show daily sales, not ten other charts around them.
Practical rules that work in real rollouts:
- Cards and KPI blocks, not dense tables with dozens of rows
- Dynamic font scaling that adapts to phone and tablet screen sizes
- Clear filter buttons at the top, not menus hidden several levels deep
- Drill-through for one specific action, for example from the total sales figure to a particular customer’s invoice
Experts note that mobile reports should be clear and focused on KPIs rather than detailed tabular analysis, which is better suited to the desktop version. This is not a matter of style but a functional requirement: a phone screen simply cannot fit a granular dataset.
Pro tip: Test the report on both iOS and Android devices, on screens of different sizes and in an offline scenario. Power Apps mobile experience settings differ from the desktop version, and a card that looks neat on a monitor can become unreadable on a phone.
How to protect data when the report is accessed from a phone
Mobility creates a new security risk: a report that can be reached from any device can end up in the wrong hands. The answer is not to give up on mobility but to configure access boundaries correctly.
Row-level security (RLS) lets each user see only the data assigned to their department or role. A branch manager sees their branch’s figures; the chief executive sees all of them.
Microsoft Purview DLP policies can respond automatically to the movement of sensitive data in Power BI reports.
Microsoft Purview DLP policies act as an additional layer of protection: the system can send an alert to the administrator, show the user a policy notification or, in test mode, restrict access to a specific dataset.
Before widening a report’s visibility beyond a small circle of managers, the IT and finance teams should check:
- Exactly who has access to each KPI layer
- Whether RLS rules have been updated after organisational changes
- Whether audit logs record who viewed the report and when
- Whether the DLP policy covers newly added data sources
A regular security review, carried out at least once a quarter, prevents access rights from ‘freezing’ in the shape of an old organisational structure.
How much a mobile report rollout costs and how long it takes
A rollout project has a predictable structure, whether we are talking about Rivilė or Finvalda:
- Analysis and defining requirements — which KPIs, which sources, which user group
- Data preparation — API access, gateway configuration, data cleansing
- Modelling — building the Power BI data model and the relationships between tables
- Report building — designing the mobile and desktop views
- Testing — checking the figures and verifying mobile performance
- Go-live and training — training users and setting the terms of support
For a small company, the whole process takes roughly 4–8 weeks. A medium-sized company with several data sources and a more complex integration needs 8–16 weeks.
Market price benchmarks suggest that a ready-made report package costs from around €300 + VAT a month, and a Power BI Pro licence from about €10 + VAT a month per user. These figures are indicative, not a fixed standard for the whole market, and each supplier may apply them differently depending on the scope of the package.
The contract should cover the scope of support, response times and rates for further changes after go-live. Over the longer term, these often shape overall satisfaction with the solution more than the initial implementation cost itself.
When to choose a ready-made solution and when a bespoke project
A common mistake: a company simply tries to move a paper or Excel report onto a mobile screen without reworking it. The result is a cluttered view that nobody opens any more after the second week.
Value comes not from copying the old format but from redefining what the manager really needs to see on the first layer of the screen. Analitika360 solutions integrate with Rivilė and Finvalda, automate refreshes without any user intervention and offer models tailored to specific sectors, such as restaurant chains or logistics companies. When choosing a supplier, look not only at the initial price but also at the support package: can the solution grow with the business when a new data source or department is added?
Editorial view: where most companies overrate the technology and underrate decision design
The market is dominated by the mistaken belief that mobile reports are a question of technology rather than decision design. The truth is the reverse: API access and gateway configuration are a solvable task that any competent partner can complete in a few weeks. The harder part is deciding which three KPIs the manager really must see on the first screen and which seven to leave for the second layer.
Companies that invest the most time in the KPI selection stage go on to change the report structure the least. Those that skip it order a rework six months later, because the indicators do not reflect how decisions are actually made. The priority should be clear: first define what decision the manager makes on their phone while standing on the factory floor or in the restaurant dining room, and only then choose the technical architecture to get there.
— Analitika360
Analitika360: ready-made mobile reports for Rivilė and Finvalda users
There is an alternative to rolling out Power BI yourself, which often takes months of setting up API connections from scratch. Ready-made report sets for Rivilė and Finvalda users can come with the integration already configured, automatic data refresh and a KPI structure designed for the mobile screen, so the rollout time is shortened rather than stretched out by further fine-tuning.
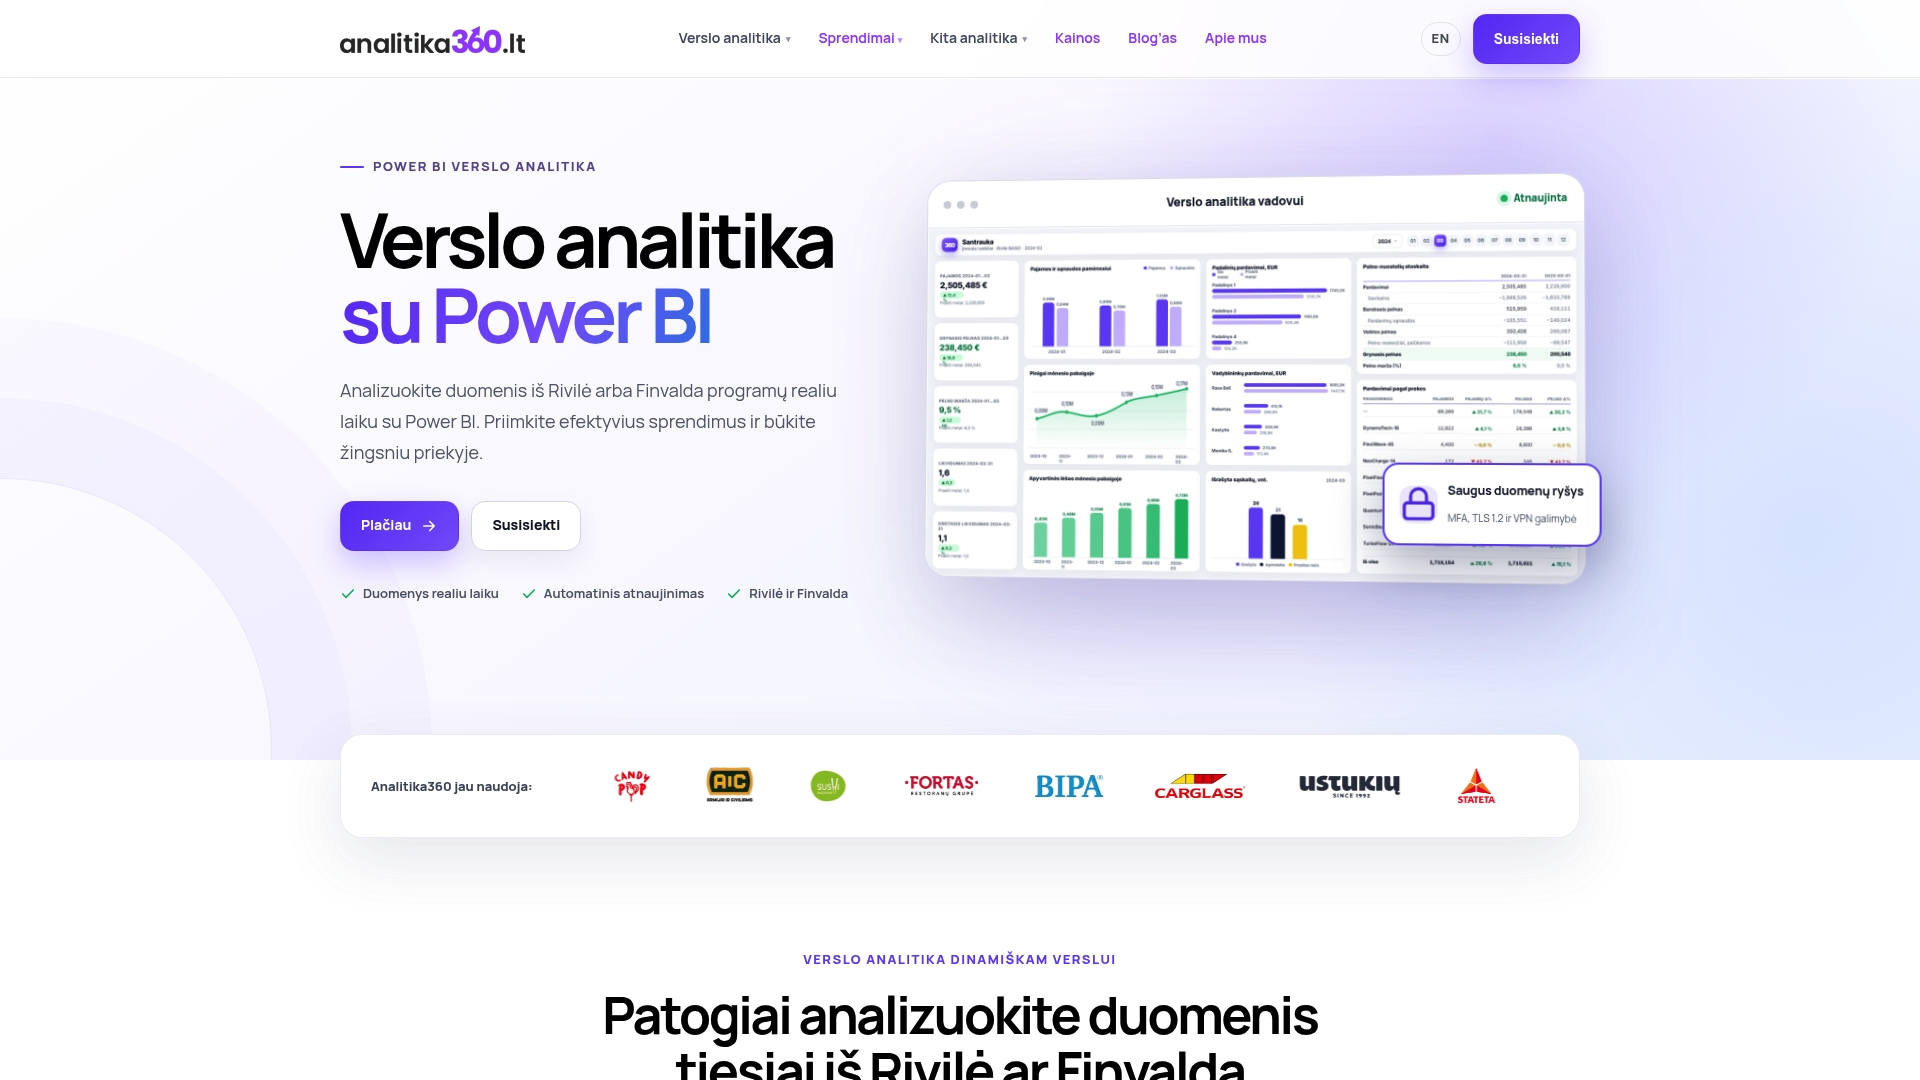
If you use Rivilė, the Rivilė Basic package provides a ready-made set of financial and operational indicators with no additional programming. For Finvalda users, the Finvalda Basic solution follows the same automation logic. For companies that need more complex integration with several sources, prices for bespoke projects and PRO plans are listed on the pricing page. Contact Analitika360 and arrange a demo to see how your data would look on a mobile screen within days, not months.
Frequently asked questions
What are mobile reports in a business context?
Mobile reports are Power BI reports adapted to a phone or tablet screen and automatically synchronised with the accounting system, such as Rivilė or Finvalda. They show the same KPIs as the desktop version, only rearranged for a smaller screen and quick reading.
How often does the data in mobile reports refresh?
The refresh frequency depends on the package and the needs of the business, and technically refreshes can run up to 48 times a day. An hourly cycle often suits retail, while a few refreshes a day are enough for budget management.
How much does it cost to roll out mobile Power BI reports?
Analitika360’s Rivilė Basic and Finvalda Basic packages cost €59 a month, while PRO plans such as Finvalda PRO cost €89 a month. Bespoke projects are charged at €70 an hour, and market benchmarks suggest that similar packages elsewhere start from around €300 + VAT a month.
Are mobile reports safe to use with financial data?
Yes, provided row-level security (RLS) is in place and a Microsoft Purview DLP policy is applied to restrict access to sensitive data. Without these measures, mobile access from any device carries additional risk, which must be managed before the circle of users is widened.
How long does it take to integrate mobile reports with Rivilė or Finvalda?
For a small company, the rollout takes about 4–8 weeks; for a medium-sized company with a more complex integration, up to 16 weeks. The timescale depends on the number of data sources and how complex the gateway configuration is.