Your business in 360°
Power BI implementation stages: from preparation to working reports

Power BI is usually rolled out in a company in seven stages. First you agree on objectives and metrics, then you take stock of your data sources and connect them, clean up the data with Power Query, build a semantic model, and create and check the reports. Finally, the reports are published to the Power BI Service with automatic refresh, and the solution is maintained and extended. Below we describe what to do at each stage, who is responsible for it and how to put together an implementation plan (a roadmap) so that the first reports are useful to both management and the accounts team.
In brief
- Before any technical work, you need management backing, a business case, an initial governance model and a list of existing reports and data sources.
- The technical sequence is: getting data, transforming it, modelling, building reports, publishing and distribution.
- On-premises data sources need a data gateway, and the number of refreshes per day depends on your licence.
- The implementation plan is iterative: you start with a handful of key metrics and expand in stages.
- Rivilė and Finvalda users can shorten many of these stages by choosing ready-built report packages.
Contents
- Preparation: what to sort out before you start
- The seven stages of a Power BI implementation
- How to draw up a Power BI implementation plan
- Our view
- Ready-built packages for Rivilė and Finvalda users
- FAQ
- Sources
Preparation: what to sort out before you start
The most common reason an implementation fails is not the technology but unclear objectives. Before implementation, Microsoft recommends that you secure executive sponsorship, assess the business case and costs, prepare an initial governance model, define a security and data privacy strategy, and take inventory of your existing reports and data sources.
In practice, this comes down to four questions that are worth answering in writing:
- Who is the sponsor? The managing director or finance director who prioritises the metrics and makes the decisions.
- What decisions should the reports support? For example, weekly profit control for a restaurant, monitoring outstanding debts or managing stock levels.
- Where is the data today? The accounting system, Excel files, SharePoint, a CRM, a logistics system.
- Who will see what? Senior management, department heads, the accounts team, external consultants.
We covered governance rules (who builds, who approves, who publishes) in our article on Power BI roles and data security.
The seven stages of a Power BI implementation
The technical part follows the path from raw data to a shared Power BI app described by Microsoft: data is loaded and transformed with Power Query, a semantic model and a report are built, and the report is published to a workspace and distributed as an app. To this sequence we add an opening and a closing stage, which are what determine success within a company.
| Stage | What you do | Outcome |
|---|---|---|
| 1. Objectives and metrics | Agree on KPIs and their definitions | A list of metrics with formulas |
| 2. Connecting sources | Take stock of sources and connect them | Working connections, a gateway |
| 3. Transformation | Clean and standardise the data | Clean tables |
| 4. Modelling | Create relationships and calculations | A semantic model |
| 5. Reports | Build visualisations, check the figures | Approved reports |
| 6. Publishing | Publish, grant access, set up refresh | Automatically refreshing reports |
| 7. Maintenance and development | Monitor, train, expand | Growing usage |
1. Objectives and metrics
Write down a single definition for each metric. Is “revenue” with or without VAT? By invoice date or payment date? Are credit notes included? When the definitions are agreed in advance, you don’t have to work out later why the figures in Power BI and the accounting system differ.
2. Data source inventory and connection
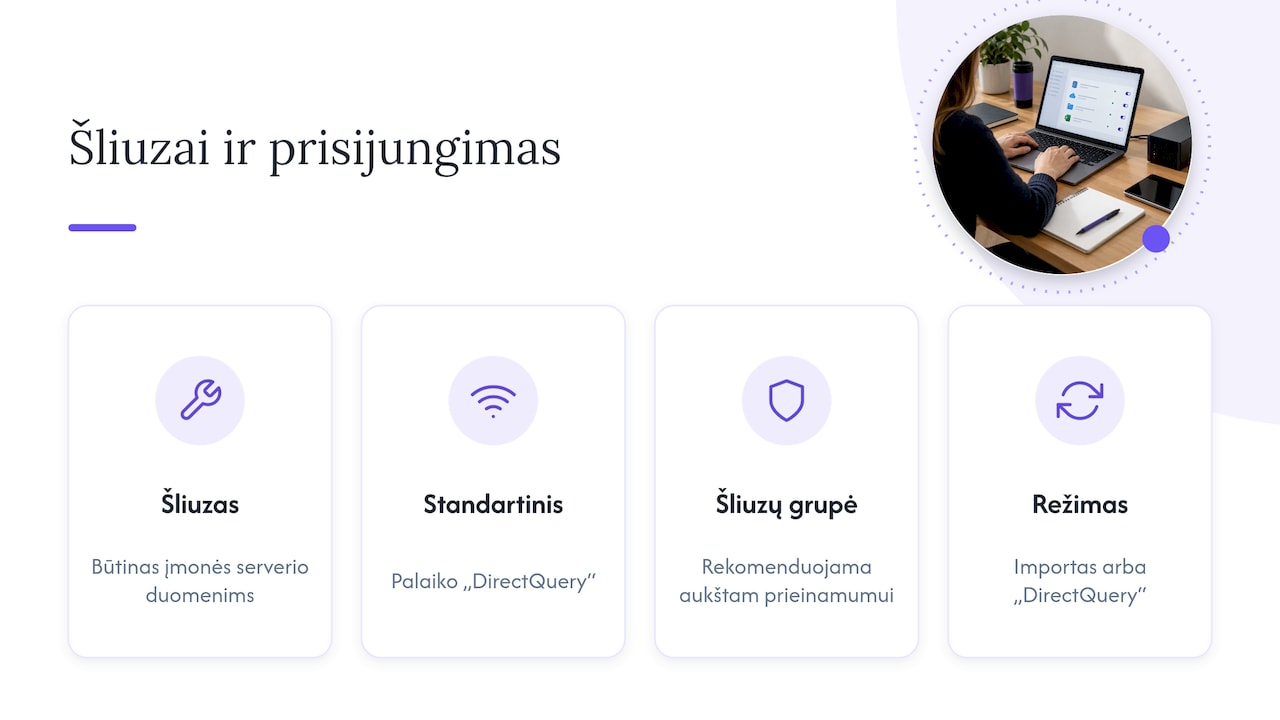
Data is connected in Power BI Desktop via Get Data and the relevant connectors. If the data sits on a company server, you need a data gateway. In most cases Microsoft advises using the standard gateway: it can be shared, it supports DirectQuery and it allows connections to be managed centrally, while a gateway cluster is recommended for high availability. You can find out how the gateway works in our guide to installing the Power BI data gateway.
This is also the stage at which you choose the connection mode. We discussed when to opt for import and when for a direct query in our article DirectQuery or import.
3. Data transformation
In Power Query, duplicates are removed, date formats and product and customer codes are standardised, and tables from different systems are merged. A restaurant chain, for example, often needs to combine costs from the accounting system with a list of outlets kept in an Excel file. Check that the row counts and totals match the source: it is the cheapest quality test there is.
4. The semantic model
The model is the foundation of the solution: it defines the relationships between tables (sales, customers, products, calendar) and the calculations. Microsoft stresses that the report is built on a reusable semantic model, which is why data types and relationships are checked. A well-designed model lets you add new reports later without rebuilding it.
5. Building and checking reports
A financial report must match the accounts to the cent. We recommend three steps for sign-off:
- Compare monthly revenue, cost and profit totals against the reports in the accounting system.
- Spot-check a few customers and products at a detailed level.
- Let an end user, such as an accountant, review the report and flag anything unclear.
For ongoing control, a data quality monitoring checklist is useful.
6. Publishing, access and refresh
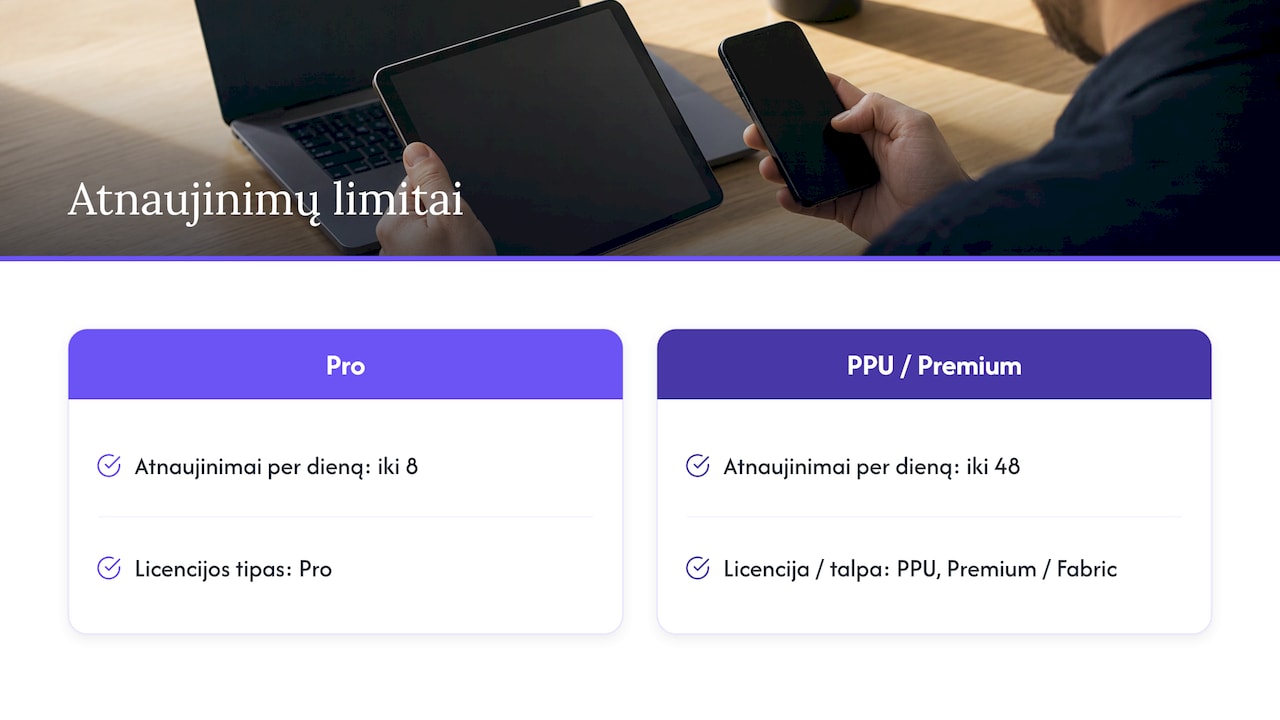
Reports are published to a workspace in the Power BI Service, and for a wider audience the most convenient way to distribute them is as an app. This is where scheduled refresh is set up: according to Microsoft, a Pro licence allows up to 8 scheduled refreshes a day, while Premium Per User or Premium / Fabric capacity allows up to 48. You will find more on the settings in our article on Power BI scheduled refresh limits, and on ways of granting access in our guide to sharing data in Power BI.
7. Maintenance and development
A working solution needs looking after. Microsoft recommends restricting who can install and manage gateways, keeping the gateway software up to date, and monitoring its performance and logs. Planning should also include training for consumers, data modellers, report creators and administrators.
How to draw up a Power BI implementation plan
An implementation plan (roadmap) answers the question of what will be rolled out, by whom, when and in what order. In its Power BI implementation planning series, Microsoft emphasises that planning is iterative: decisions are refined as the organisation gains experience. For a small or medium-sized company, the following three-wave plan works well:
- First wave: the financial foundation. Revenue, costs, profit, debts. These are the metrics management asks for every month.
- Second wave: operational metrics. Sales by customer and product, inventory, comparison between departments, budget versus actual analysis.
- Third wave: additional sources and forecasts. CRM, logistics data, SharePoint lists, sales forecasts.
Set a measure of success for each wave. Microsoft suggests, for example, tracking growth in the number of report consumers and the proportion of reports moved into production by the target date. A simple rule of thumb: a wave is complete when the reports refresh automatically and management uses them in meetings instead of Excel spreadsheets.
Once the foundation is in place, our guides to budget comparison in Power BI and sales forecasting with Power BI are a good next step.
Our view
Working with Rivilė and Finvalda users, we see that most of the time in an implementation is eaten up not by visualisations but by connecting the data, transforming it and building the model. These are exactly the stages our ready-built report sets are designed for: they are built for specific accounting systems, so a company doesn’t have to start from a blank page.
The second important point is automatic refresh. A report that has to be refreshed by hand every week eventually stops being used. In our solutions the data refreshes without any extra work from the user, and we combine different sources, such as Excel, SharePoint or a CRM, into a single Power BI model.
Where a company’s processes are non-standard, we tailor the solution to its processes and existing IT systems. That way the managing director, finance director or accountant gets the first reliable reports sooner and can stay a step ahead.
Analitika360
Ready-built packages for Rivilė and Finvalda users
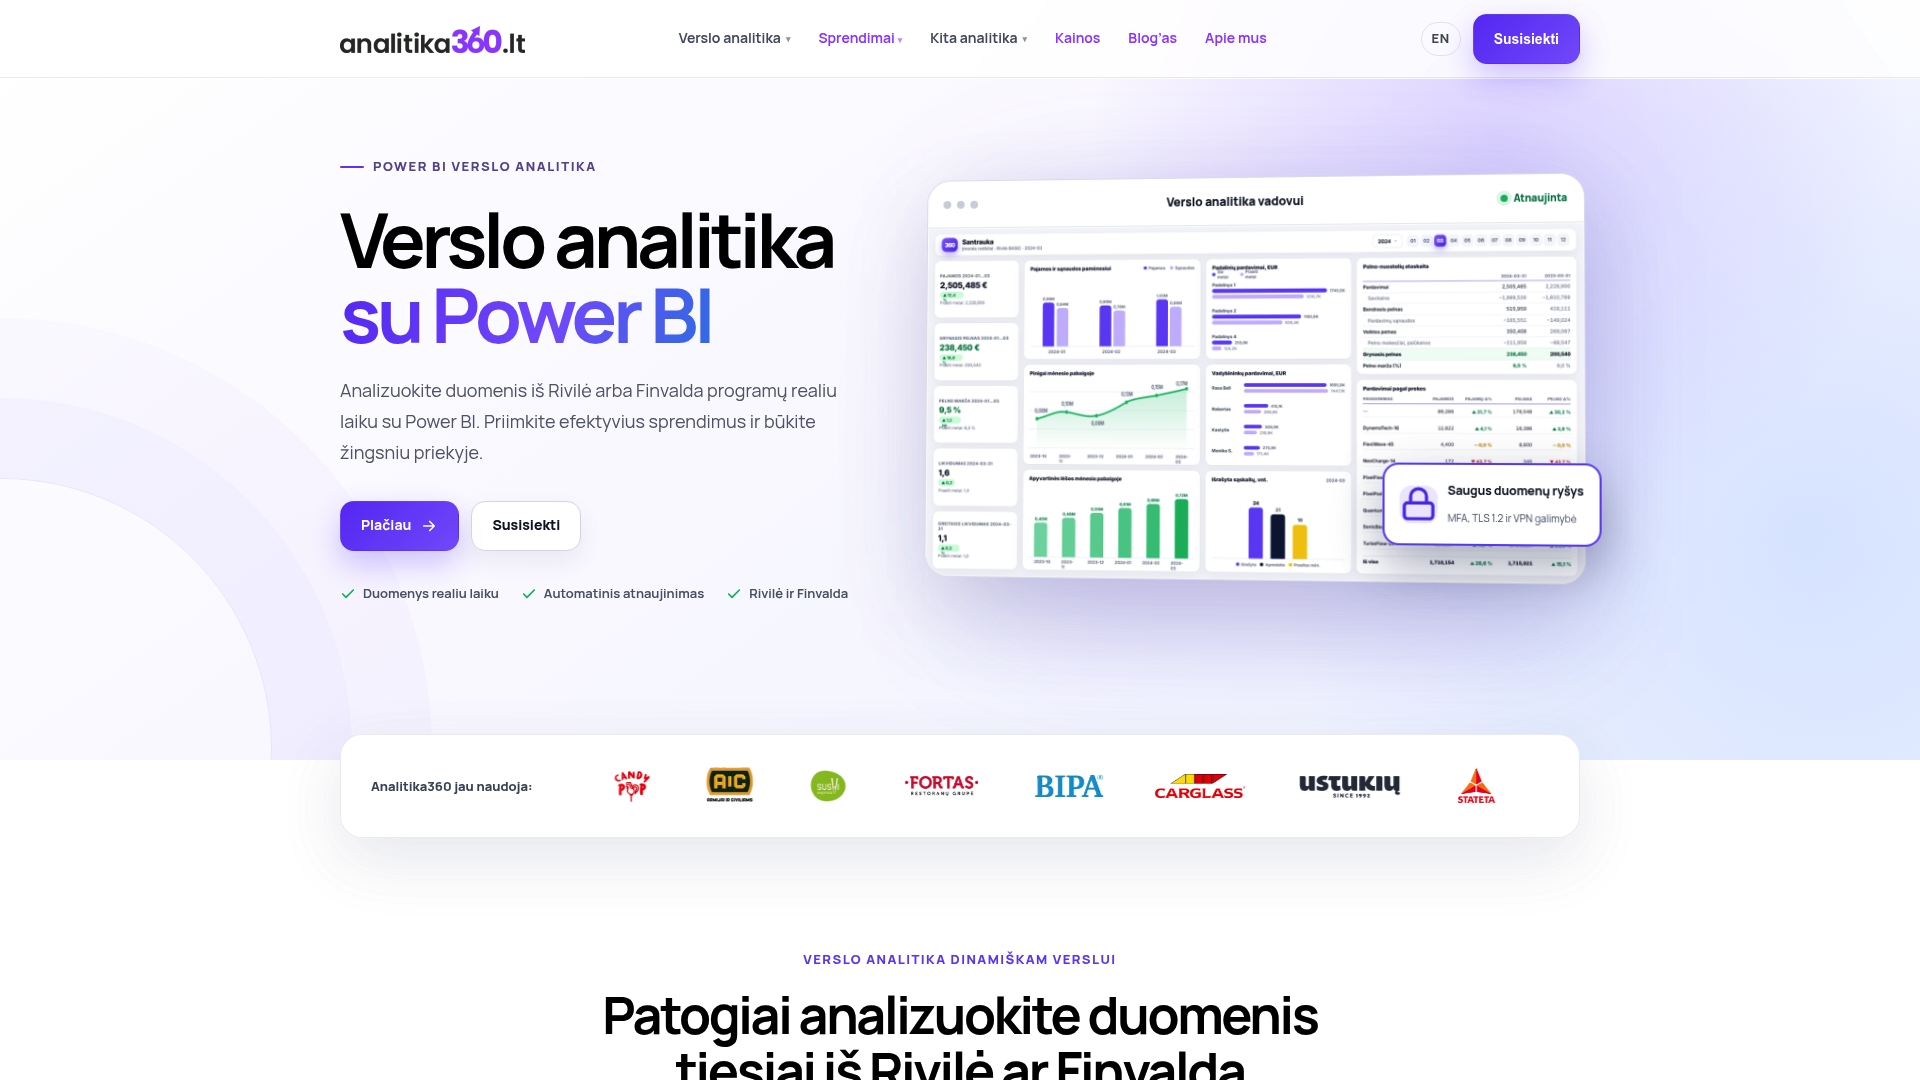
If your accounts are kept in Rivilė or Finvalda, Analitika360 packages cover most of the stages described above: data connection, the model, the reports and automatic refresh. You will be able to track revenue, costs, profit, the balance sheet, sales, inventory and debts.
| Package | Price |
|---|---|
| Rivilė Basic | €59 a month |
| Rivilė PRO | €89 a month |
| Finvalda Basic | €59 a month |
| Finvalda PRO | €89 a month |
| Bespoke projects | €70 an hour |
We can also help you purchase Microsoft Pro and Premium licences. You will find the full terms on our business analytics pricing page, and the differences between the packages in our overview reports without manual work.
FAQ
Where should a Power BI implementation start?
With a list of objectives and metrics, not with the software. Secure management backing, list your existing reports and data sources, and decide who will see what. Only then is it worth connecting the data.
Do I need a data gateway?
You need one when the data is stored on a company server or computer and the reports have to refresh in the Power BI Service. In most cases a standard gateway is used, which can be shared and managed centrally.
How many times a day do reports refresh?
That depends on your licence. With a Pro licence you can schedule up to 8 refreshes a day; with Premium Per User or Premium / Fabric capacity, up to 48.
Can Power BI combine Rivilė and Excel data?
Yes. Accounting data and Excel files are combined in a single semantic model. You will find a practical example in our article on combining Rivilė, Excel and Power BI.
Who should be involved in the implementation project?
The business sponsor (the managing director or finance director), someone who knows the accounting data well, usually an accountant, and a report developer or implementation partner. You should also appoint an administrator to look after access and refreshes.
Sources
- Prepare to migrate to Power BI, Microsoft Learn
- End-to-end: From raw data to a shared Power BI app, Microsoft Learn
- Power BI implementation planning: Data gateways, Microsoft Learn
- Configure scheduled refresh, Microsoft Learn
- Power BI implementation planning, Microsoft Learn