See more. Decide better.
 Product movement analysis: which products earn money and which are just sitting on the shelf
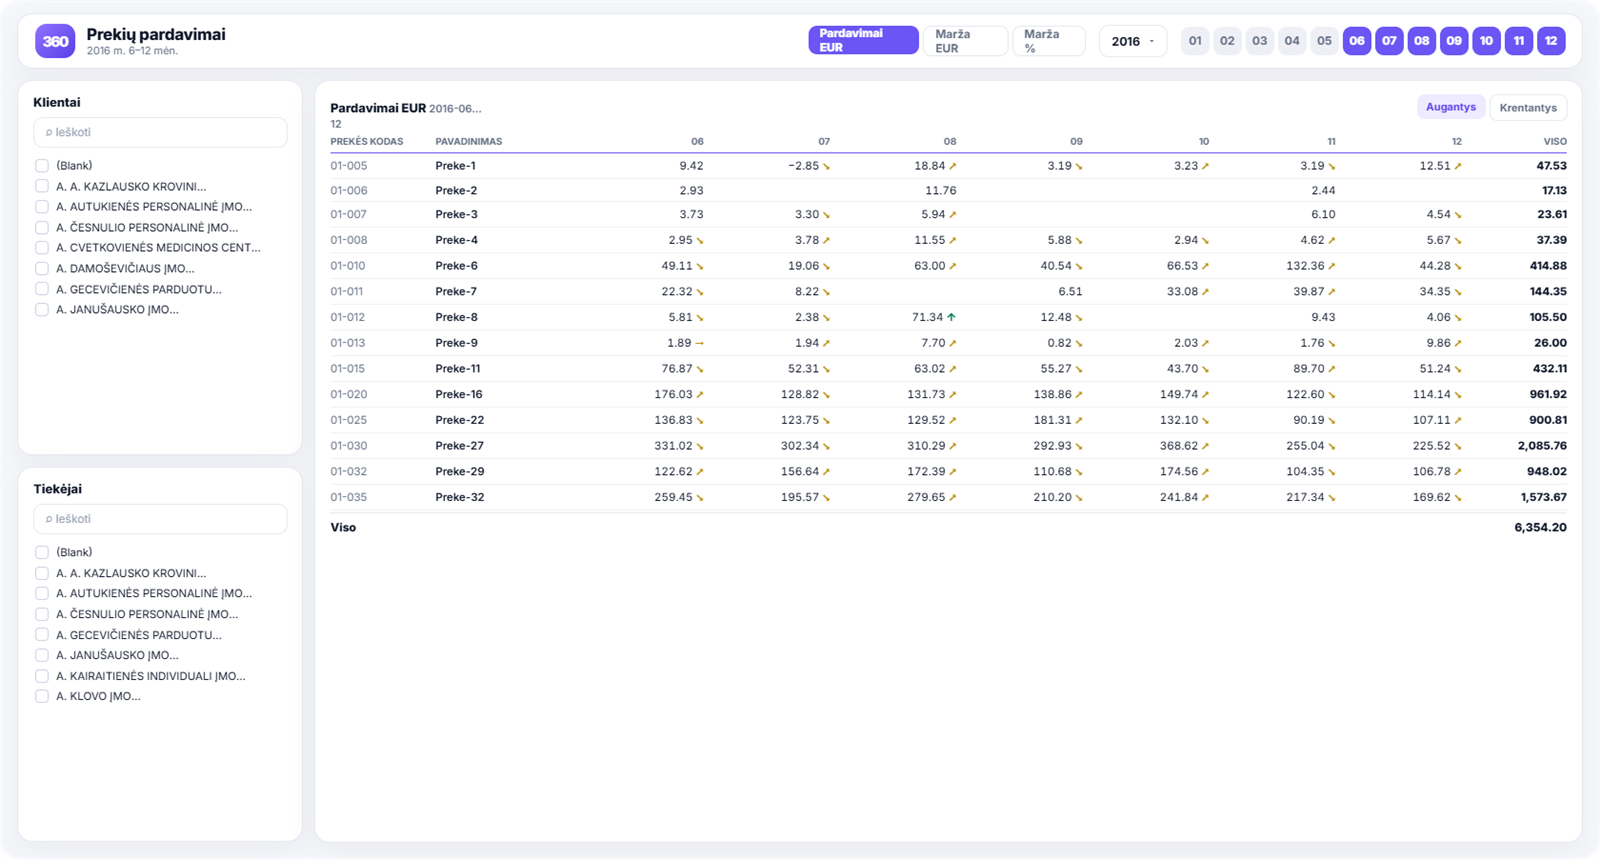
The best-selling product and the most profitable product are often not the same thing. This report shows the revenue, cost of sales, gross profit and profit margin of every product or service, so decisions about your range rest on profit rather than turnover.
What decisions it helps you make
- Which products to push. Ranking by profitability shows what is worth promoting in sales.
- Which to drop. Low-margin, slow-moving products take up warehouse space and tie up cash.
- How to change prices. With margin visible for each product, pricing decisions become precise rather than approximate.
- How branches perform. The same product can be more or less profitable at different sites because of discount policy.
What you see in the report
- sales revenue, cost of sales and gross profit for each product;
- profit margin as a percentage;
- ranking by profitability, cost of sales or revenue;
- revenue and profit by branch, product group and sales manager;
- the best-selling product, the most profitable product and the product generating the most revenue;
- product sales trends over time.
How to read this report
The most useful view is products that sit at the top by turnover but at the bottom by margin. This usually means either excessive discounts or a rise in cost of sales that has not yet been passed on in the price.
The second thing to look at is product groups where margin consistently differs between branches. That is almost always a management issue rather than a market one.
Four groups worth splitting your product range into
Combine two measures — turnover and margin — and your range naturally falls into four parts, each calling for a different decision:
- High turnover, high margin. The backbone of the business. The priority is making sure these products never run out of stock.
- High turnover, low margin. Usually the result of discounts or higher cost of sales. This is where raising prices by a few per cent pays off most.
- Low turnover, high margin. Untapped potential — often these products simply are not being actively offered.
- Low turnover, low margin. Candidates for delisting. They take up warehouse space and sales attention.
This kind of split takes a few minutes when all the figures are in one table, and is practically impossible when the data is scattered across exports.
Products that cost more than they seem
Every slow-moving product carries a hidden cost: occupied warehouse space, tied-up cash and the risk of obsolescence.
That is why product analysis is best read alongside the slow-moving stock report. A product that looks acceptable on margin but sits in the warehouse for six months actually costs more than it earns.
What to do with the results
It is most useful to review your product range once a quarter rather than every month — product sales need time to form a reliable trend.
Three decisions are enough for the review: what to push, what to raise the price of and what to drop. You will see the effect the following quarter in the profit analysis.
How to get this report
Product analysis is included in the ready-built Rivilė and Finvalda report packages. For retail and restaurant chains, R-Keeper analytics is often relevant too.