See more. Decide better.
 Slow-Moving Stock Analysis: How Much Money Is Sitting in Your Warehouse

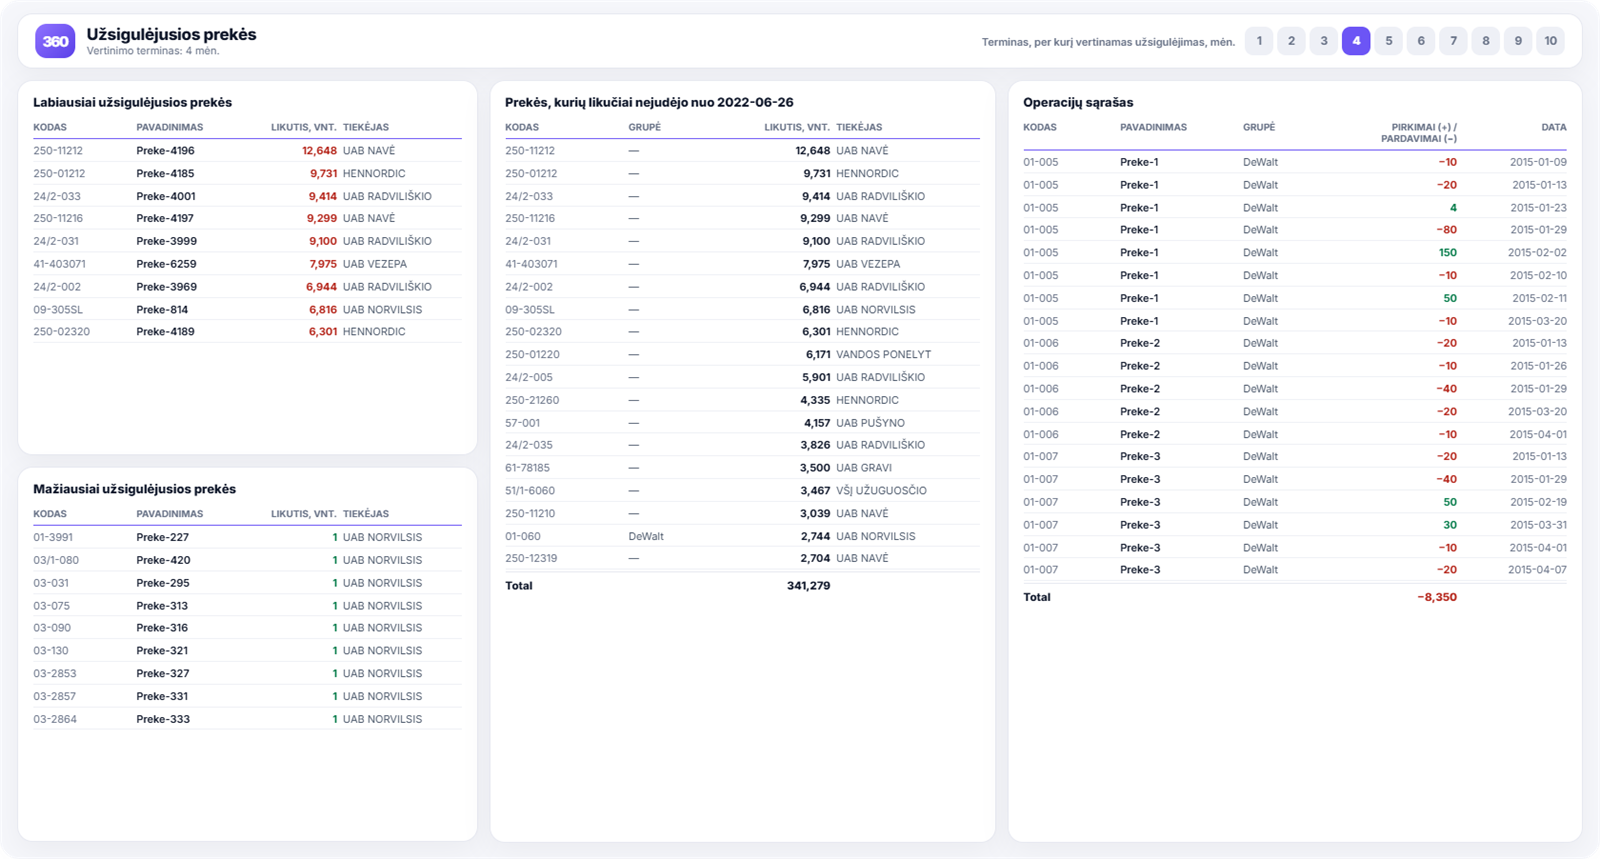
Stock sitting in a warehouse is frozen cash — yet few businesses know how much cash, and in which items. This report lets you choose an assessment period in months and shows which items have not moved during that time.
What decisions it helps you make
- What to mark down or clear. Items that have not moved for six months rarely start moving on their own.
- What to stop ordering. The slow-moving stock list feeds directly into the purchasing plan.
- How much working capital can be freed up. The total stock value shows the real potential.
- Whether the problem is systemic. If slow-moving stock is concentrated in one product group or with one supplier, the cause is not random.
What you see in the report
- a selectable period in months over which slow-moving stock is assessed;
- the slowest-moving items, with stock balances and suppliers;
- the fastest-moving items;
- a list of all slow-moving items and the total number of units;
- items whose stock balances have not moved since a specific date;
- the movement history of a selected item (purchases and sales).
How to read this report
Start by choosing the period — it should match the rhythm of your business. In seasonal trade, three months means nothing, whereas for fast-moving goods it is already a warning sign.
Next, look at stock balance together with supplier. If one supplier’s product group consistently goes stale, the conversation needs to be with purchasing, not the warehouse.
What idle stock really costs
The purchase price is only the start. Every year, it is added to by:
- frozen cash — the same sum could have been in circulation or paid down debt;
- warehouse space taken up by stock that does not move;
- depreciation — the value of seasonal, technological or simply outdated goods falls by itself;
- write-off risk, if the item eventually proves unsaleable.
That is why “we’ll hold on to it, maybe it’ll sell” almost always costs more than marking it down now. An item that has sat on the shelf for a year has usually cost more than a 30% discount would have cost a year earlier.
How to choose the period
The period should reflect the item’s turnover rate, not the calendar. In practice, the following guide works:
- fast-moving goods (food, everyday consumables) — 1–2 months;
- regular trade — 3–6 months;
- seasonal goods — one full season, so assessment only makes sense once it is over;
- spare parts and rarely sold items — 12 months or more.
The mistake we see most often is using a single period for the entire range. Either seasonal items wrongly end up on the list, or problems with fast-moving goods go unnoticed.
What to do with the list
A slow-moving stock report is only useful when it leads to decisions. In practice there are three: mark down and clear, return to the supplier if the contract allows, or write off and free up the space.
And the most important, often forgotten fourth — stop ordering. The list feeds directly into the purchasing plan: the same items should not return to the warehouse next quarter.
You can see which items actually make money in the stock movement analysis.
How to get this report
Slow-moving stock analytics is included in the Rivilė PRO and Finvalda PRO packages. You will find the full list of reports on the pricing page.