See more. Decide better.
 Profit Analysis: Gross, Operating and Net Profit in a Single Report

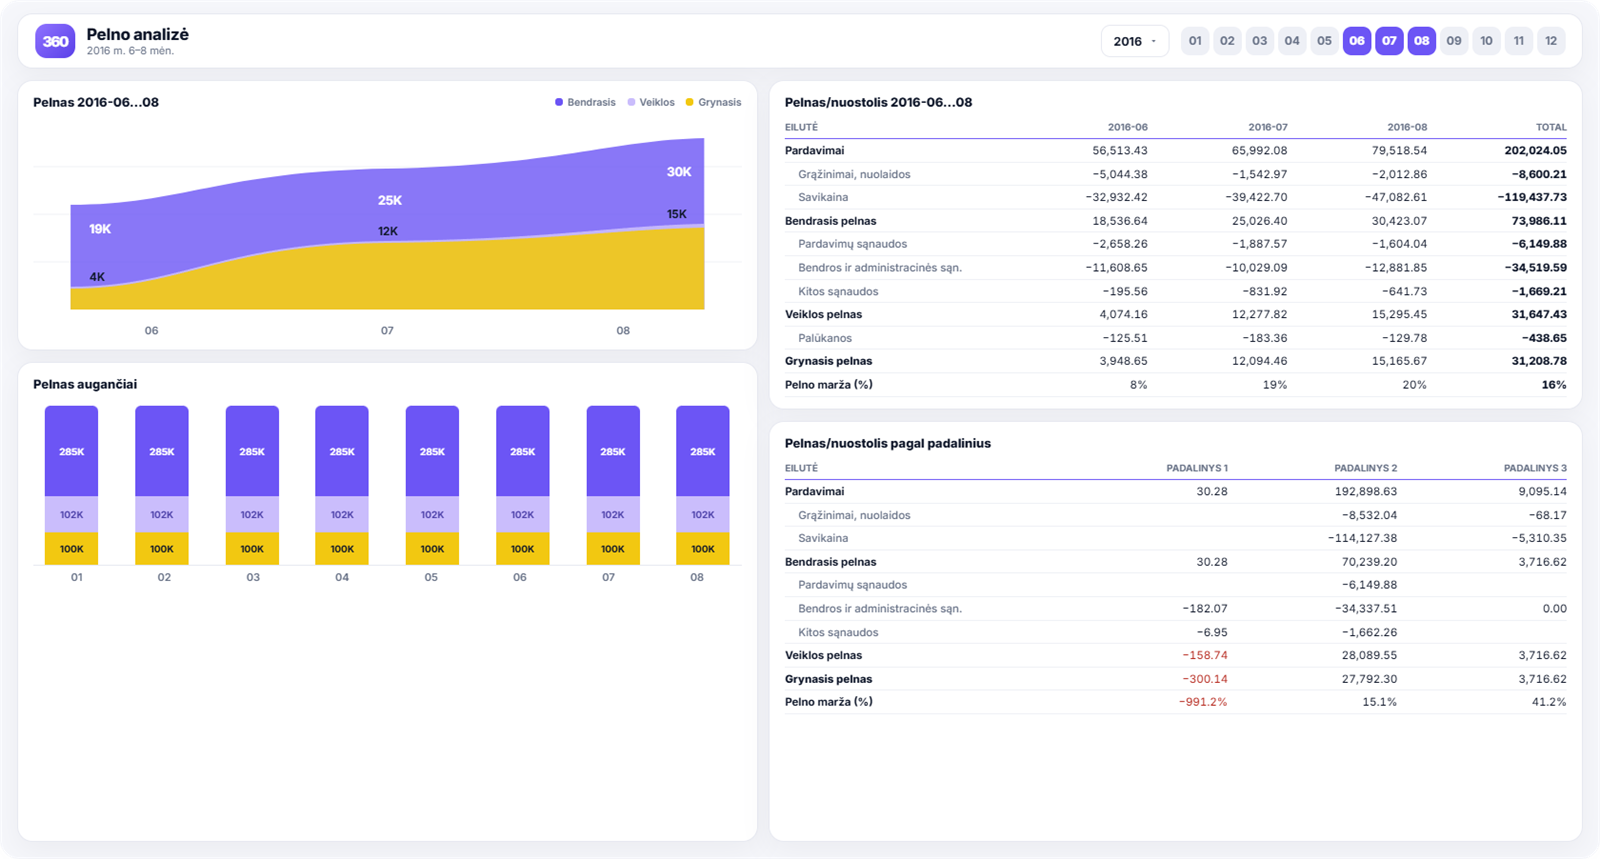
Profit is the figure everyone talks about, yet few ever see how it is made up. This report shows three levels of profit (gross, operating and net) and how each changed over the period you choose.
The gaps between these three figures often tell you more than profit itself: if gross profit is stable but operating profit is falling, the problem lies not in pricing but in operating costs.
Which decisions it helps you make
- Where margin is being lost. You can see at which level the money disappears: cost of sales, operating costs or financing.
- Which business units are making money. Profit and margin by business unit show whether every site is contributing to the result.
- Whether growth is profitable. Turnover growth without margin growth often means you are growing by selling more cheaply.
- Whether decisions have paid off. Month-by-month profit trends let you assess what changed after a review of pricing or costs.
What you see in the report
- gross, operating and net profit trends month by month;
- cumulative profit for the year to date;
- profit margin as a percentage and how it has changed;
- the profit and loss structure: sales, returns, cost of sales, expenses;
- profit and margin by business unit;
- a comparison with the same period last year.
How to read this report
Start with the profit margin, not the amount. The amount can grow simply because turnover is higher, whereas the margin shows whether the business is becoming more efficient.
Next, compare the business units. If one site has a noticeably lower margin despite similar activity, the cause is usually one of three things: larger discounts, a higher cost of sales or higher local costs, and all of this becomes visible when you drill down into the line items.
The three levels of profit and what each tells you
When reading the report, it helps to know which question each figure answers:
- Gross profit (revenue minus cost of sales) shows whether prices are set correctly and whether cost of sales is under control. It is a pricing indicator.
- Operating profit (gross profit minus operating costs) shows whether the operation itself is efficient: whether rent, administration and selling costs fit within the margin being earned.
- Net profit shows the bottom line after interest and tax.
The diagnostic value comes from comparing them with one another. Stable gross profit alongside falling operating profit means pricing is sound and the problem lies in costs. Falling gross profit means the opposite: cost of sales has gone up or discounts are too generous.
A practical example
A typical situation: turnover has grown by 15% over the year, which sounds good. Gross profit, however, has grown by only 4%.
The difference means the growth was bought with discounts: more was sold, but at a lower margin. You cannot see this from a turnover report alone; the profit margin trend reveals it straight away.
Other views show what to do about it: which customers and which products received discounts can be seen in the sales analysis, and whether costs rose at the same time in the cost report.
What this report does not show
Profit is an accounting measure, not cash flow. A profitable company can still have no money in the bank if customers pay late or cash is tied up in the warehouse.
That is why the profit report is worth reading alongside debt analysis and the slow-moving stock report. Together, the three give a true picture that none of them gives on its own.
How to get this report
Profit analysis is included in the Rivilė PRO and Finvalda PRO report packages. You can see what all the reports in a package look like in the samples.