
Profit and Loss Report in Rivilė: 5 Error-Free Steps for Accountants

You will find the profit and loss statement in Rivilė via the General Ledger: the menu path is Servisas (Service) → Didžioji knyga (General Ledger) → Pelno ataskaita (Profit Report). Before generating it, you need to carry out three checks: post all periodic transactions to the General Ledger, check that the company’s chart of accounts is mapped to the tax chart of accounts, and make sure the correct reporting period is selected. Skip any one of these steps and your Rivilė profit report will come out wrong or empty.
In brief:
- Make sure you have posted all transactions to the General Ledger and check how accounts are mapped to the tax chart of accounts; otherwise the report may be empty or inaccurate.
- The profit and loss statement can be generated with or without cents, and the choice may depend on the rounding account setting and the report configuration.
- Preparing the report correctly requires a consistent sequence: posting the transactions, checking the balance and setting the right period, as errors often creep in at this stage.
- If the profit report shows inaccurate or zero figures, check the period, the account mappings and the postings, then make corrections in the source documents.
- For automation and quick checks of the analysis, it helps to export the data to Power BI or Analitika360 so that managers can follow trends in real time.
Contents
- Where to find the profit report in Rivilė: forms, templates and additional reports
- Essential settings before generating: chart of accounts mapping and the rounding account
- Step by step: how to produce the profit and loss statement
- Common errors and a checklist for when the report is empty or shows wrong figures
- Deeper analysis and automation: exporting to BI and Analitika360 solutions
- Year-end closing procedures and their effect on profit and loss data
- Why the profit report is a manager’s most important tool
- Which profit report figures matter most and how to read them in Rivilė
- A practical example: how a company prepares the profit report correctly in Rivilė
- How to check profit report data and correct errors in Rivilė
- The Analitika360 perspective: practical advice for accountants
- Power BI report packages for Rivilė data
- Sources
Where to find the profit report in Rivilė: forms, templates and additional reports
In Rivilė, all financial reports, including the trial balance, the balance sheet and the profit and loss statement, are generated in the General Ledger module. The menu path is the same in every case: Servisas → Didžioji knyga → Ataskaitos (Reports), from which you choose the form you need.
The program uses the standardised Profit (Loss) 2016 form, which complies with Lithuanian accounting requirements. It can be generated in two ways:
- with cents — the full report, showing exact amounts to the hundredth;
- without cents — a rounded report, which requires a rounding account to be configured as well.
For accountants who track profitability monthly as well as annually, Rivilė lets you create an additional report, „Sąskaitų apyvarta pamėnesiui (12 mėn.)“ (Account turnover by month, 12 months). Once you specify a range of accounts (usually class 5–6 accounts), the system automatically builds a new report in which income and expenses are arranged by month. This is useful when you need to compare seasonal fluctuations and the official form does not give that level of detail.
Essential settings before generating: chart of accounts mapping and the rounding account
Before you click “generate”, it is worth running through three configuration checks. The most common problem Rivilė users run into lies not in the report itself but in what sits beneath it — an untidy mapping of the chart of accounts to the tax chart of accounts.
- Linking the chart of accounts. Check that every company account has a line in the tax chart of accounts assigned to it. This is set up on the account cards, and an incorrect mapping means certain amounts simply will not appear in the report.
- The rounding account. If you choose the “without cents” form, a rounding account must be specified in the chart of accounts, usually 2631. It is set with the SS-BALANCE-ROUND-CENT-ACCOUNT parameter. Without it, the balance sheet may fail to balance to the cent.
- Reviewing account correspondences. If certain transactions appear on a different line from the one they should, the cause usually lies in the general ledger mappings, not in the report itself.
Pro tip: set aside five minutes once a month for a check — open the chart of accounts and see whether all newly created accounts have a tax chart code assigned. This saves you from finding the error only at year end, when it is harder to fix.
Step by step: how to produce the profit and loss statement
Once the configuration has been checked, the process itself can be repeated in the same order every time you need a new report.
- Carry out the periodic postings. All transactions from the sales, purchasing, cash and bank modules must be posted to the General Ledger. Without this step, the report simply will not see part of the turnover.
- Check the trial balance. Before looking at the final report, open the trial balance and make sure the debit and credit sides agree and that no account shows an unusually large or zero value.
- Set the reporting period. Select the exact start and end dates. A wrongly selected period (for example, last year’s range) is one of the most common reasons a report appears empty.
- Choose the form. Decide whether you need the Profit (Loss) 2016 form with cents or the rounded version.
- Generate and export. Once you click the generate button, the report can be printed straight away or exported as a PDF to submit to management or the auditor.
This consistency matters especially when the report has to be produced regularly, not just at year end.
Common errors and a checklist for when the report is empty or shows wrong figures
When the profit report shows empty or obviously wrong figures, experience shows that problems are best tackled in a strict order: first the period, then the postings.
- Check that the reporting period matches the range you need, not the system default.
- Make sure all transactions from the modules have been posted to the General Ledger.
- Look for any deferred, unapproved or duplicated transactions.
- Compare the chart of accounts mappings with the tax chart of accounts, looking for missing correspondences.
- Check the rounding account setting if you are using the form without cents.
If the first two points are in order and the problem keeps recurring, a handy way to pin it down is to compare the official profit report with the additional „Sąskaitų apyvarta pamėnesiui“ report — if the difference appears in the same month, the cause is usually the same incorrect correspondence repeating every period.
Deeper analysis and automation: exporting to BI and Analitika360 solutions
The standard profit report answers the question “how much did we earn over the period?”. It does not tell you which product, department or customer contributed to that result, and managers need that level of detail for operational decisions more often than once a month.
Practical cases where the standard report is not enough:
- you need to follow monthly profit trends, not just the annual result;
- you need to compare profitability across departments or product segments;
- the manager wants to see the figures in real time, not in a PDF printed once a week.
Analitika360 integrates Rivilė data with Power BI, so income, expense and profit figures update automatically, without having to export them afresh each time.
Managers often need richer visualisations and real-time figures, which is why exporting to a BI tool or using a ready-made report package is becoming standard practice rather than the exception.
You can start with an export of your existing Rivilė data or with a ready-made report package that is already tailored to the profit and loss structure.
Year-end closing procedures and their effect on profit and loss data
Closing the year in the General Ledger is not a formality but a step that directly determines whether next year’s profit report will be correct. Rivilė’s documentation lists the year-end close as one of the main General Ledger operations, ensuring that profit is correctly transferred to the balance sheet.
In practice, this means that after the closing procedure the current year’s profit (or loss) is transferred to a balance sheet line, and the income and expense accounts are reset to zero for the new period. If this step is done too late or skipped, the profit report for the first month of the following year may show distorted comparative figures, because the system still sees balances from the old period.
This matters to accountants in two ways. First, the year should be closed only once all of the previous year’s transactions have been finally approved and posted. Second, the way the close is carried out directly affects not only the balance sheet but also the analysis of comparative periods, since many managers want to see this year’s profit against last year’s.
A practical tip: before running the year-end close, first generate the profit report for the whole of the previous period and save it separately. That gives you a fixed reference point to compare the data against if questions arise during the close about where particular amounts came from.
Why the profit report is a manager’s most important tool
The profit and loss statement is not just an accounting document for the tax authority or the auditor. It is the main source a manager uses to judge whether the company’s pricing, cost structure and sales volumes genuinely work together, or merely look good in isolation.
Companies that review the profit report only at year end are effectively running the business by looking in the rear-view mirror: decisions are made after the situation has already happened, not while it can still be corrected. A monthly report produced in Rivilė lets you spot a jump in costs or a fall in profitability within one period, not twelve.
This is particularly relevant for companies whose income fluctuates seasonally, for example in retail or services. For such companies, the annual profit can look reasonably good yet hide three loss-making months that the official annual form simply masks by adding everything up.
For a finance professional, the profit report becomes the tool that underpins decisions on pricing, headcount or new investment. When the data is accurate and updated on time, a decision on, say, opening a new shop rests on the actual profit margin, not a guessed one. When the data is late or inaccurate, the same decision is taken almost blind, relying on intuition that rarely matches the real situation.

Which profit report figures matter most and how to read them in Rivilė
The profit and loss statement produced in Rivilė follows the standard structure: sales revenue, cost of sales, gross profit, operating expenses and net profit. Each of these figures answers a different question, so they need to be read separately rather than just looking at the bottom line.
Gross profit (revenue minus cost of sales) shows whether the core business itself is profitable, before administrative and selling expenses. If this figure falls from month to month, the cause is usually pricing or a change in supplier prices, not overheads.
Operating expenses (staff, rent, administrative costs) show how much it costs the company simply to exist, regardless of sales volume. This figure is compared with gross profit rather than with revenue, because only then can you see whether the volume of business is enough to cover fixed costs.
Net profit is the final result, but it is worth comparing with earlier periods using the „Sąskaitų apyvarta pamėnesiui (12 mėn.)“ report discussed above. A single month’s result rarely tells you much, but a twelve-month trend reveals whether profitability is growing, stagnating or declining.
A practical example: how a company prepares the profit report correctly in Rivilė
Imagine a medium-sized trading company that prepares a profit report at the start of every month for the management meeting. The accountant first checks that all of the previous month’s sales, purchasing and bank transactions have been posted to the General Ledger. This is done systematically, not on the last day before the report.
The second step is reviewing the trial balance. The accountant notices that one account shows an unusually large amount that does not match the average of previous months. On checking, it turns out that one invoice was entered twice. The error is corrected before the final report is generated, not afterwards.
Third step: the exact period is selected (for example, 1 January 2026 to 31 January 2026) and the Profit (Loss) 2016 form with cents is chosen, because management needs exact amounts, not rounded ones. The report is generated and compared with the previous month’s result.
This example illustrates a fundamental rule: a correct profit report in Rivilė depends not on a single button but on a sequence followed in exactly the same way every time. Companies that standardise this process rarely run into “sudden” errors in their reports.

How to check profit report data and correct errors in Rivilė
Once the report has been generated, checking it should not stop at a glance at the total. The first step is to compare the net profit figure with the trial balance — they must match to the cent if you are using the full form, or to within rounding if you are using the form without cents.
The second step is checking individual lines. If an income or expense line shows zero even though you know there were such transactions during the period, the cause is usually an incorrect mapping of the account to the tax chart of accounts. In that case, go back to the chart of accounts and check that account’s code.
The third step, which accountants often skip, is comparing the report with the previous period’s. If last month’s gross profit was, say, twice this month’s, do not rush to accept it as fact. Check whether some transactions were left unposted, because a swing like that often signals a technical problem rather than a business one.
Once an error is found, it should be corrected in the source document (the invoice or journal entry), not in the report itself. Rivilė generates the report afresh from General Ledger data every time, so a correction at source will automatically be reflected in the next version generated.
The Analitika360 perspective: practical advice for accountants
Rivilė’s standard report does its job precisely at the moment you generate it. The problem arises when you need to review it several times a month or compare it with earlier periods, because that is when the manual work piles up.
If you notice that every week you print a PDF and copy the figures into Excel by hand, that is a signal to look for automation, not yet another manual procedure. Technical questions (postings, account mappings) are handled by Rivilė’s support team, but when you need visualisations and real-time figures, it is worth looking at Power BI examples built for Rivilė data.
— Analitika360
Power BI report packages for Rivilė data
Rivilė’s reports give you the right number, but they do not always give you a quick answer when a manager asks “why?”. Analitika360 offers ready-made Power BI report sets built directly on Rivilė data: income, expenses, profit and their breakdown are visible in a single visualisation that updates automatically, with no extra exporting each time.
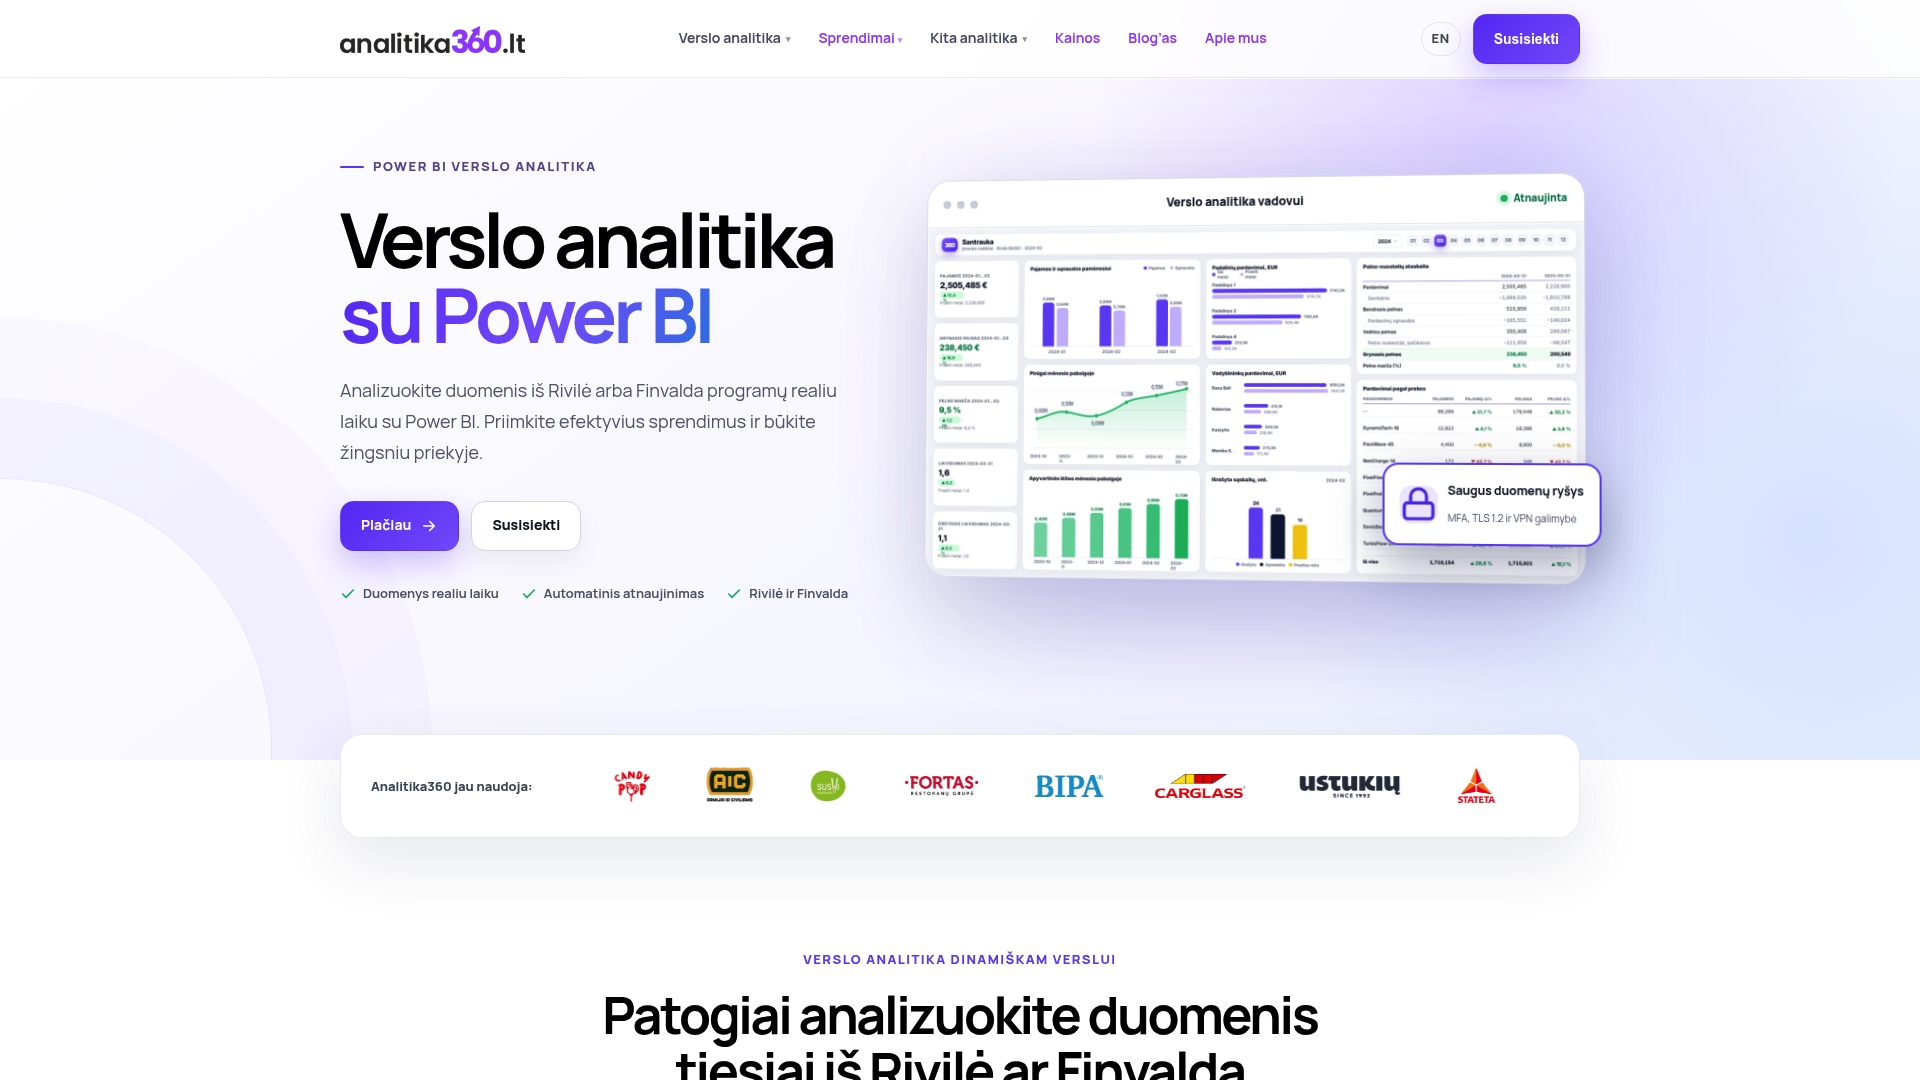
Unlike a standard PDF report, which has to be generated and compared by hand, a Power BI package lets you open a single dashboard and immediately see the monthly trend, the comparison with the previous period and the cost structure by department. For the accountant, that means less repetitive work; for the manager, it means decisions based on fresh figures rather than week-old ones.
Dedicated profit analysis packages show what this looks like in practice. Have a look at the Rivilė data integration examples and choose the package that suits your company’s size and reporting needs.