
Rivilė Sales Analysis with Power BI in a Few Days: A Guide for Companies in Lithuania

There are two good ways to analyse sales in Rivilė: use the standard Rivilė GAMA reports for day-to-day work, or connect the data to Power BI when you need deeper analysis and automation. The first option suits a quick fix; the second suits companies that need to see trends in real time. Below you will find concrete steps for putting this into practice.
In brief:
- Rivilė’s standard sales reports are fine for a quick check on results, but they never give you real-time trend analysis.
- When exporting data to Excel or CSV, choose the fields you need and filter by period to ensure data quality.
- Power BI integration lets you refresh reports automatically, combine data from several sources and visualise trends in real time.
- For in-depth analysis, it pays to track revenue, customer loyalty, product profitability and seasonal fluctuations so that you can make well-informed decisions.
- The tailored Analitika360 solution cuts set-up time and automates analysis processes, especially for individual companies with complex data needs.
Contents
- What the Rivilė GAMA sales module covers and what data you need for analysis
- Standard sales reports in Rivilė: what they show and when to use them
- How to prepare and export Rivilė sales data for analysis
- Power BI integration with Rivilė: when it is worth it and what it delivers
- Which indicators to track and how to interpret sales results
- Editor’s perspective: ready-built package or bespoke solution
- How Analitika360 helps set up Rivilė sales analytics
- Useful links and official documentation
What the Rivilė GAMA sales module covers and what data you need for analysis
The Rivilė GAMA sales module records every sales document, from order to invoice. The fields that matter most for analysis are the document number, date, customer, product or service code, quantity, price and payment terms. Without this data any report will be incomplete, because the link between the sale and the payment will be missing.
As the Rivilė GAMA guide explains, the system sets out specific steps for entering a sales document: creating the document, assigning the customer, entering the content (the product lines) and final confirmation. Each of these stages directly affects what data you will later see in your reports.
You will find the system reports and filters in the “Analytics and Reports” module. Before starting your analysis, it is worth checking the following:
- whether all sales documents have been confirmed rather than left in draft status;
- whether product records use consistent units of measure and category values;
- whether customer records contain correct payer details;
- whether filters by period, department or product group are being used.
Standard sales reports in Rivilė: what they show and when to use them
Rivilė GAMA has several standard reports that help answer different business questions. The revenue and quantities report shows how much was sold, and for how much, over a chosen period; it lets you compare month on month or year on year and drill down to an individual document.
The product and service profitability report links the selling price to the cost of sales from the warehouse module. This report answers the question of which products genuinely make a profit and which merely generate turnover. Customer profitability and debt analysis complete the picture from the financial side.
In practice, these reports are useful in different situations:
- revenue report – when you need a quick view of the month’s or quarter’s results for a management meeting;
- product profitability report – when deciding which products to promote or drop from the range;
- customer analysis – when you need to identify the highest-risk debtors or your most important customers;
- debt report – when assessing breaches of payment terms and cash flow.
The system lets you export all of these reports to Excel or PDF, as stated in the Rivilė GAMA module description, so the results can be moved straight into another working environment.
How to prepare and export Rivilė sales data for analysis
Data preparation determines whether the final analysis will be reliable. We recommend the following sequence:
- Select the fields you need. For analysis, the document date, customer code, product code, quantity, price and department tag are usually enough. Exporting surplus fields only makes the file harder to process.
- Set filters by period and department. If the company has several departments or warehouses, separate the data by them; otherwise the revenue breakdown will be distorted.
- Export to Excel or CSV. This format suits one-off or monthly analysis when data volumes are small.
- Opt for a direct connection to Power BI if reports need refreshing more often than once a month or if there are several data sources (Rivilė, Excel, CRM).
- Check data integrity. Compare the total in the exported file with Rivilė’s system report – if the figures do not match, the usual culprit is an incorrect filter or period setting.
Before connecting the data to Power BI, it is worth standardising customer codes, product records and currency labels – inconsistent names can later create duplicate rows in reports.
Pro tip: Before each month-end close, compare the total sales in the exported Excel file with the total in Rivilė’s revenue report. If the difference is more than a few per cent, you have most likely missed an unconfirmed document or applied the wrong filter.
Power BI integration with Rivilė: when it is worth it and what it delivers
Rivilė’s standard reports are perfectly good for day-to-day work, but they have a limit – they show a snapshot of the current situation rather than changes over time. Power BI integration removes that limit, letting you see trends, compare periods at a glance and refresh data automatically without extra exports.
According to information provided by Rivilė, up to 19 different reports with dynamic filtering, drill-down and automatic data refresh can be used with Power BI. This means a manager can move from an overall revenue summary to the details of a specific customer or product in a matter of seconds.
Power BI integration offers concrete advantages:
- visualisations that refresh automatically, with no manual export each time;
- the ability to combine Rivilė data with other sources such as Excel, SharePoint or a CRM;
- drill-down functionality that takes you from a headline figure to an individual document;
- a single dashboard showing sales, inventory and debt information together.
Analitika360 offers this integration as the ready-built Rivilė PRO Power BI report package, which refreshes automatically and is set up to work with Rivilė data from the outset. Technical preparation involves granting access to the database, configuring security settings and initially calibrating the reports to the company’s departmental structure.
Which indicators to track and how to interpret sales results
A few key groups of indicators help you assess the state of your sales faster than total revenue alone. It is worth tracking:
- total revenue for the period and how it has changed compared with the previous period;
- average transaction value, which shows whether customers are buying more or less per visit;
- number of orders, which reveals whether customer activity is growing or only the average price;
- customer retention rate, which indicates how many customers come back again;
- product profitability, which shows which product groups genuinely pay their way.
Seasonality often distorts the overall picture, so a fall in revenue should be compared with the same period last year rather than with the previous month. When an indicator falls below a set threshold for several months in a row, it is worth setting up an automatic alert so that you can react quickly rather than after the quarter has closed.
Editor’s perspective: ready-built package or bespoke solution
A ready-built Power BI report package suits most companies with standard sales processes and a single Rivilė GAMA database. It is quick to implement and costs less than a bespoke project.
A bespoke solution is worth choosing when you need to combine several data sources, several departments or industry-specific logic, as in restaurant chains or logistics companies. The decision depends not on price as such but on how far the business process departs from the standard – the more complex the structure, the faster a bespoke project pays for itself in time saved.
— Analitika360
How Analitika360 helps set up Rivilė sales analytics
Analitika360 is a direct alternative to building reports yourself from scratch – instead of spending several weeks designing a Power BI model, you get a ready-made solution tailored to Rivilė data within a few days.
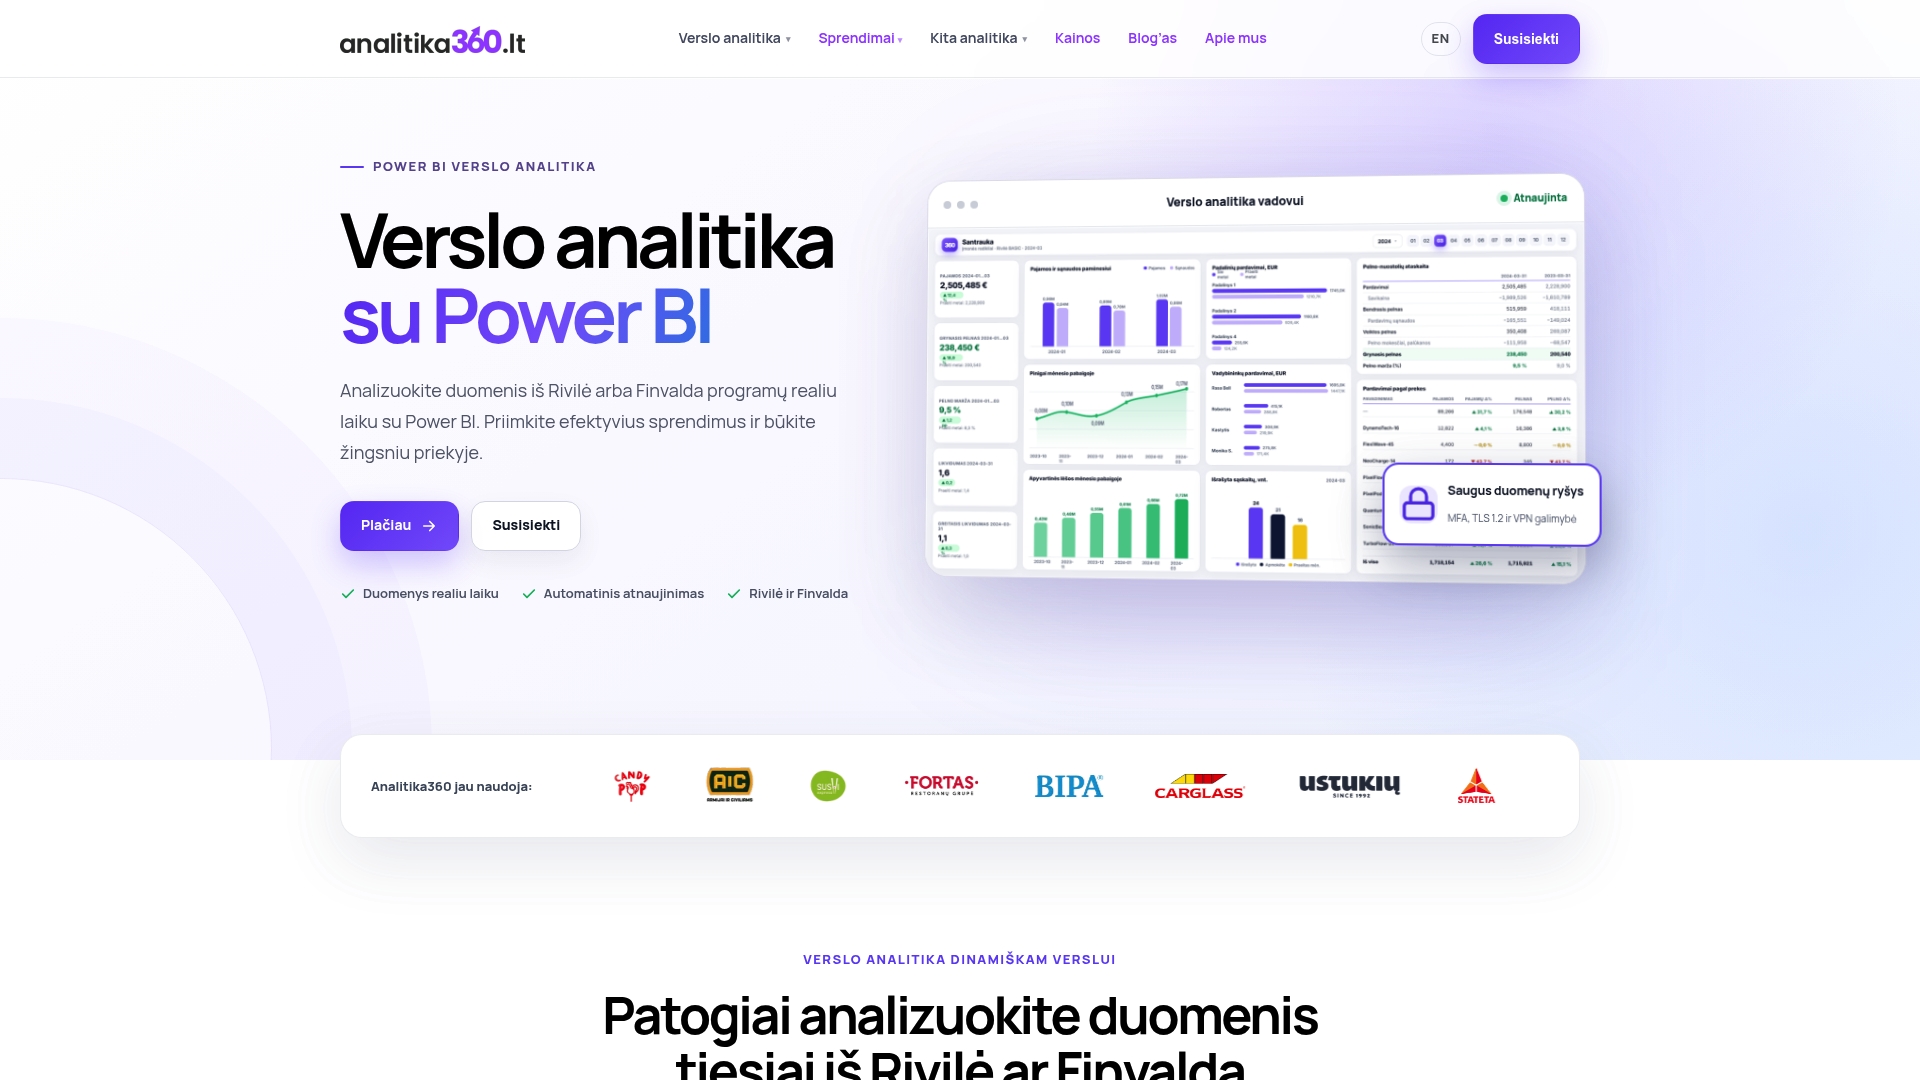
Once connected to the Rivilė database, you get ready-built Power BI reports covering sales, inventory and customer profitability indicators in a single dashboard. The reports refresh automatically, with no additional exporting or manual work. A typical project start-up phase involves granting database access, calibrating trial reports to your departmental structure and final sign-off.
Restaurant chains and accounting firms using this solution save time on routine reporting and gain detailed financial information for strategic decisions. If you would like to see how this looks in practice, take a look at our Power BI report examples or get in touch about a specific Rivilė data integration proposal.

Useful links and official documentation
Before implementing any of the steps described, it is worth reviewing the primary sources to avoid mistakes caused by outdated information:
- Rivilė GAMA guide — general documentation on the structure and functions of the modules.
- Rivilė Apps GamaREP – an add-on tool that extends analysis of sales, POS and loyalty data.
- How to connect Power BI to Rivilė – a technical guide to configuring the connection.
- Ready-built package or bespoke project – a comparison to help you choose the right type of solution.
- AI automation in sales – wider context on automation trends in sales management.