
Fast Small Business Reporting: Integrating Rivilė and Finvalda

Yes, automated Power BI reports suit small businesses, and within a few weeks they give real-time visibility of finances and operations. You can get started by choosing a ready-built report package, which the provider then tailors to your needs. The only first step required from the manager is a list of the data sources in use and a demo request.
In brief:
- Automated Power BI reports save time and cut errors, because the data refreshes automatically and needs no manual intervention.
- A successful rollout depends on clearly defining your data sources, assigning responsible people and starting with a handful of priority metrics.
- Standard packaged solutions get up and running faster, but bespoke customisation matters if the company has specific sector requirements.
- Successful integration depends on consistent data codes and ongoing data quality control, so each source needs one person responsible for it.
- Companies that start with just five core KPIs in automatically refreshed reports can make strategic decisions faster and on better information.
Contents
- Which small business reports to choose: types and packages
- How much you can save: business benefits and payback in figures
- How implementation works: from data to automatic refresh
- Rivilė, Finvalda, Excel and SharePoint: how to connect them without errors
- Which KPIs a manager should see every day, week and month
- How automated reports pay off in practice
- How to choose a Power BI provider for a small business
- Contact information and how to get started
- Analitika360 packages: from demo request to working report
- What companies most often overlook when rolling out small business reporting
- Sources
Which small business reports to choose: types and packages
Small business reports fall into two groups, and each answers a different question. Financial reports show how much the company earns and where it spends its money. Operational reports show how the business itself is running, from sales to stock levels.
A typical small business reporting set includes:
- Profit and loss statement – shows how profit develops over a chosen period.
- Balance sheet – shows assets, liabilities and equity at a given point in time.
- Sales report – breaks down turnover by product, customer or branch.
- Inventory report – shows stock levels, stock turnover and items running short.
- Debt and settlements report – tracks receivables and payables.
For a restaurant chain, the most important reports will be sales by location and inventory, while an accounting practice or service company will be more interested in profitability and debt management. Rivilė offers up to 19 ready-built Power BI reports covering both categories, so you can choose according to the nature of your business rather than starting from a blank page.
How much you can save: business benefits and payback in figures
The biggest savings come not from nicer charts but from reports no longer needing human hands. Manually transferring data from Rivilė or Finvalda into an Excel spreadsheet, merging it and checking formulas every month takes up hours that an accountant or finance manager could spend on analysis rather than copying.
Specific sources of savings:
- Automatic data refresh with no manual exports from the accounting software.
- One template used every month, with no need to redesign reports.
- Fewer errors, because data is no longer copied between different files.
Expert tip: When calculating payback, look not only at the hours saved but also at how much faster the manager makes decisions when data refreshes automatically rather than once a month.
Automated Power BI reports reduce the time spent preparing reports, because the data refreshes without further intervention. Analitika360 clients, including restaurant chains and accounting firms, use this model to get comprehensive financial information for strategic decisions without waiting for the month-end summary. In the short term, the ROI shows up as time saved; over six months or a year, as faster decisions on pricing, product range or staffing.
How implementation works: from data to automatic refresh
Implementation is not a one-day job, but it need not be a long process either if the structure is clear from the outset.
- Inventory of data sources. List where your data is currently held: Rivilė, Finvalda, Excel files, SharePoint documents. Identify which fields matter most for management decisions.
- Data cleansing and modelling. The provider aligns field names across sources (for example, “customer” in Rivilė and “buyer” in Excel) and builds a shared data model.
- Report building and customisation. The ready-built package is adapted to your terminology, currency and organisational structure.
- User testing. Managers and accountants check that the figures match what they already know from the accounting system.
- Setting up automatic refresh. The refresh frequency is configured, and from then on the reports update themselves.
With a ready-built package, the typical time from first conversation to working solution is a few weeks; a bespoke project with several data sources needs more time for alignment. The most common obstacle is not the technology but the fact that nobody in the company is clearly responsible for data quality – when fields are named inconsistently across sources, the reports show inaccurate figures until someone notices.
Expert tip: Before implementation, appoint one person responsible for keeping the data in order in each source. Without a clearly responsible person, even the best Power BI package will show figures that don’t reconcile.
Rivilė, Finvalda, Excel and SharePoint: how to connect them without errors
Each data source plays a different role. Rivilė and Finvalda usually hold accounting data and sales and inventory records. Excel files often store budgets or forecasts that the accounting system cannot see. SharePoint is used for documents and sometimes for spreadsheets shared between departments.
Practical tips for integration:
- Before connecting, check that Rivilė and Finvalda use the same product or customer codes; otherwise the Power BI model will contain duplicates.
- Finvalda provides consultancy and technical support for building Power BI reports, so it is worth coordinating the integration stage with their team or with an analytics provider who does this routinely.
- Use Excel data as a supplementary rather than primary source – manual files are the easiest way to introduce discrepancies.
Refresh frequency has a direct impact on how quickly decisions are made. Daily refresh suits most small businesses, hourly refresh is needed in high-volume retail, and real-time refresh is usually justified only where every hour changes the decision, for example in logistics. A common situation in practice is data scattered between Excel and Rivilė, so the most effective approach is to start with a ready-built package whose data processing already supports the most commonly used fields, and only then make minor adjustments.
Which KPIs a manager should see every day, week and month
Not all metrics matter equally every day. A good reporting structure separates the metrics that call for quick reaction from those that matter for the strategic picture.
- Daily: cash flow position, daily sales against plan.
- Weekly: margin analysis by product group, sales trends, changes in stock levels.
- Monthly: profitability report, balance sheet, overall business KPIs for comparison with previous periods.
Power BI integrations enable stock level monitoring, profit and loss comparisons and customer profitability analysis with drill-down, so a manager can go from a headline figure to a specific customer or transaction in a few clicks.
| KPI group | Frequency | Purpose |
|---|---|---|
| Cash flow position | Daily | Short-term liquidity management |
| Margin analysis | Weekly | Pricing and product range decisions |
| Profitability report | Monthly | Strategic assessment |
| Balance sheet | Monthly | Financial position and liabilities |
You can see specific examples of how these metrics look on a dashboard in our Power BI report examples.
How automated reports pay off in practice
The restaurant chain case illustrates a pattern that recurs in other sectors too. When several outlets or branches generate sales data at different speeds, the manager has often had to wait for the month-end summary to see which branch is missing its target. With an automated report, the same information is visible the next working day.
Analitika360 solutions are tailored to specific industries, including restaurant chains, where sales and inventory data change every day. For certain accounting firms, a similar model makes it possible to see the financial position of a dozen or more companies in a single dashboard without logging into each accounting system separately.
The general pattern is similar in every case: while reports are prepared by hand, the manager makes decisions based on past data. When the report refreshes automatically, decisions are based on the current situation. The difference is not cosmetic; it is the difference between reacting to a problem and preventing it.
This also explains why more and more small businesses are choosing a sector-specific package rather than a generic report template. A generic dashboard is fine to start with, but it soon becomes clear that a restaurant and a construction company need different KPI blocks.
How to choose a Power BI provider for a small business
There are several types of provider on the market, each with its own strengths. Some sell only licences and technical support; others offer ready-built sector report packages with ongoing maintenance.
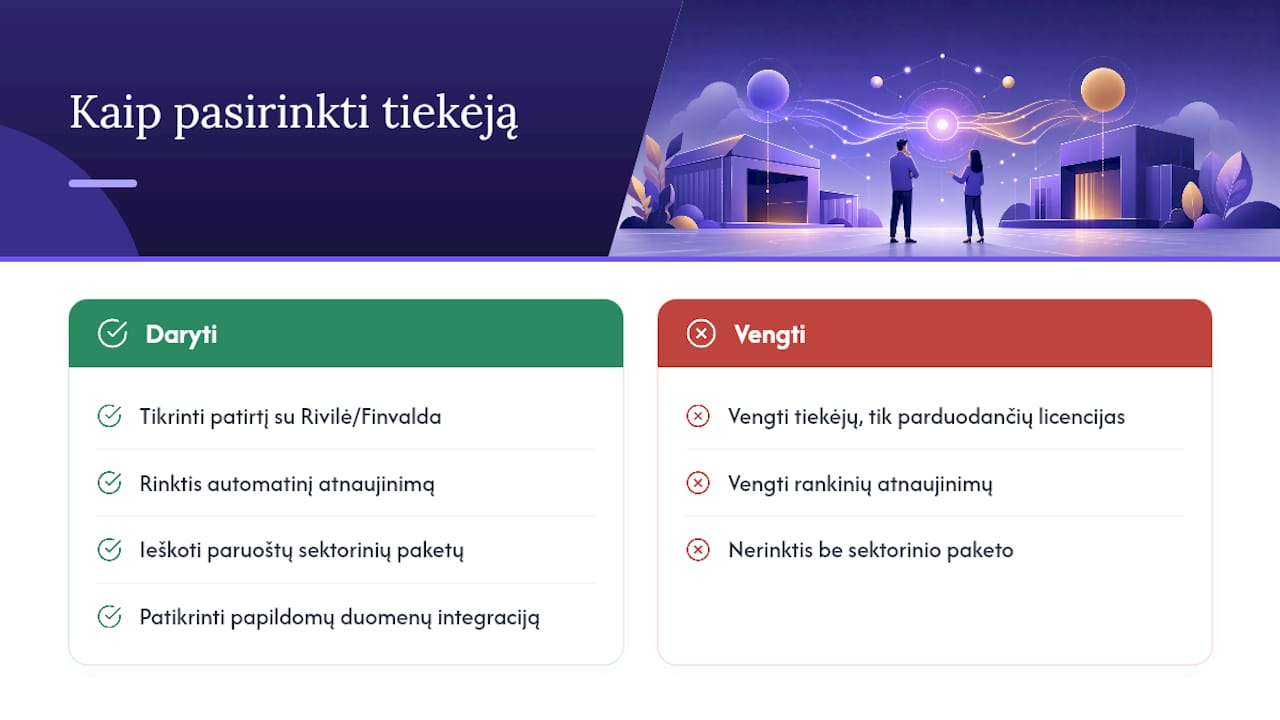
When choosing a provider, it is worth checking three things. First, whether the provider has experience with the accounting system you use, because Rivilė and Finvalda each have their own data structure that needs to be known in practice, not just understood in theory. Second, whether the solution offers automatic refresh or whether you will still have to update the reports by hand, as this largely determines how much time you will actually save. Third, whether the provider has ready-built sector packages for your type of business, or whether everything will have to be built from scratch.
Ready-built packages give small businesses a quick start, while bespoke customisation becomes essential when a company has sector-specific requirements that the standard package does not cover. Good practice is to start with a ready-built solution and adjust it, not the other way round.
It is also worth looking at how the provider handles additional data, such as exchange rate movements, which directly affect small business financial metrics for companies that import or export. A provider able to integrate such additional sources into a single dashboard delivers more value than one limited to accounting data alone.
Contact information and how to get started
The first practical step is organisational rather than technical: list the systems you currently use (Rivilė, Finvalda, Excel, SharePoint) and who in the company is responsible for each data source. With this list in hand, the conversation with the provider takes much less time and the first proposal is more accurate.
Next comes a short call in which the provider assesses whether a ready-built package will do or a bespoke solution is needed. A trial period is then agreed, during which managers and accountants check that the report figures match what they already know from their own systems. Only after this check is automatic refresh switched on and the solution moved into everyday use.

For companies unsure which package to start with, the most practical option is to get in touch first and discuss their specific situation, because the right choice depends on the size of the business, the sector and the combination of systems currently in use. This avoids a common mistake: investing straight away in the broadest package while actually using only some of its features.
Analitika360 packages: from demo request to working report
There are solutions built specifically for small businesses working with Rivilė and Finvalda, which differ from generic Power BI templates in that the reports refresh without user intervention. What sets them apart from generic market solutions is the automation: the reports update without any input from you, so there is no longer any need to ask the accountant every month to export data into a new spreadsheet.
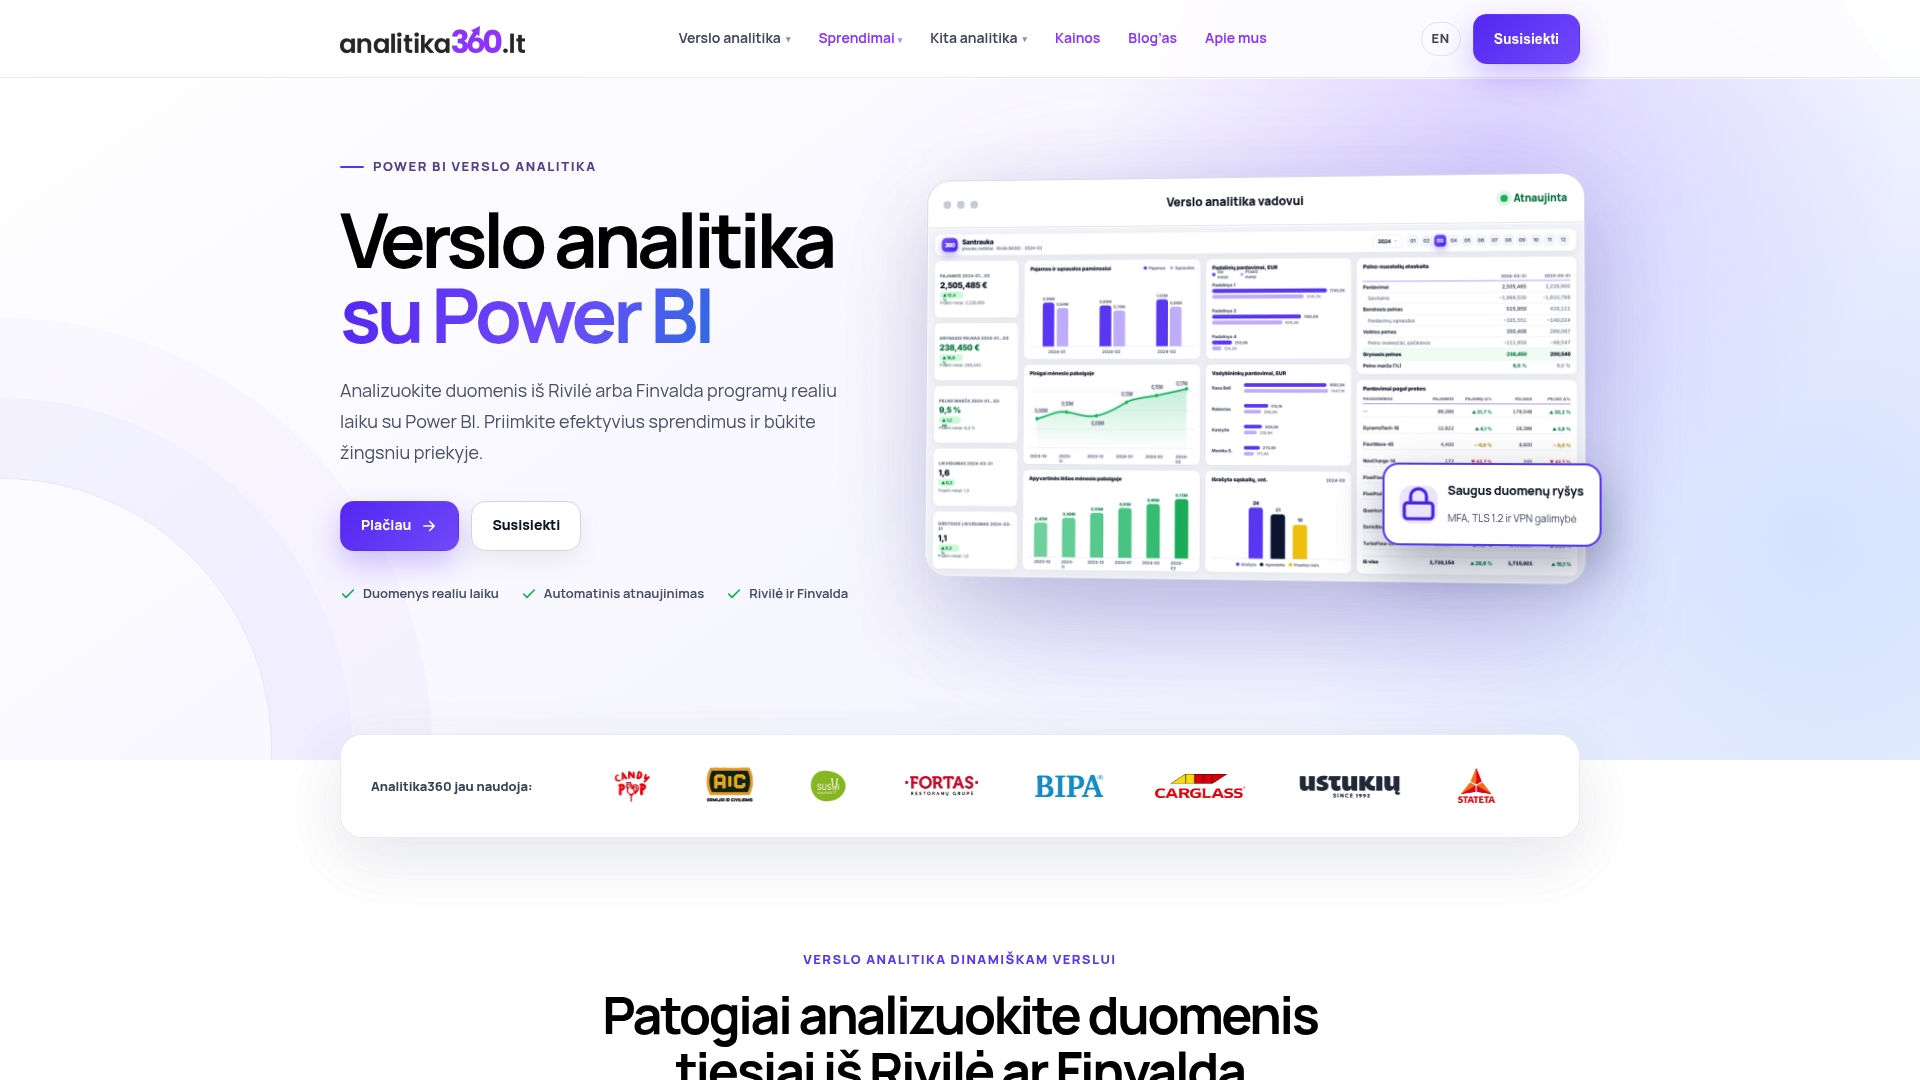
Different packages suit different types of business. For managers who need an overall financial and operational picture, there is the CockpitCEO package. Retail chains with several shops are better served by CockpitSHOPS, which focuses on sales and inventory metrics by branch. For companies using the Finvalda accounting system that want a simple start, there is the Power BI Finvalda Basic package.
Some packages combine data from Rivilė, Finvalda, SharePoint and Excel into a single dashboard that refreshes automatically. To find out which solution suits your business, browse all our business analytics solutions by business area and get in touch for a demo tailored to the accounting system you use.
What companies most often overlook when rolling out small business reporting
The most common mistake when rolling out automated reports is not the choice of technology but the number of KPIs. Companies want to see everything at once and cram twenty metrics into their first dashboard, ten of which nobody actually reads. It is better to start with five metrics that directly drive weekly decisions and expand only once they are genuinely being used.
The second common problem is unclear responsibility. When nobody is specifically responsible for keeping the data in order in Rivilė or an Excel file, the report shows discrepancies and managers lose trust in the whole solution, even if the problem lay in a single untidy field rather than in the system itself.
Experience shows that implementation goes most smoothly in companies that agree at the outset on a short, clear list of metrics and one person responsible for data quality in each source.
— Analitika360
Sources
- Business analytics with Power BI and Business Central | Softera
- Integration with Microsoft Power BI | Finvalda
- Business performance analytics with Power BI - Rivile